Abstract
One strategy for assessing efficacy of a liver transplant is to monitor perfusion and oxygenation after transplantation. An implantable optical sensor is being developed to overcome inadequacies of current monitoring approaches. To facilitate sensor design while minimizing animal use, a polydimethylsiloxane (PDMS)-based liver phantom was developed to mimic the optical properties of porcine liver in the 630-1000 nm wavelength range and the anatomical geometry of liver parenchyma. Using soft lithography to construct microfluidic channels in pigmented elastomer enabled the 2D approximation of hexagonal liver lobules with 15mm sinusoidal channels, which will allow perfusion with blood-mimicking fluids to facilitate the development of the liver perfusion and oxygenation monitoring system.
OCIS codes: (160.4760) Optical properties, (280.1415) Biological sensing and sensors, (110.7050) Turbid media, (170.1470) Blood or tissue constituent monitoring
1. Introduction
Over 6000 patients received liver transplantation each year from 2005 to 2008 [1]. Though many post-surgery factors may affect the health of liver grafts, vascular complications are significant contributors to graft failure [2,3]. These complications include hepatic artery thrombosis (HAT), hepatic artery stenosis (HAS), portal vein thrombosis (PVT), and arteriovenous fistulas [4]. Due to the limited number of cadaveric organs, transplantation of partial organs from living donors is becoming more frequent; however, this procedure has an even higher incidence of arterial thrombosis in the graft, resulting in organ damage. Thus, a strategy to detect vascular complications prior to organ injury is critical for graft health [5].
Continuous monitoring of local liver blood perfusion and oxygenation within the liver graft are potential strategies for physicians to monitor graft health after transplantation. Currently, a limited number of options are available for monitoring organ blood circulation, and no standard method exists for continuous tissue oxygenation and perfusion monitoring non-invasively. For a long time, pulse oximetry has been the gold standard for measuring arterial oxygen saturation; however this method does not give a direct measurement of perfusion levels. Flow oximeters based on near-infrared diffuse reflectance spectroscopy (DRS) and diffuse correlation spectroscopy (DCS) have been used to measure both tissue blood oxygenation and blood flow, but the systems can only measure total hemoglobin concentration for indirect estimation of tissue blood flow [6–8]. Some of the standard techniques used to monitor perfusion in clinical settings are Laser Doppler flowmetry (LDF), Doppler flowmetry, and time-transit Doppler flowmetry. Although LDF can be used to monitor tissue perfusion continuously, it is difficult to use in vivo due to its high sensitivity to motion artifacts. Some surgeons use non-quantitative Doppler flowmetry to assess post-operative hepatic artery flow, but this technique is not a comprehensive solution to hepatic graft monitoring due to inability to assess microvascular perfusion and oxygenation. Time-transit Doppler flowmetry, can be used intra-operatively to measure blood flow in vessels but cannot be used to monitor perfusion in the parenchyma. Furthermore, time-transit Doppler flowmetry is generally not feasible for monitoring of vascular perfusion post-operatively. Moreover, neither of these techniques provide information about the oxygenation state of the blood which is critical in determining the state of the graft. More recently, a device based upon thermal diffusion (HemedexTM) has been approved for post-operative quantification of microvascular perfusion in the liver, but it does not permit direct measurement of blood flow in either the hepatic artery or portal vein nor does it assess tissue oxygenation.
One potential solution to monitoring perfusion and oxygenation during and after liver transplantation is to develop an implantable optical sensor based on the principle of oximetry. The addition of a third wavelength near the isobestic point to the common two wavelengths used for oximetry may permit separation of perfusion and oxygenation signals. This would provide physicians with a minimally-invasive tool to monitor post-surgery blood perfusion and oxygenation in a transplant, enabling immediate detection of circulation deficiency in the critical 7-10 days following transplantation surgery. Such a rapid detection approach would increase the probability that pharmacological or surgical techniques would be applied in a timely manner, resulting in improved surgical outcomes of patients [9].
A prototype system is being developed as the first step toward meeting this need [5,10–13]. This sensor system is ultimately intended to be implanted on the surface of transplanted liver and/or its inflow vessels during surgery. Data transmission to a local receiver would enable immediate reporting of circulatory deficiencies to health care staff. Measurement of diffuse reflection is accomplished using a custom three-LED light source and an accompanying photo-detector [9]. This system exploits the wavelength-dependent absorption differences of oxy-hemoglobin (HbO2) and deoxy-hemoglobin (Hb) at 735, 805 and 940 nm to extract local circulation and oxygenation saturation information. As demonstrated in Fig. 1 , three wavelengths of light are input to the tissue, each applied separately in time (time domain multiplexed). The resultant diffuse reflection is measured by the photo-detector for each of the applied wavelengths (735, 805, and 940 nm), processed, and used to assess tissue perfusion and oxygenation status.
Fig. 1.
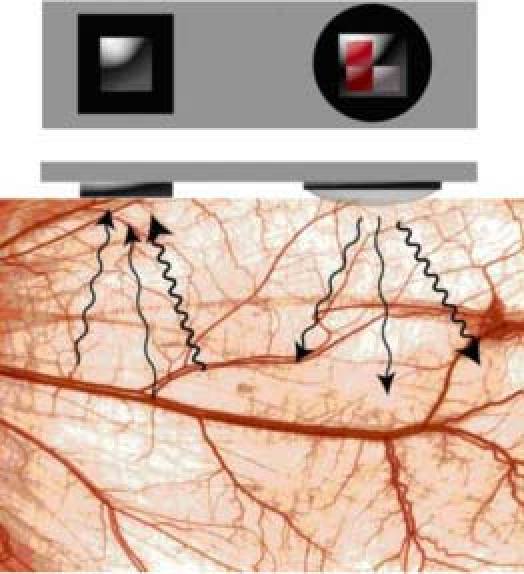
Scheme of time-domain multiplexed sensor system, where arrows indicate the use of three different source wavelengths [9].
To enable efficient sensor system design without unnecessarily using human or animal liver tissue, a liver-mimicking phantom allowing adjustment of perfusion status is needed to experimentally test prototypes. Specifically, a liver phantom is required to evaluate system performance, to optimize signal-to-noise ratio, and to compare performance among systems [14]. To our knowledge, however, there are no existing phantoms for liver that meet the key requirements of stability, optical properties and anatomy that match in vivo liver tissue, and controllable perfusion. Phantoms for ultrasound, CT and MRI are not suitable for use with optical diagnostic instrumentation because the optical properties for these phantoms do not match the liver tissue optical properties [15–24]. Additionally, the phantoms that have been designed specifically for optical measurement are limited, and most of them are in the aqueous phase [25,26] which are unstable, and do not allow perfusion, or they are only matched to tissue for a selected wavelength and do not match the liver’s optical properties over the broad range required for reflectance spectroscopy. Thus, a new phantom design is required.
To develop a liver phantom mimicking the function of blood perfusion, it is important to understand the blood supply system relative to the complex anatomical features of the liver. The liver parenchyma is organized into close-packed hexagonal structures called lobules, wherein a radial series of narrow channels connect the central vein to the peripheral edge of the hexagon. These channels, called sinusoids, have walls comprised by cords or plates of hepatocytes. The liver receives a dual blood supply from the hepatic portal vein and hepatic artery. The hepatic portal vein supplies venous blood that comprises ~75% of the total blood in the liver while the hepatic artery supplies arterial blood accounting for the remainder. Blood from the hepatic portal vein and artery branches out and flows through the sinusoids and empties into the central vein of each hepatic lobule. The degree of oxygen saturation is different between the portal vein and hepatic artery. Portal and hepatic track connections are located in the portal triad at the corner of each hexagonal hepatic lobule [27,28].
In this work, a microfluidic liver phantom was developed to meet the criteria for our purposes namely to; 1) match the optical properties of liver over the range of 630-1000nm; 2) allow adjustment of perfusion status; 3) provide ease in moldability; 4) provide good thermal stability and low chemical reactivity; 5) allow for sufficient elasticity to regain native shape after deformation under pulsatile flow; and 6) be suitable for use in a dynamic test apparatus. As described in this paper, all of these criteria were met using soft lithography to produce a silicone-based microfluidic system pigmented to match the optical properties of liver and by matching the fluidic system geometry to the native tissue structure, a close approximation to perfused liver was also achieved
2. Materials and Methods
2.1. Materials of Polydimethylsiloxane (PDMS)-based liver phantom
The main component of the liver phantom is Polydimethylsiloxane (PDMS) which is the most widely used silicon-based polymer [29] (SYLGARD® USA). The refractive index of PDMS (~1.4) is similar to that of soft mammalian tissue (1.33-1.50) [30]. Cured PDMS is stable, elastic and of adequate strength to be used for our system. The main scattering agent used was Al2O3 powder (99.99% purity, average particle size: 0.5-1μm, Inframat® Advanced MaterialsTM). A finer Al2O3 powder (99.99% purity, average particle size: ~100nm, Inframat® Advanced MaterialsTM) was used as an additional scattering agent. This second scatterer was included to adjust the scattering spectrum of 0.5-1μm Al2O3 powder, since many biological tissues exhibit Rayleigh-type scattering (λ−4 dependence) due to small-scale biological structures [31]. The main absorber is black ink (Black India 4415, Higgins®), since it is known to have a wide spectral range of relatively uniform absorption. It was used as the main absorber to mimic absorption over the range of 700-1000nm. Blue #1 food color (Wilton®) was used as an additional absorber to mimic absorption near 650nm.
2.2. Recipe design of liver phantoms
To develop a recipe for liver phantoms, the larger 0.5-1μm Al2O3 powder was mixed with uncured PDMS at different concentrations (5mg/mL, 10mg/mL and 15mg/mL) to determine the relationship of reduced scattering coefficient and concentration of larger Al2O3 powder. The curing agent was mixed at a volumetric ratio of 1:10. The reduced scattering coefficient of the larger 0.5-1μm Al2O3 powder diluted in PDMS with different concentrations was measured using an integrating sphere and calculated using the Inverse Adding-Doubling algorithm (IAD), as described in Section 2.3. As a function of larger 0.5-1μm Al2O3 powder concentration, the measured reduced scattering coefficient (1/mm) increased with a linear trend obtained from measurement: μs = 0.0448*[concentration of Al2O3 powder in mg/mL]. Although the Al2O3 powder has a broad size distribution covering ~0.5-1μm and Al2O3 particles are not regular spheres, this trend follows the general behavior expected from Mie theory; namely, that the reduced scattering coefficient is proportional to scatterer concentration.
A similar approach was used to measure the scattering of the smaller 100-nm Al2O3 powder with uncured PDMS (10mg/mL). The absorption coefficients of India ink and blue color were determined by a spectrometer (USB 4000, Ocean Optics, Inc.). According to calculation of Al2O3 powder concentrations, and after experimental optimization, the final recipe for the liver phantom was determined as follows: 7.29mg of 0.5-1μm Al2O3 powder, 2mg of 100nm Al2O3 powder, 0.67μL of black ink, and 2μL of blue food color mixed per 1mL of uncured PDMS.
2.3. Procedure of making PDMS-based liver phantoms
Mixtures of the two different sized Al2O3 powder, black ink, blue food color and uncured PDMS were prepared according to the designed recipe defined above. The mixture was sonicated and stirred until homogeneous, and the curing agent was then added at the volumetric ratio of 1:10. The resulting mixture was stirred and cast into molds (plastic Petri dishes 40mm in diameter). The thickness of phantoms was varied by dispensing uncured mixture into molds with a syringe to adjust the volume dispensed. After applying vacuum to remove bubbles, the samples were cured for two hours in an oven at 65◦C to completely crosslink the PDMS. All phantoms were left at room temperature for at least three days before determination of the optical properties.
2.4. Determination of the optical properties of PDMS-based slab liver phantom
The absorption coefficient (μa), reduced scattering coefficient (μs’), and anisotropy factor (g) of cured liver phantoms were determined by using an integrating sphere (IS) measurement system and the Inverse Adding-Doubling (IAD) software package (v 3.5.10, 11 May 2009) [32]. The total diffuse reflection (R) and diffuse transmission (T) collected by the integrating sphere were measured with a spectrometer (USB 4000, Ocean Optics, Inc.). The spectrometer was connected to the detector port of the integrating sphere via an optical fiber, and the metal part of the fiber connector was covered with a rough white paper. The properties of the integrating sphere (Labsphere®, North Sutton, New Hamsphere) were as follows: sphere diameter = 101.6mm; diameter of sample port (port 3 in Fig. 3 ) = 12.7mm; diameter of entrance port (port 1 in Fig. 3) = 12.7mm; diameter of detector port (port 2 in Fig. 3) = 1mm, reflectivity of inner wall = 96%. A tungsten halogen lamp (LS-1, Ocean Optics, Inc.) with collimated output was used as the light source. All samples were sandwiched between two 1 mm-thick microscope glass slides for the measurements.
Fig. 3.
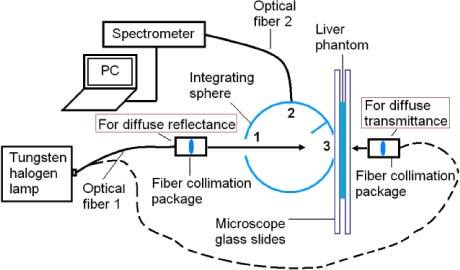
Integrating sphere system diagram used to measure diffuse reflection and transmission.
For diffuse reflection (R) measurement, the collimated light source was directed to the IS entrance port, forming a 6-mm spot on the sample placed at that location. The integration time of the spectrometer was set for 1 second. A dark background spectrum, collected while the entrance port was blocked, was subtracted from all measurements. Reflectance standards (R = 10% and R = 50%, SRS-10-010, SRS-50 010, Labsphere®, North Sutton, New Hamsphire) were used to obtain reflection spectra (R10% and R50%) for calibration. Finally, the diffuse reflectance (MR) was calculated using Eq. (1):
| (1) |
For the diffuse transmission (T) measurement, a similar procedure was followed wherein the sample was moved to the exit port. T0 was the spectrum collected without a sample present at the sample port. Diffuse transmittance (MT) was the ratio of T to T0.
For measurement of collimated transmission (MC) (Fig. 4 ), a pinhole (Thorlabs, Inc.) was used to confine the acceptance angle of photons reaching the detector to 0.16°. Spectra were collected by the spectrometer using optical fiber 3 (400-μm core and NA 0.37), and MC is was the ratio of U to U0. U is the intensity of unscattered light passing through the sample and U0 is the transmission spectrum without a sample at the sample port.
Fig. 4.
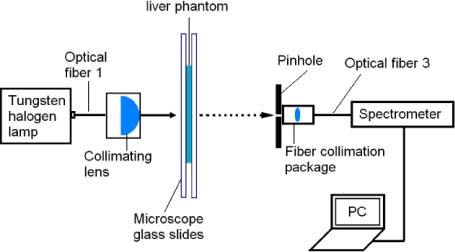
Diagram showing the measurement of collimated transmission.
Finally, the IAD software package was used to calculate the optical properties of the phantoms. The input values were diffuse reflectance (MR), diffuse transmittance (MT), and collimated transmittance (MC). The Inverse Adding-Doubling algorithm calculates the optical properties of a sample by iteratively solving the radiative transport equation until the solution matches the input values (MR, MT and MC) [33].
2.5. Microfluidic channels mimicking blood circulation of liver
To design a PDMS-based phantom capable of adjusting perfusion status, microfluidic channels mimicking architectures of liver circulation (Fig. 2 ) were needed. A two-dimensional pattern of channels approximating the hexagonal lobules and radial sinusoids was designed with computer aided design (CAD) software (Rhinoceros 4.0), as shown in Fig. 5 . Each regular hexagon unit (with 0.5-mm sides) mimics a liver lobule. Cross sections of the portal vein and hepatic artery branches are circular areas with 0.06 mm in diameter at each vertex of a hexagon. The central vein located in the center of each hexagon is 0.1mm in diameter. Sinusoids connecting central vein branches and portal vein branches or hepatic artery branches are 15μm-width channels with 50μm height. In contrast to the natural liver, each hexagonal unit mimicking a single hepatic lobule is connected with adjacent units with “sinusoids” and “portal vein branches” or “hepatic artery branches.” This network of microfluidic channels was designed to have two inlets (mimicking the portal vein and hepatic artery) and one outlet (mimicking the hepatic vein), allowing dyes mimicking oxygenated and deoxygenated blood to be pumped from separate inlets for adjustment of the model oxygenation and perfusion status of liver phantoms. The designed pattern was printed onto a transparent film with clear features and a black background as a mask for photolithography.
Fig. 2.
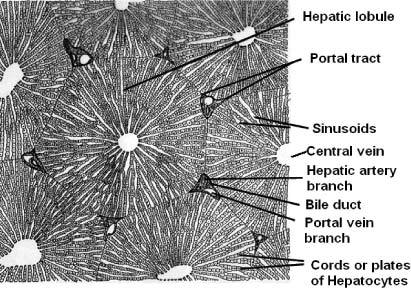
Anatomy of a porcine liver [29]
Fig. 5.
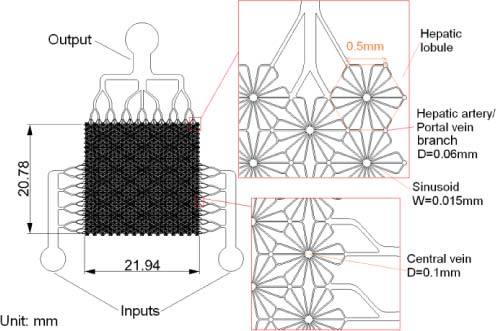
Designed pattern of microfluidic channels to mimic structures of hepatic artery/portal vein branches.
2.6. Fabrication of PDMS-based liver phantom with microfluidic channels
2.6.1. Fabrication of SU-8 molds
Four-inch silicon wafers were cleaned in diluted hydrochloric acid at 80°C for 20 min, sequentially rinsed with acetone, isopropyl alcohol (IPA) and deionized (DI) water, and then were dehydrated at 130°C for 30 minutes on a hot-plate. After allowing them to cool to room temperature, 50μm of thick photoresist on the wafer was deposited through two successive steps. Approximately 4mL degassed SU8-50 photoresist (MicroChem) was dispensed on the center of the wafer. The spread cycle of the wafer was ramped to 500RPM at an acceleration rate of 100RPM/s, and this speed was held for 10s to allow the photoresist to cover the entire surface of the wafer. The spin speed was then ramped to 2000RPM at an acceleration of 300RPM/s and held for a total of 30s. After 5 min post-coating relaxation, the photoresist was baked on a hot plate. Following pre-baking at 65°C for 10min, a soft bake was performed for 20 min at 95°C. After cooling, the photoresist was placed into a collimated UV lamp for exposure, and the film mask with the designed pattern was placed on top. A long-pass UV filter (PL-360LP, Omega Optical) was used to filter out wavelengths shorter than 360nm. An exposure time of 32s was used, during which time the SU-8 was exposed through the mask to the UV light with intensity of 80mW/cm2. Following exposure, a post-exposure bake was performed on a hot plate to selectively cross-link exposed portions of the photoresist layer. The post-exposure bake consisted of 1min at 65°C followed by 5min at 95°C. After cooling, development was performed for 6 min at room temperature using MicroChem’s SU-8 developer. The beaker containing the developer was agitated during development to ensure the uncross-linked part of the photoresist was dissolved completely. Following development, the substrate was rinsed with isopropyl alcohol (IPA), and then dried with a gentle stream of air. A final hard bake was performed at 135°C for 2 hours to increase the mechanical and chemical stability of the SU-8 mold, and to increase the adhesion to the wafer.
2.6.2. Fabrication of PDMS layers
A transparent microfluidic system was prepared to obtain clear microscope images for assessment of pattern transfer fidelity. To enhance bonding, a combination of corona treatment and partial curing was used. PDMS was mixed with curing agent at a volumetric ratio of 10:1 and degassed in a vacuum chamber for 40 min. Part of the degassed PDMS was poured onto the SU-8 mold, and the remainder was poured into a plastic box to make a 5-mm thick PDMS cover layer. The PDMS on the micropatterned mold was degassed again for 30 min to remove bubbles trapped between the micro channels. The degassed PDMS was pre-cured at 65°C for 50 min, and the PDMS layer was then carefully peeled from the SU-8 mold. Prior to bonding, small holes spaced the same as the access ports of the microfluidic channels were made in the 5-mm thick PDMS cover layer. To accomplish this, the micropatterned PDMS and the cover layer were corona treated and attached to one another. Holes were drilled through the thicker cover layer using 20-gauge needles, aligned such that the holes terminated at the ports of the microfluidic system. Flat-tipped needles were then inserted into the holes to create permanent connections to the microfluidic system. The bonded PDMS layers were then baked at 65°C for another 70 min to complete curing.
To make multilayered PDMS phantoms, a similar procedure was applied, with the exception that the positions of holes in the PDMS cover layer for the fluidic connections (3 per layer) were determined prior to attachment of the microchannel units. In this way, the microchannels were aligned with the pre-drilled holes at the time of attachment to the underlying layers. Figure 6 shows the scheme of a three-layer PDMS phantom, where each PDMS layer is 0.5 mm thick with 50μm-deep channels forming the model blood vessels. Note that the microchannels in each layer of the three-layer PDMS phantom are fully connected through “sinusoid” channels, whereas vertically stacked layers are not connected to one another. Three-dimensional networks that more fully represent the native liver anatomy will be the subject of future work if required.
Fig. 6.
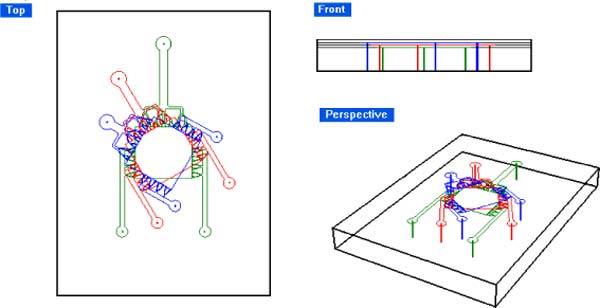
Scheme of three-layer stacked liver phantom system.
2.7. Experiment with single layer phantom
The experiment was performed with the prototype system of the implantable liver sensor probe introduced in section 1. The single layer parenchymal phantom was perfused with a dye solution that mimicks the absorption properties of hemoglobin in its fully oxygenated state. The mixture consisted of 0.165% v/v India Ink and 0.298 mg/mL Epolight 2717 dissolved in Phosphate Buffer Solution (PBS 0.01M, pH 7.4) [34]. To avoid clogging the channels, the solution was filtered through 0.45 µm syringe filter (VWR, cat. # 28145-481). Then a peristaltic pump (Minipuls 3, Gilson, Inc. Product # F117604) was used to pulse the dye solution through the phantom at various volumetric flow rates. The pump pulse rate was set at 100 beats per minute (bpm) for each of the experiments. The volumetric flow rate of the pump was varied within the range of physiologic rates for a section of liver parenchyma containing the same amount of sinusoids as the single layer phantom. The average volumetric flow rate of a human liver is 1450 mL/min, and the human liver contains between 50,000 to 100,000 lobules [35]. Using a simple calculation, the physiologic range for the phantom was determined. A mechanical arm was used to secure the probe to the surface of the phantom during the experiments. A display of the experimental setup can be seen in Fig. 7 .
Fig. 7.
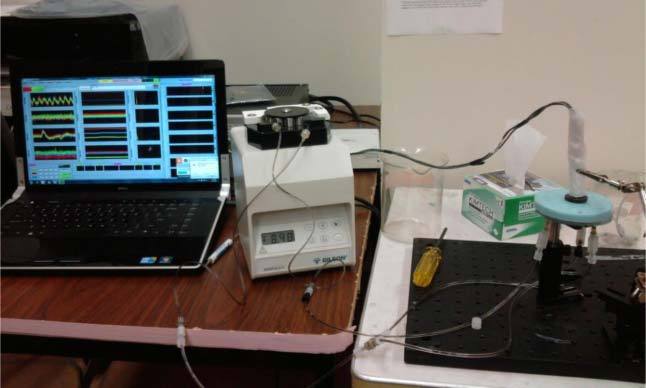
In vitro setup showing the peristaltic pump pumping the dye solution through the single layer parenchymal phantom with the mechanical arm holding the optical probe in place. Also shown is the computer containing the software used for data acquisition.
3. Results and discussion
3.1. Optical properties of PDMS-based slab liver phantom
Measured optical properties of the PDMS-based liver phantoms are presented in Fig. 8 in comparison to published values for porcine liver. The published optical properties of porcine liver are limited, as most available data are only given for a single wavelength (typically, around 630nm, as measured with N2/dye and HeNe lasers, the two sources used frequently in photodynamic therapy [36]). Only one set of data covers a broad range (400-2400nm) [37]. In that study, the porcine liver tissues were obtained from 5 adult domestic pigs. The livers were removed directly after sacrificing and frozen in liquid nitrogen without contact with ice or water. The measurement method involved a double-integrating sphere system, and the optical properties were calculated with Inverse Monte Carlo simulation. In Zhu’s paper [38], the porcine liver tissue was obtained within 1 hour postmortem. It was soaked in 0.9% isotonic saline solution for 10 min to remove residual blood, was wrapped in saline-moistened plastic membrane and cooled to −20°C. The measurement was performed using a double-integrating sphere and the optical properties were calculated with the Inverse Adding-Doubling algorithm. Wilson’s and Dorion’s samples were obtained post mortem, and optical properties were determined by diffusion theory on data collected from interstitial fiberoptic detectors. In Arnfield’s work [39], in vitro liver tissues were used without any preparation. The measurement method involved an interstitial cylindrical light source delivered by fiber optics and the optical properties were calculated with Grosjean’s equation modified for a cylindrical source. Oraevsky and Jacques’ used a photoacoustic approach to measure properties on dry, refrigerated tissue [40]. In the Beek’s paper, the porcine liver tissues were prepared as resected whole organ and in situ samples [40,41]. Two types of samples were measured using interstitial isotropic detectors. The effective attenuation coefficients were calculated with diffusion theory.
Fig. 8.
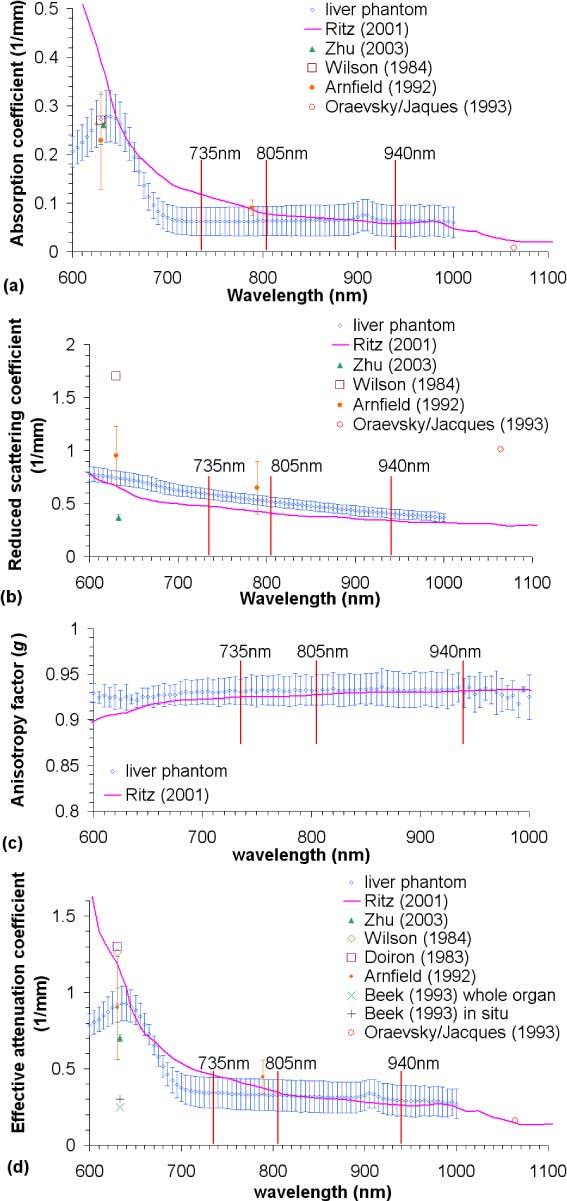
Optical properties of liver phantom compared to published data (a) Absorption coefficient (μa); (b) reduced scattering coefficient (μs′); (c) anisotropy factor (g); (d) effective attenuation coefficient (μeff).
The measured absorption coefficient (μa of Fig. 8(a)) of the silicone-based liver phantoms matches Wilson’s [36] and Arnfield’s data [39] at 630nm and Zhu’s data [38] at 632.8nm. However, the measured μa of the liver phantom around 630nm was smaller than Ritz’s. This difference is attributed to the sample preparation, where Ritz’s samples were not soaked in saline or rinsed with water to remove residual blood, but the residual blood of Zhu’s samples had been removed. The combination of oxygenated and deoxygenated blood contributes more absorption around 630 nm than in the longer wavelength range (800-1000 nm), so it was expected that the unperfused phantom would more closely match bloodless liver tissue. Elsewhere, the μa of the liver phantom matches Ritz’s data [33] in 780-1000 nm and Arnfield’s data at 789 nm [39]. The measured phantom absorption was also smaller than Ritz’s data over 670-780 nm, while Parsa et al. [42] reported μa values of murine liver that were much higher than Ritz’s data. Unfortunately, in this range, the published absorption of porcine liver is very limited, and which can be trusted as a gold standard is unclear. Ultimately, our goal is to match the properties of perfused tissue in situ, and any discrepancy between phantom properties and perfused native liver can be reduced by small adjustments in phantom absorber and scatter concentrations, combined with the introduction of a dye mixture mimicking the optical properties of oxygenated and de-oxygenated blood flowing through microfluidic channels within the PDMS-based phantoms.
The reduced scattering coefficient (μs’ = μs × (1-g) in Fig. 8(b)) of the liver phantom is slightly higher than Ritz’s data [37]. At 632.8nm, it was two times higher than Zhu’s data, yet smaller than Arnfield’s and Wilson’s reported values at 630nm. These differences are again attributed to different sample preparations, as well as different measurement methods and algorithms. Most importantly, the measured μs’ of liver phantoms is in between these published data.
Anisotropy factors (g of Fig. 8(c)) also agree well with those of Ritz’s values [37], the only published anisotropy factors of porcine liver available in the literature. Over the entire range of interest, the reported values of g fell within the experimental variations of our measurements.
The effective attenuation coefficient (μeff = (3μa × (μa + μs’))0.5 of Fig. 8(d)) is the reciprocal of penetration depth. Published values of μeff also vary significantly, mainly due to the large variance in reduced scattering values. The μeff values as measured for the phantoms match those of Ritz’s paper [37] over 640-670 and 740-1000nm, agree with Arnfield’s data at 630nm, and otherwise falls between the lower values reported by Beek and Zhu and higher values published by Wilson and Doiron [36]. As noted above, the μeff of the liver phantom is smaller than Ritz’s data for the 670-740nm range, due to the lower value for μa of the liver phantom. As with μa, this difference should be compensated when the phantom is perfused with dyes mimicking blood.
3.2. PDMS-based liver phantom with microfluidic channels
Figures 9(a)-(c) show images of a clear single-layered PDMS microfluidic system, comprised of a thin upper layer with channels bonded to a thick PDMS slab. Diluted red ink was injected into the input channels to enhance the image contrast. Figure 9(a) is the macro picture of the single-layered system. Figure 9(b) and (c) are microscope pictures showing the details of the hexagonal patterns mimicking hepatic lobules. It is intended that future perfusion experiments will employ multi-layer phantoms with multiple PDMS-based channel systems stacked vertically to more closely approximate normal liver tissue. In this situation, dye combinations mimicking oxygenated and de-oxygenated blood can be injected into two inlet channels separately for each layer, or the layers could be vertically connected. In either case, the perfusion status of dyes mimicking oxygenated and deoxygenated blood may be adjusted by pumps. To illustrate the potential to achieve the former structure, transparent three-layer PDMS phantoms were fabricated as well. It was not possible to microscopically image these effectively, because the background scattering light blurred the image and it was not possible to locate multiple layers in the same focal plane; thus, only photographs (Fig. 10 ) were taken.
Fig. 9.
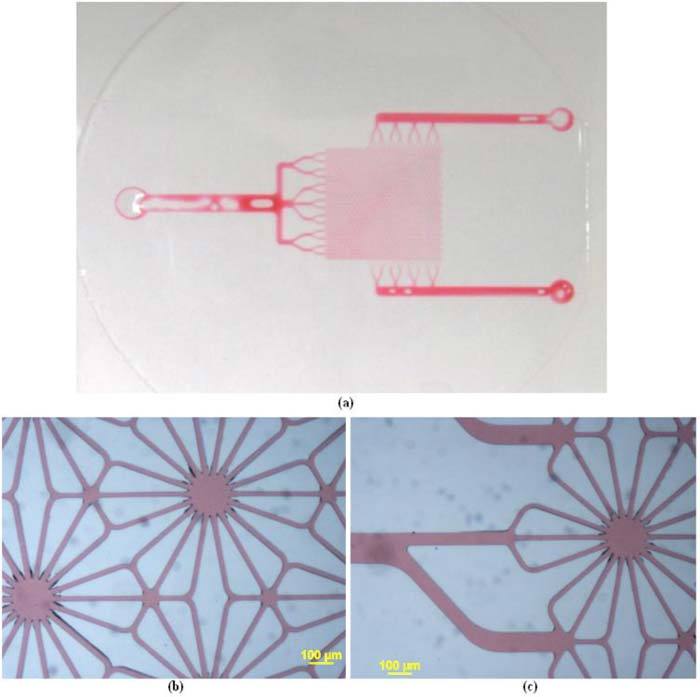
(a) Red ink injected into the ports (b) detailed hexagonal pattern (c) input channel to the hexagonal pattern.
Fig. 10.
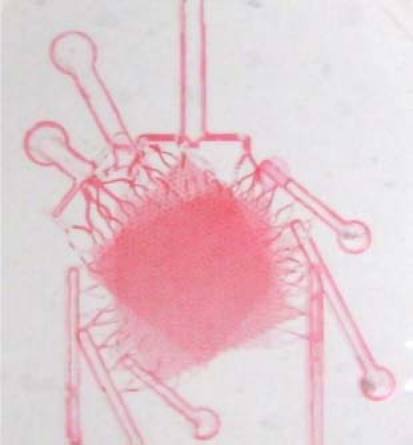
Three-layered liver phantom system, based on the design shown in Fig. 6.
Finally, the single-layer microfluidic systems with optical properties mimicking actual liver tissue in the 630 to 1000 nm wavelength range were fabricated as shown in Fig. 11 . The PDMS was mixed with scattering agent and absorbers based on the recipe described in Section 2.2 and cast on to the SU8 mold to form microchannels. Note that although the absorption and scatter properties match those of actual liver across the 630-1000 nm range they do not match the properties below that range and thus the phantom has a bluish tint. Red ink was injected into the inlets to provide visual contrast. While the individual channels cannot be resolved, it is clear from this image that the pattern has been accurately transferred to the liver-pigmented PDMS and the channels are intact and open for perfusion.
Fig. 11.
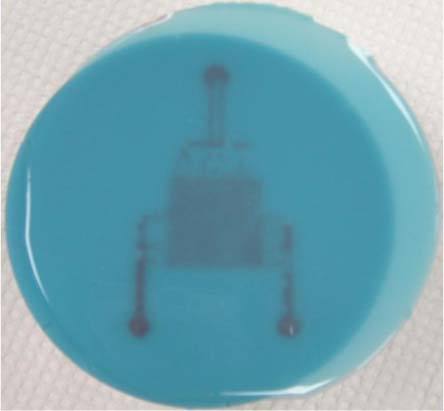
Single layer microfluidic liver phantom after injection of red ink
3.3. Experimental results with single layer phantom
Figure 12 contains a 10-second segment of the time domain AC signal (Fig. 12(a)) measured using the sensor introduced in Section 1, the corresponding Fast Fourier Transform (FFT) (Fig. 12(b)) of the AC signal, and a plot of the FFT peak power corresponding to the pulsatile flow (100 bpm ≈1.667 Hz) vs. perfusion (Fig. 12(c)). The FFT magnitude values increased linearly with respect to the increase in perfusion. The FFT spectrum contains a peak at 1.667 Hz, which corresponds to the pump pulse rate (100 bpm) further demonstrating the ability of the phantom to mimic the in vivo case. Another peak around 0.7Hz in the FFT spectrum corresponds to noise picked up by the sensor, confirmed when the frequency of the imposed flow was varied and that peak did not vary in location. The plot of FFT peak value vs. volumetric flow rate shows that the FFT values increase linearly with an increase in volumetric flow rate. The linearity of the curve demonstrates the ability of the phantom to be used for perfusion studies, which will facilitate the sensor system design and optimization.
Fig. 12.
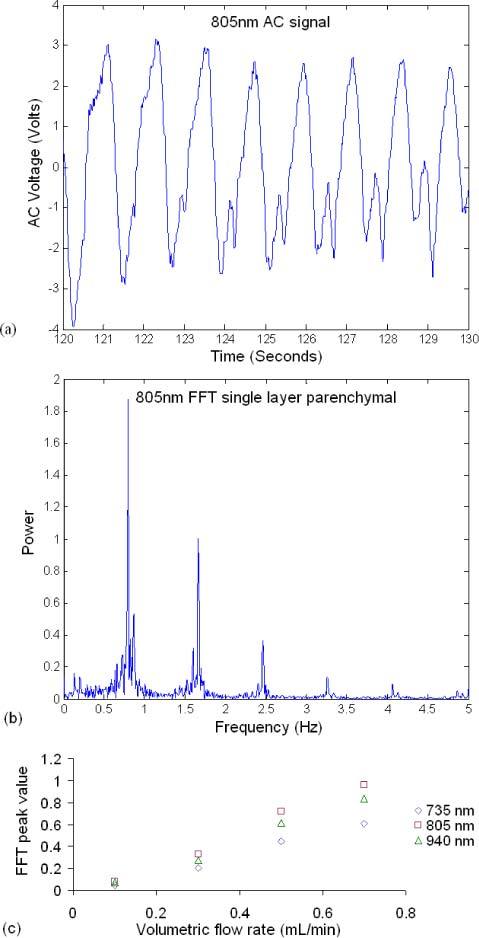
(a) 10-second segment of the time domain AC signal measured from the single layer parenchymal phantom, (b) corresponding FFT spectrum of (a), and (c) FFT value at 1.667 Hz vs. volumetric flow rate.
4. Conclusion
PDMS-based liver phantoms were developed to fulfill our need for a stable, liver mimicking system that has the same optical properties in the 630-1000 nm range and a similar anatomical geometry of liver parenchyma enabling the design and test of optical devices for perfusion and oxygenation assessment. The recipe, while yielding a material that appears blue to the eye, matches the reported optical properties of porcine livers over most of the near-infrared range of interest (630-1000 nm). The phantom is easily moldable, of good thermal stability and of low chemical reactivity. The model system was designed using patterns that mimic the natural anatomy of the liver, providing a means of modeling the optical properties of liver tissue with and without blood. It is also noteworthy that the use of elastomeric PDMS provides a system with some compliance, which enables the effective reproduction of pulsatile flow conditions that mimic vibrations of hepatic circulation vessels. The results measured with the prototype system on the phantom demonstrate that the fluid can be pulsed through the phantom at volumetric flow rates mimicking the in vivo case, which showed the ability of the phantom to be used for perfusion studies to facilitate the sensor system design and optimization. Via perfusion of liquids with optical properties similar to blood, such a system will facilitate the development of optical devices intended to monitor blood volume, pulse rate, and oxygenation status.
Acknowledgments
This work is funded by a bioengineering research partnership (BRP) grant from NIH (#5R01-GM077150). We also would like to thank Barts and The London School of Medicine and Dentistry for permitting use of the porcine liver micrograph (Fig. 2).
References and links
- 1.Thuluvath P. J., Guidinger M. K., Fung J. J., Johnson L. B., Rayhill S. C., Pelletier S. J., “Liver transplantation in the United States, 1999-2008,” Am. J. Transplant. 10(4p2), 1003–1019 (2010). 10.1111/j.1600-6143.2010.03037.x [DOI] [PubMed] [Google Scholar]
- 2.Settmacher U., Stange B., Haase R., Heise M., Steinmüller T., Bechstein W. O., Neuhaus P., “Arterial complications after liver transplantation,” Transpl. Int. 13(5), 372–378 (2000). 10.1111/j.1432-2277.2000.tb01012.x [DOI] [PubMed] [Google Scholar]
- 3.Stange B. J., Glanemann M., Nuessler N. C., Settmacher U., Steinmüller T., Neuhaus P., “Hepatic artery thrombosis after adult liver transplantation,” Liver Transpl. 9(6), 612–620 (2003). 10.1053/jlts.2003.50098 [DOI] [PubMed] [Google Scholar]
- 4.Pungpapong S., Manzarbeitia C., Ortiz J., Reich D. J., Araya V., Rothstein K. D., Muñoz S. J., “Cigarette smoking is associated with an increased incidence of vascular complications after liver transplantation,” Liver Transpl. 8(7), 582–587 (2002). 10.1053/jlts.2002.34150 [DOI] [PubMed] [Google Scholar]
- 5.Ericson M. N., Wilson M. A., Cote G. L., Baba J. S., Xu W., Bobrek M., Britton C. L., Hileman M. S., Moore M. R., Emery M. S., Lenarcluzzil R., “Implantable sensor for blood flow monitoring after transplant surgery,” Minimally Invasive Therapy & Allied Technol. 13, 87–94 (2004). [DOI] [PubMed] [Google Scholar]
- 6.Boas D. A., Yodh A. G., “Spatially varying dynamical properties of turbid media probed with diffusing temporal light correlation,” J. Opt. Soc. Am. A 14(1), 192–215 (1997). 10.1364/JOSAA.14.000192 [DOI] [Google Scholar]
- 7.Shang Y., Zhao Y. Q., Cheng R., Dong L. X., Irwin D., Yu G. Q., “Portable optical tissue flow oximeter based on diffuse correlation spectroscopy,” Opt. Lett. 34(22), 3556–3558 (2009). 10.1364/OL.34.003556 [DOI] [PubMed] [Google Scholar]
- 8.Yu G. Q., Durduran T., Zhou C., Zhu T. C., Finlay J. C., Busch T. M., Malkowicz S. B., Hahn S. M., Yodh A. G., “Real-time in situ monitoring of human prostate photodynamic therapy with diffuse light,” Photochem. Photobiol. 82(5), 1279–1284 (2006). 10.1562/2005-10-19-RA-721 [DOI] [PubMed] [Google Scholar]
- 9.Ericson M. N., Wilson M., Cote G., Britton C. L., Xu W., Baba J., Bobrek M., Hileman M., Moore M., Frank S., “Development of an implantable oximetry-based organ perfusion sensor,” Conf. Proc. IEEE Eng. Med. Biol. Soc. 3, 2235–2238 (2004). [DOI] [PubMed] [Google Scholar]
- 10.T. J. King, T. J. Akl, R. Long, M. J. McShane, M. N. Ericson, M. Wilson, and G. L. Cote, “A phantom that mimics optical and flow properties of liver for developing a perfusion sensor,” presented at Biomedical Engineering Society Annual Meeting, Austin, TX (Oct. 6–9, 2010). [Google Scholar]
- 11.Lee S. J., Ibey B. L., Xu W., Wilson M. A., Ericson M. N., Coté G. L., “Processing of pulse oximeter data using discrete wavelet analysis,” IEEE Trans. Biomed. Eng. 52(7), 1350–1352 (2005). 10.1109/TBME.2005.847538 [DOI] [PubMed] [Google Scholar]
- 12.Subramanian H., Ibey B. L., Xu W. J., Wilson M. A., Ericson M. N., Coté G. L., “Real-time separation of perfusion and oxygenation signals for an implantable sensor using adaptive filtering,” IEEE Trans. Biomed. Eng. 52(12), 2016–2023 (2005). 10.1109/TBME.2005.857667 [DOI] [PubMed] [Google Scholar]
- 13.Subramanian H., Ibey B. L., Xu W. J., Wilson M. A., Ericson M. N., Coté G. L., “An autocorrelation-based time domain analysis technique for monitoring perfusion and oxygenation in transplanted organs,” IEEE Trans. Biomed. Eng. 52(7), 1355–1358 (2005). 10.1109/TBME.2005.847552 [DOI] [PubMed] [Google Scholar]
- 14.Pogue B. W., Patterson M. S., “Review of tissue simulating phantoms for optical spectroscopy, imaging and dosimetry,” J. Biomed. Opt. 11(4), 041102 (2006). 10.1117/1.2335429 [DOI] [PubMed] [Google Scholar]
- 15.Casciaro S., Conversano F., Musio S., Casciaro E., Demitri C., Sannino A., “Full experimental modelling of a liver tissue mimicking phantom for medical ultrasound studies employing different hydrogels,” J. Mater. Sci. Mater. Med. 20(4), 983–989 (2009). 10.1007/s10856-008-3644-6 [DOI] [PubMed] [Google Scholar]
- 16.Cournane S., Cannon L., Browne J. E., Fagan A. J., “Assessment of the accuracy of an ultrasound elastography liver scanning system using a PVA-cryogel phantom with optimal acoustic and mechanical properties,” Phys. Med. Biol. 55(19), 5965–5983 (2010). 10.1088/0031-9155/55/19/022 [DOI] [PubMed] [Google Scholar]
- 17.Harris E. J., Miller N. R., Bamber J. C., Symonds-Tayler J. R. N., Evans P. M., “Speckle tracking in a phantom and feature-based tracking in liver in the presence of respiratory motion using 4D ultrasound,” Phys. Med. Biol. 55(12), 3363–3380 (2010). 10.1088/0031-9155/55/12/007 [DOI] [PubMed] [Google Scholar]
- 18.Kim K. S., Lee J. M., Kim S. H., Kim K. W., Kim S. J., Cho S. H., Han J. K., Choi B. I., “Image fusion in dual energy computed tomography for detection of hypervascular liver hepatocellular carcinoma: phantom and preliminary studies,” Invest. Radiol. 45(3), 149–157 (2010). 10.1097/RLI.0b013e3181d32119 [DOI] [PubMed] [Google Scholar]
- 19.Kopka L., He H. D., Foley W. D., Hu H., Jacobson D. R., Grabbe E. H., “Low-contrast detectability of a new multislice versus a monoslice helical CT in a liver phantom,” Radiology 209(P), 284 (1998).9769848 [Google Scholar]
- 20.Martinsen A. C. T., Saether H. K., Olsen D. R., Skaane P., Olerud H. M., “Reduction in dose from CT examinations of liver lesions with a new postprocessing filter: a ROC phantom study,” Acta Radiol. 49(3), 303–309 (2008). 10.1080/02841850701793769 [DOI] [PubMed] [Google Scholar]
- 21.Olerud H. M., Olsen J. B., Skretting A., “An anthropomorphic phantom for receiver operating characteristic studies in CT imaging of liver lesions,” Br. J. Radiol. 72(853), 35–43 (1999). [DOI] [PubMed] [Google Scholar]
- 22.Prakash P., Converse M. C., Mahvi D. M., Webster J. G., “Measurement of the specific heat capacity of liver phantom,” Physiol. Meas. 27(10), N41–N46 (2006). 10.1088/0967-3334/27/10/N01 [DOI] [PubMed] [Google Scholar]
- 23.Schindera S. T., Nelson R. C., Mukundan S., Jr, Paulson E. K., Jaffe T. A., Miller C. M., DeLong D. M., Kawaji K., Yoshizumi T. T., Samei E., “Hypervascular liver tumors: low tube voltage, high tube current multi-detector row CT for enhanced detection--phantom study,” Radiology 246(1), 125–132 (2008). 10.1148/radiol.2461070307 [DOI] [PubMed] [Google Scholar]
- 24.Wang H. Z., Xu L. F., Yu J., Huang Q. M., Wang X. Y., Lu L., Wang H., Huang Y., Cheng H. Y., Zhang X. L., Li G. Y., “Phantom study of the classification of liver fibrosis based on nuclear magnetic resonance elasto-graphy,” Acta Phys Sinica Ch. Ed. 59, 7463–7471 (2010). [Google Scholar]
- 25.Passos D., Hebden J. C., Pinto P. N., Guerra R., “Tissue phantom for optical diagnostics based on a suspension of microspheres with a fractal size distribution,” J. Biomed. Opt. 10(6), 064036 (2005). 10.1117/1.2139971 [DOI] [PubMed] [Google Scholar]
- 26.Sun P., Wang Y., “Measurements of optical parameters of phantom solution and bulk animal tissues in vitro at 650 nm,” Opt. Laser Technol. 42(1), 1–7 (2010). 10.1016/j.optlastec.2009.06.001 [DOI] [Google Scholar]
- 27.“Liver,” http://en.wikipedia.org/wiki/Liver
- 28.“Lobules of liver,” http://en.wikipedia.org/wiki/Liver_lobule
- 29.“Polydimethylsiloxane,” http://en.wikipedia.org/wiki/Polydimethylsiloxane
- 30.Bolin F. P., Preuss L. E., Taylor R. C., Ference R. J., “Refractive index of some mammalian tissues using a fiber optic cladding method,” Appl. Opt. 28(12), 2297–2303 (1989). 10.1364/AO.28.002297 [DOI] [PubMed] [Google Scholar]
- 31.S. L. Jacques, “Skin Optics” (1998), http://omlc.ogi.edu/news/jan98/skinoptics.html
- 32.S. A. Prahl, “Inverse Adding-Doubling,” http://omlc.ogi.edu/software/iad/
- 33.Prahl S. A., van Gemert M. J. C., Welch A. J., “Determining the optical properties of turbid mediaby using the adding-doubling method,” Appl. Opt. 32(4), 559–568 (1993). 10.1364/AO.32.000559 [DOI] [PubMed] [Google Scholar]
- 34.Akl T. J., Long R., McShane M. J., Ericson M. N., Wilson M. A., Cote G. L., “Optimizing probe design for an implantable perfusion and oxygenation sensor,” submitted to Biomed. Opt. Express. [DOI] [PMC free article] [PubMed] [Google Scholar]
- 35.A. C. Guyton, “The liver as an organ,” in Textbook of Medical Physiology, 8th ed. (W. B. Saunders, Philadelphia, 1991), p. 771. [Google Scholar]
- 36.Wilson B. C., Patterson M. S., “The physics of photodynamic therapy,” Phys. Med. Biol. 31(4), 327–360 (1986). 10.1088/0031-9155/31/4/001 [DOI] [PubMed] [Google Scholar]
- 37.Ritz J. P., Roggan A., Isbert C., Müller G., Buhr H. J., Germer C. T., “Optical properties of native and coagulated porcine liver tissue between 400 and 2400 nm,” Lasers Surg. Med. 29(3), 205–212 (2001). 10.1002/lsm.1134 [DOI] [PubMed] [Google Scholar]
- 38.Zhu D., Luo Q. M., Cen J. A., “Effects of dehydration on the optical properties of in vitro porcine liver,” Lasers Surg. Med. 33(4), 226–231 (2003). 10.1002/lsm.10215 [DOI] [PubMed] [Google Scholar]
- 39.Arnfield M. R., Mathew R. P., Tulip J., McPhee M. S., “Analysis of tissue optical coefficients using an approximate equation valid for comparable absorption and scattering,” Phys. Med. Biol. 37(6), 1219–1230 (1992). 10.1088/0031-9155/37/6/002 [DOI] [PubMed] [Google Scholar]
- 40.Cheong W. F., Prahl S. A., Welch A. J., “A review of the optical-properties of biological tissues,” IEEE J. Quantum Electron. 26(12), 2166–2185 (1990). 10.1109/3.64354 [DOI] [Google Scholar]
- 41.J. F. Beek, H. J. van Staveren, P. Posthumus, H. J. C. M. Sterenborg, and M. J. C. Gemert, “The influence of respiration on the optical properties of piglet lung at 632.8 nm,” in Medical Optical Tomography: Functional Imaging and Monitoring, G. Müller, B. Chance, R. R. Alfano, S. R. Arridge, J. Beuthan, E. Gratton, M. Kaschke, B. R. Masters, S. Svanberg, and P. van der Zee, eds. (SPIE Optical Engineering Press, Bellingham, 1993), Vol. IS11, pp. 193–210. [Google Scholar]
- 42.Parsa P., Jacques S. L., Nishioka N. S., “Optical properties of rat liver between 350 and 2200 nm,” Appl. Opt. 28(12), 2325–2330 (1989). 10.1364/AO.28.002325 [DOI] [PubMed] [Google Scholar]


