Abstract
We implemented a Lagrange-multiplier (LM)-based damped least-squares (DLS) control algorithm in a woofer-tweeter dual deformable-mirror (DM) adaptive optics scanning laser ophthalmoscope (AOSLO). The algorithm uses data from a single Shack-Hartmann wavefront sensor to simultaneously correct large-amplitude low-order aberrations by a woofer DM and small-amplitude higher-order aberrations by a tweeter DM. We measured the in vivo performance of high resolution retinal imaging with the dual DM AOSLO. We compared the simultaneous LM-based DLS dual DM controller with both single DM controller, and a successive dual DM controller. We evaluated performance using both wavefront (RMS) and image quality metrics including brightness and power spectrum. The simultaneous LM-based dual DM AO can consistently provide near diffraction-limited in vivo routine imaging of human retina.
OCIS codes: (010.1080) Active or adaptive optics, (220.1080) Active or adaptive optics, (170.1790) Confocal microscopy, (330.4460) Ophthalmic optics
1. Introduction
The retina is a thin layer of neural and support cells lining the inside of the eye. Due to the aberrations of the eye’s optics, it is difficult to image the fine details of the retina in a living subject. Adaptive optics (AO) allows the aberrations of the eye to be corrected, providing the potential to in vivo image the retina at cellular level [1]. To take advantage of the increased resolution afforded by AO, many AO systems for retinal imaging have been developed, including AO fundus cameras, AO Scanning Laser Ophthalmoscope (SLO) systems and AO optical coherence tomography (OCT) systems [1–9]. Almost all systems used a wavefront sensor to measure wavefront aberrations of the eye and the system, and then corrected the wavefront errors with a deformable mirror (DM). There are two major approaches to quantifying how well these AO retinal imaging systems are correcting the wavefront aberrations. One common approach is to use a wavefront-based metric, typically the residual wavefront root-mean-square (RMS) error estimated from the wavefront sensor. RMS metrics have the advantage of being simple, but suffer from the disadvantage that they are susceptible to non-common path errors and biases. As a result, image-based metrics, either in terms of a point spread function (PSF) obtained separately from a special camera or an image quality metric is generally preferred. Nevertheless, the wavefront-based metrics provide an important reference for evaluating AO performance. According to the Maréchal criterion for Rayleigh diffraction-limited imaging, the RMS wavefront error at wavelength (λ) 840 nm should be kept below than λ/14 or 0.06 micron (µm) for Strehl ratio of 0.82, and to less than λ/21 or 0.04 µm for Strehl ratio of 0.92 [10]. Due to the limited correction capability of DMs and especially due to the dynamic nature of the eye’s aberrations, existing AO systems for retinal imaging seldom reach these limits. For published single deformable mirror (DM) AO correction, the wavefront residual aberration in RMS was reported to be 0.07-0.08 µm at best for in-vivo human subjects [4,5,9], and generally it was around 0.1-0.2 µm. The best resolution was reported for an AOSLO system as being approximately 2.5 µm [11], although precise details vary with pupil size, wavelength and boundary conditions [12].
In addition to the difficulties of correcting optical aberrations in dynamics, such as the eye movements and tear film changes, human eyes pose additional challenges for wavefront correction in that many individuals have large amounts of low order wavefront errors (sphere and astigmatism), and therefore a high dynamic range for wavefront correction is needed. MEMS-based DMs and piezoelectric-based DMs have exquisite wavefront control but a limited dynamic range (around 2-6 µm of DM stroke or 4-12µm of wavefront correction). Thus it can be necessary to pre-correct subjects’ low order refractive errors through a careful selection of trial lenses before AO imaging. A number of electromagnetic mirrors have larger strokes but often are limited in their corrections of high order aberrations. If different retinal locations are to be corrected either through changes in fixation or the use of different field angles [9,13], the problem is compounded since aberrations can change significantly across the visual field [14–17].
For these reasons a number of researchers have been testing dual-DM AO, configured as “woofer-tweeter” (W-T) systems, where a large amplitude lower-actuator-count mirror provides low order correction and a small stroke high-actuator-count DM provides high order correction [18–23]. The application of dual DM AO corrections were first reported in wavefront turbulence correction in astronomy [24–30] and recently implemented in retinal imaging in vision science [18–20,23]. Because the two DMs contribute to the same wavefront correction and are coupled to the same wavefront sensor (the S-H sensor) via their respective influence matrixes, they are not mathematically independent. The dual DM AO correction can be implemented either successively or simultaneously. According to slope measurement S, the problem of implementing simultaneous dual DM AO control is how to partition the wavefront aberration between the two DMs through reasonable actuator vectors X for the woofer DM and Y for the tweeter DM.
For successive correction, the woofer DM was first applied to correct the low order aberrations to its convergence, and then the tweeter DM was applied for the residual high-order aberrations [18–21]. For simultaneous correction, the first reported approach was to split the Zernike coefficients of the measured wavefront, and estimate the actuator commands of the two DMs independently from the split Zernike coefficients [24]. Approaches to W-T correction splitting in Fourier space has also been reported [30], where the DM commands are obtained using a Fourier reconstructor. Conan et al. proposed constructing a new set of influence functions from a given set [27], such as the tweeter, so that it is orthogonal to the woofer and a successful implementation was reported by Li et al. [23]. In 2008, we proposed the construction of a composite influence matrix for both DMs using a Lagrange-Multiplier (LM) method, and employing the damped least-squares (DLS) method to suppress the correlation between the two DMs [31]. This paper reports the full implementation and in vivo evaluation of dual DM AOSLO retinal imaging with the LM-based DLS control algorithm. While there are additional issues in improving wavefront control, including optimizing sensor estimates and improving control loops, this paper used identical processing steps except for the mirror control and thus provides direct comparisons and evaluations between the AO control algorithms.
2. Methods
2.1. Implementation of dual DM AO in SLO
Figure 1 sketches the system design of the wide-field SLO with the W-T dual DM AO developed at the Indiana University [13]. The woofer is a 52-actuator, 50-µm wavefront stroke Electromagnetic DM (Mirao) from Imagine Eyes [32], and the tweeter is a 140-actuator, 4-µm wavefront stroke DM from Boston Micromachines Corporation (BMC) [33]. A Shack-Hartmann (SH) wavefront sensor consists of a lenslet array and a Charge-Coupled Device (CCD) camera [34,35], providing wavefront measurements at about 15 Hz. The pitch of the lenslet at the pupil plane of the wavefront sensor was 0.3 mm and the focal length 7.6 mm. The wavefront sensing beacon (740 nm) and the imaging source (840 nm) are both derived from a supercontinuum laser (Fianium Inc.). The pupil of the eye is relayed to the pupil conjugates located at the fast and slow scanners, the woofer and tweeter DMs, and the lenslet array of the SH sensor. The SLO system has a programmable scanning area, with four typical sizes, 0.59° × 0.93° (Scan Size 1), 1.19° × 1.86° (Scan Size 2), 1.78° × 2.79° (Scan Size 3) and 2.38° × 3.72° (Scan Size 4). The wide-field imager and the large spherical mirrors allow the AOSLO imaging field to be placed by the experimenter within a 30 degree field of view.
Fig. 1.
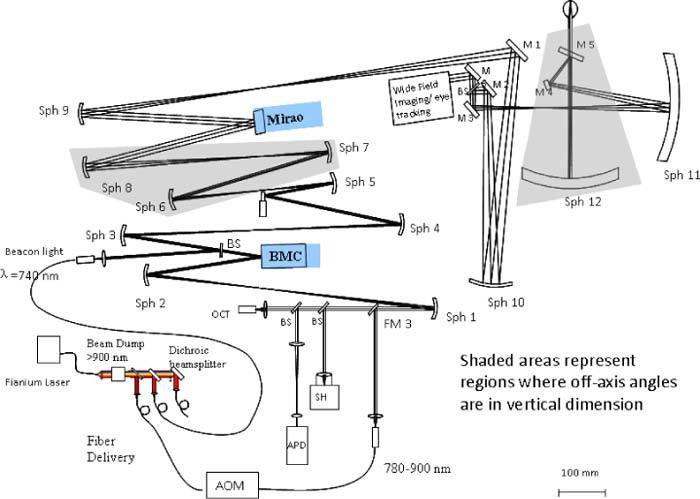
Indiana wide-field W-T dual DM AOSLO system
2.2. AO control methods
In this approach an “imaginary” DM was established from two optically conjugated DMs which are coupled to the same SH wavefront sensor via their individual influence matrices. A composite influence matrix C was created by combining A and B, the influence matrices of the woofer and tweeter DMs, respectively. To suppress the correlations between two the DMs and obtain reasonable actuator solutions, the DLS solution was employed [36–38], which can be expressed as
| (1) |
where X is the vector of actuator demands for the woofer DM, and Y for the tweeter DM. The Lagrange multiplier β was set to 1 in this system, and λ1 and λ2 are damping factors for the two DMs. To compare the performance of the dual DM AO to single DM AO, and the successive dual DM AO in the same system, we implemented the AO controls in the system described above. We compared the results with five experimental control conditions: (a) For simultaneous control we used the LM DLS algorithm described above (“LM DLS Dual DM” mode); (b) For classical single DM control we used either the Mirao DM alone (“Single Mirao” mode), or (c) the BMC DM alone (“Single BMC” mode); We also tested two successive controls, for which either (d) the Mirao DM was first used initially for correcting and then the BMC DM (“Mirao held+BMC” mode) or (e) the BMC DM was first used and then the Mirao DM (“BMC held+Mirao” mode).
2.3. Damping factor selection and wavefront aberration correction
As a measure of control matrix stability, the condition number for a normal control matrix is typically defined as the ratio of the maximum eigenvalue to the minimum eigenvalue. Ideally it would be 1 if all of the actuators had the same weighting factors, which would represent a very stable system. However, this is ideal and with continuous membrane AO systems the condition number typically deviates significantly from this ideality. When the condition number is large, there are large differences in the relative influence of actuators on the system control, with some having a large affect and others less or almost no influence. As a result, modes with small weights can require large motions, and small errors or noise can then generate large or erroneous wavefront deflections, and thereby resulting control instability.
For optimum control, the eigenvalues should have similar values. Damping is employed to leverage the wavefront correction among actuators with different weighting factors [36]. A very large damping factor improves the condition number of the control matrix but decreases wavefront correction efficiency because the correction steps would be small. On the other hand for a poorly-conditioned system, too small a damping factor would lead to poor stability due to its sensitivity to sensor noise. Thus, based on a grid search, we selected the median value of the eigenvalue spectrum of the control matrix as the damping factor. For our dual DM AOSLO configuration, the medians of the eigenvalues of normal influence matrices ATA, BTB, and CTC are close (λ1 = 3146, λ2 = 3690 and λ3 = 3339, respectively). There are two options for selecting the damping factors: We can either differentiate damping factors λ1 and λ2 for the Mirao DM and BMC DM, respectively (Option 1), or adopt the same damping factor λ3 for both DMs (Option 2). Figure 2 shows the eigenvalue spectrum of the control matrices with and without damping. Due to the correlation between the two DMs, the eigenvalue spectrum of the composite influence matrix (Black circle curve) is not the direct addition of the eigenvalue spectra of the two individual influence matrices (Green curves). After applying damping, the deviation of the spectrum was reduced, and the condition number improved from 134 to 12 both for applying the differentiated damping factors λ1 and λ2, and for using a single damping factor λ3.
Fig. 2.
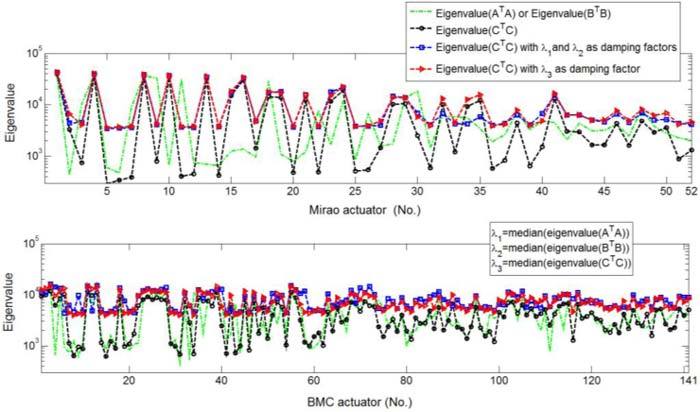
Eigenvalue spectrum conditioning for the normal control matrices Top panel: Eigenvalues of the Mirao DM. Bottom panel: Eigenvalues of the BMC DM.
2.4. Analysis of imaging performance
In this paper we analyze imaging performance using both wavefront metrics (RMS wavefront error) and image metrics. The RMS error was computed from S-H wavefront measurements and fitted using either Zernike modal estimation through 7th order or zonal wavefront integration. For image metrics we used three different computations. The first computation was simply the average intensity of a fixed paper target. The average image brightness is a metric of image quality for a confocal system, as long as the pinhole is not too large relative to the diffraction limited PSF size. This is because for a scanning confocal system the light source is first imaged onto the target as a point, and then the illuminated point of the target is imaged back through the system onto the confocal aperture. If the PSF size decreases due to the AO control, it becomes smaller relative to the pinhole size, and therefore more light will reach the detector. Thus, the brightness provides a comparative metric for wavefront control with the different algorithms. The second metric is to compare the spatial frequency power spectrum of the confocal image produced, which is more suitable for living eyes where the brightness can vary markedly between individuals and over retinal areas. In this paper we concentrated on imaging cone photoreceptors near the center of the human fovea since these cells provided “targets” that varied in feature size across the foveal region. The packing density of cone photoreceptors was between 100,000 and 324,000 cones/mm2 at the fovea [39]. To generate an estimate of the sampling array we computed the Fourier transform of the cone mosaic at different distances from the foveal center [40], which allowed us to estimate the resolving ability of the system, and thus to infer whether the system can resolve features at specific frequencies. In theory a confocal system has better resolution than a non-confocal imaging system. To take advantage of the increased resolution of a confocal system requires a small pinhole, and the advantage decreases as the pinhole size increases [41,42]. Thus for the majority of our measurements we used a pinhole that was approximately twice the size of the theoretical Airy disc and compared our results to optical Rayleigh predictions for resolution and MTF of an ideal optical system. To test whether our control is able to perform at a level that allows improved lateral resolution we employed a third technique. In this technique we decreased the pinhole size to approximately ½ the diameter of the theoretical Airy disc and we imaged the central foveal cones in a subject with more than 200,000 cones/mm2. We then selected bright cones, superimposed the cones and performed a spatial average. If a cone were a true point source or much smaller than the PSF of the system, the image of the average foveal bright cones would be the PSF of the system. However, since they are not that small, the image represents a convolution of the “true” cone with the PSF of the system, which implies that the estimated spatial extent of the cones provides a conservative estimate of the PSF size.
2.5. Human subjects
We performed retinal imaging in five healthy subjects (four males and one female). The subjects ranged in age from 26 to 42, and they had refractive errors between 0 and 6.5 diopters. Informed consent was obtained after a full explanation of the procedures and consequences of this study. All subjects had received a complete eye examination within a year. Pupils were dilated with 0.5% tropicamide during data collection. The research was conducted according to the tenets of the Declaration of Helsinki, and all protocols were approved by the Indiana University Institutional Review Board. For each imaging we adjusted the AO control pupil to match the size of the subject’s dilated pupil, and thus the pupil size for calculations varies across subjects.
3. Results with an artificial eye
3.1. Comparison between single, successive and dual AO controls
We first tested the AOSLO control using an artificial eye composed of a 100-mm focal length lens with a Φ7.56-mm pupil, and a paper target (a dollar bill) on a movable slide. Example results for the dual DM control are presented in Fig. 3 . Wavefront RMS was reduced from 5 to 6 µm to less than 0.1 µm for a large defocus correction, or from 0.7 µm to around 0.025 µm for small aberrations correction which corresponds to a Strehl ratio of 0.97 for wavelength at 840 nm. This confirms that the wavefront control accuracy of the dual DM AOSLO for the model eye enables diffraction-limited imaging in the near infrared.
Fig. 3.
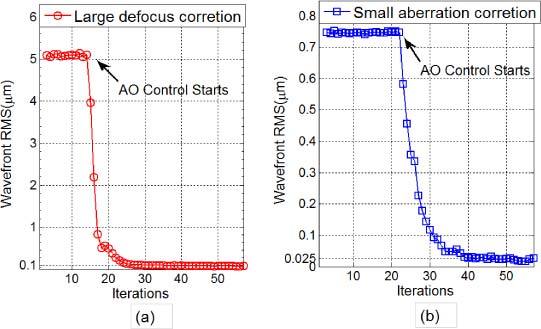
Wavefront error reductions of (a) large and (b) small aberrations over a Φ7.56mm pupil
Figure 4 shows the results of AO performance of the simultaneous dual DM control (LM DLS) in comparison with the single DM AO and the successive dual DM AO using both the RMS wavefront error and the averaged image brightness as metrics. For all five control conditions the loop gain was set to 0.3, and the target position was adjusted for best focus so that the BMC DM would be least likely to saturate in the “Single BMC” mode. The remaining aberrations to correct were the AOSLO system aberrations due to uncompensated astigmatism, coma and the high-order aberrations of the model eye. The scanning size used was 1.19° × 1.86°, wavefront pupil size was Φ7.22 mm, and the sample size used for evaluating the averaged image intensity was 200 × 200 pixels2. In general there is an agreement between the RMS estimate of corrected wavefront and the image brightness but the two are not perfectly correlated. In all cases the simultaneous “LM DLS Dual DM” mode always provided the smallest wavefront RMS error and the brightest image.
Fig. 4.
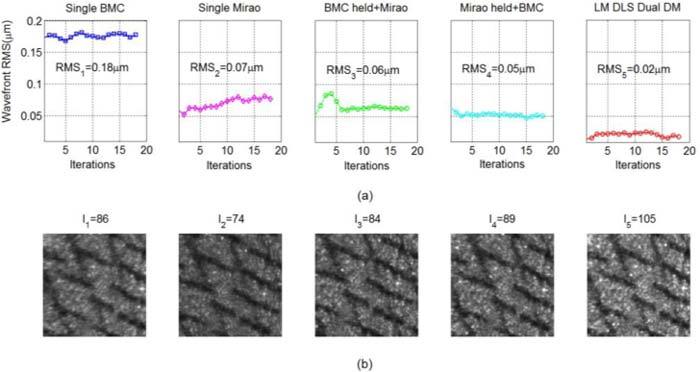
Comparison of wavefront control between different AO modes. (a) Wavefront RMS comparison (Pupil Φ7.22 mm). (b) Averaged image intensity comparison. The LM DLS controller always provided the smallest wavefront RMS error and the brightest image.
In the data for Fig. 4, the BMC correction was the worst, primarily because the stroke was nearly saturated due to its limited 2-µm dynamic stroke of mirror deflection. Tests with smaller initial aberrations showed that the BMC wavefront correction accuracy can be small (~0.04 µm). Due to the local response nature of the BMC DM (Influence function affects only a very small mirror area), saturations at some points or at the edges did not result in a major deterioration of the wavefront correction of the unsaturated area, so the overall imaging quality was still good. For the successive dual DM AO, the second DM is dominant in wavefront correction. Given different initial conditions, the performances of the successive AO modes can deviate significantly. In the “Mirao held + BMC” mode, where we “froze” the Mirao at its best correction and then switched to the BMC, the BMC DM was least likely to saturate, so it was usually found a little better than the other way around. This result is similar to those reported by Chen et al. [20]. It was worth mentioning that the “Single Mirao” AO mode drifted a bit more than the other modes. Overall the stability of the “LM DLS Dual DM” mode seemed higher and so we did an additional experiment to test the long term stability of this control.
3.2. Complementarity and stability test
Figure 4 implies that the LM DLS dual DM AO distributed the wavefront error to both DMs complementarily, yielding improved wavefront correction accuracy over that achieved by either DM alone or two DMs in successive use. To test this we performed the following experiments.
In the First Experiment, we tested the correction capability of dual DM AO with a noisy individual matrix. The influence matrix of Mirao DM was well-calibrated with a collimated LED beacon from infinity as the point light source, and the wavefront control accuracy of single Mirao DM was about 0.094 µm RMS. The influence matrix of BMC DM was also calibrated in the same manner but with deliberately added scattered light to degrade the centroiding accuracy of the SH spots. The AO control accuracy of the single BMC DM control in this instance was 3.2 µm in RMS due to the noisy influence matrix calibration. Then the two above calibrated influence matrices were combined with the LM DLS algorithm, and the resulting dual DM AO control provided an accuracy of 0.024µm in RMS with standard deviation of 0.005µm as shown in Fig. 5(a) .
Fig. 5.
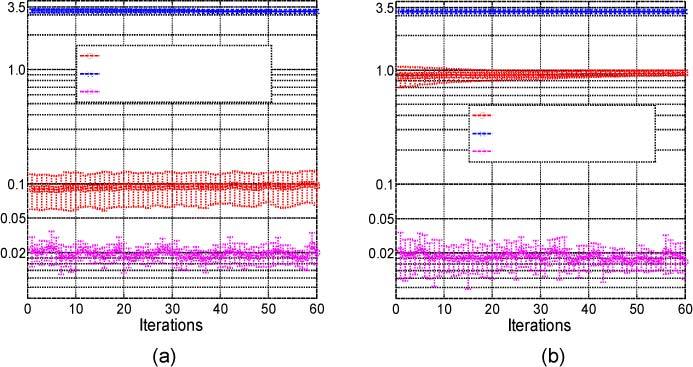
Comparison of wavefront control accuracies of a single DM AO (Mirao, and BMC) with the LM DLS dual DM AO (Mirao + BMC): (a) “Well-calibrated” Mirao DM + “Badly-calibrated” BMC DM. (b) “Badly-calibrated” Mirao DM + “Badly-calibrated” BMC DM.
In the Second Experiment, the influence matrix of the Mirao DM was calibrated by using the 740-nm wavefront sensing beacon scattered from the model eye. Since the beacon light was reflected from the Mirao on its way to the target (a dollar bill) as the mirror actuators were sequentially poked, the beacon location moved slightly on the target, which introduced tilt errors in influence function. When the single Mirao control was then run, the final wavefront accuracy was 0.92 µm RMS. Next, the “bad” Mirao influence matrix and “bad” BMC influence matrix obtained in last experiment were combined with the LM DLS algorithm, and surprisingly the dual DM AO control was equally low (0.02 µm in RMS with standard deviation of 0.007 µm (Fig. 5(b)) similar to the value obtained in the first experiment. In Fig. 5 each curve was obtained by averaging 10 sets of experimental data for each method with error bars indicating standard deviations. According to these two experiments, the LM DLS dual DM AO control succeeds in using the influence functions of the two DMs complementarily, and thus the DLS control is able to provide a robust control in the presence of errors of the influence matrices.
In panels (a)-(d), the images from top to bottom are the actuator stroke profiles of BMC and Mirao DMs, and the slope vector plot of the residual wavefront error for (a) 3-minutes, RMS = 0.02µm; (b)30-minutes, RMS = 0.022µm; (c) 60-minutes, RMS = 0.026µm; and (d) 90-minutes, RMS = 0.027µm. We can see that the DM correction gradually saturates over time. Panel (e) shows the wavefront RMS errors recorded in 1.5 hours.
Although correlations between the two DMs were suppressed by the damping method employed, they were not eliminated, and thus over time the two mirrors can start to oppose each other and drift from their neutral profiles. As a result the two DMs could become saturated over time, even if a high accuracy wavefront correction was still maintained. To test this we performed AO correction established in the Second Experiment on the model eye for 90 minutes at a correction rate of 15 Hz. Figures 6 (a)-(d) show the gray scale plots of relative mirror displacement for the two mirrors and the local slope plots for the corrected wavefront at 3 minutes, 30 minutes, 60 minutes and 90 minutes. As predicted, the two mirrors gradually drifted from their neutral positions; however, as shown in Fig. 6 (e) the wavefront control accuracy was kept at about 0.025 µm in RMS although by the end of 90 minutes the control variance increased.
Fig. 6.
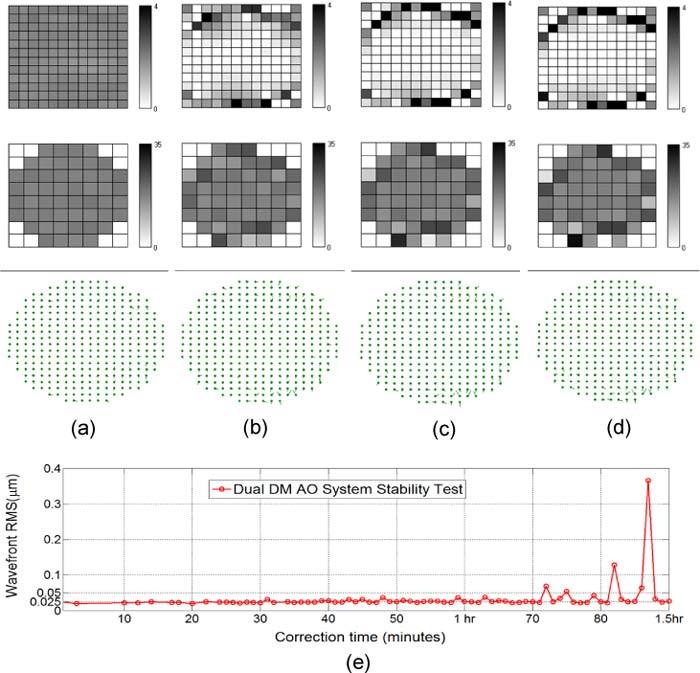
Stability performance of the LM DLS dual DM AO system
4. Retinal imaging
Since the LM DLS dual DM AOSLO was developed in 2009, we have performed retinal imaging with many subjects. In this section we report the results of systematic measurements in five healthy subjects obtained in 2010.
4.1. Retinal imaging comparisons with dual DM AO
Both the successive dual DM control and simultaneous dual DM AO control produced good quality images from living subjects. Figures 7(a)-(b) compare the routine images of the two AO modes near the fovea for Subject S3 who had a Ф6.48-mm pupil. Both pictures were 300 × 300 pixels single-frame retinal images of the same parafoveal location. They were taken with exactly the same conditions, such as the same scan size (1.78° × 2.79°) and the same focusing layer, except that the AO control was switched from the successive “Mirao held + BMC” dual DM mode to the simultaneous LM DLS dual DM mode. We can see that the image of simultaneous dual DM AO (Fig. 7(b)) has higher image contrast, higher image intensity and sharper image structure details. As shown in Fig. 7(c), after the LM DLS AO converged wavefront error of human eyes can generally be corrected to the RMS value of about 0.05 µm in real time (standard deviation: 0.01 µm). Despite the relatively small pupil for this subject, the retinal photoreceptors could be resolved close to the fovea using the simultaneous approach.
Fig. 7.
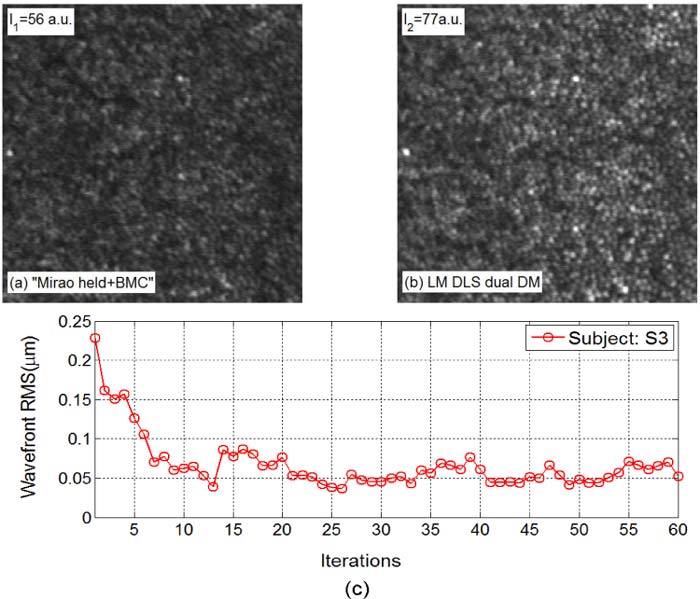
Retinal images obtained with (a) successive dual DM AO and (b) simultaneous LM DLS dual DM AO. (c) Wavefront error reduction with the DLS AO routine correction (Pupil size Ф6.48mm)
In Fig. 8 we also characterize system performance by comparing the images obtained with no subject to estimate system noise, and the images of retina of Subject S1 with and without AO corrections. The power spectra of the images are shown, where the Fourier power at each frequency is summed over orientation. For this subject at this location the highest resolvable spatial frequency of the image was about 0.25 cycles/µm without AO, and it was increased to close to 0.40 cycles/µm with AO on. According to the Raleigh criteria, the minimum resolvable size for a Φ6.84-mm pupil at the wavelength of 840 nm is 2.5 µm (0.40 cycle/µm in spatial frequency) for a modified Gullstrand schematic eye [43], so the AO image in Fig. 8 is close to the Raleigh diffraction limit, but it is still below the MTF cutoff frequency (0.49 cycle/µm). Noise levels for the three conditions differ due to their very different image intensities under the three conditions.
Fig. 8.
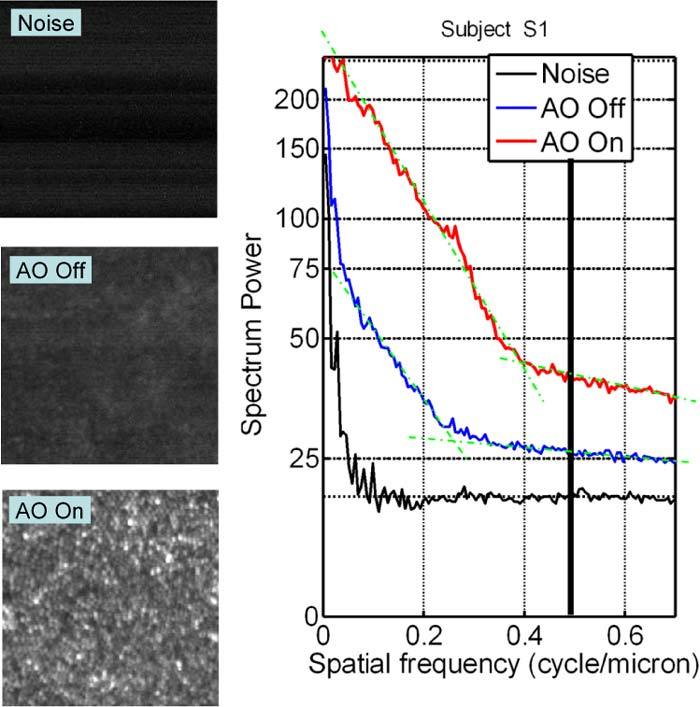
Comparison of noise (no eye in system), foveal images with and without AO. The image inserts are each 256 × 256 pixels, and the AO-Off image display has been scaled in intensity by 2 × relative to the AO-On image. The right panel is the Fourier spectral power plot for each of the image conditions. The vertical black line represents the ideal MTF cutoff frequency of this system, and the green dot-dash lines were added for showing the trends of the power spectral curves.
4.2. Foveal retinal imaging
Parafoveal retinal imaging has been reported by many authors [2,8,9,13,19]. Our DLS-based dual DM AOSLO system can resolve the cone photoreceptors in parafoveal as well as in foveal regions. Figure 9 presents images near the foveal center for two subjects (S1 and S2) obtained using two scan sizes that sampled at 0.67µm/pixels (Figs. 9(a)-(b)) and 0.33 µm/pixels (Fig. 9 (c)). Figure 9 (c) was the same region analyzed as the yellow window in Fig. 9 (b) except that its scan size was smaller. We can see that the foveal cone photoreceptors were resolvable.
Fig. 9.
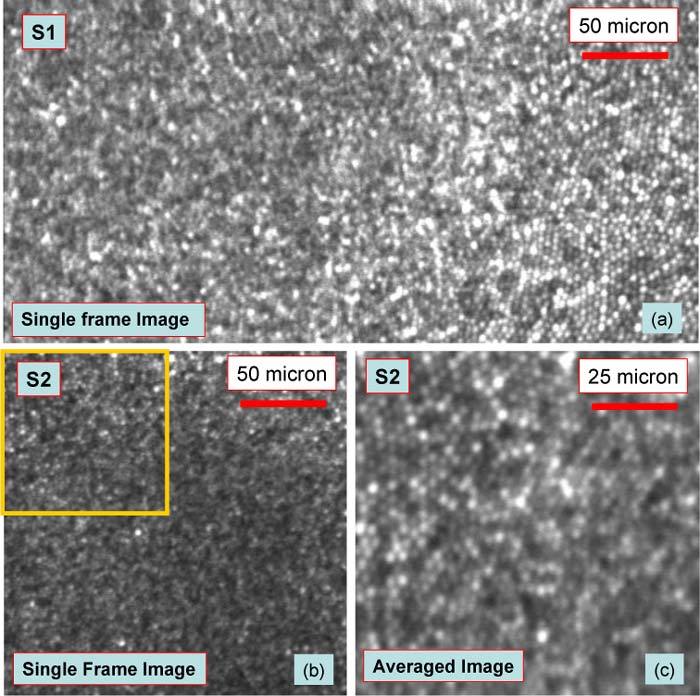
Foveal cone photoreceptor images. (a)-(b) are the foveal images of S1 and S2 obtained both with Scan Size 2 (1.19° × 1.86°). (c) is foveal image of S2 obtained with Scan size 1(0.59° × 0.93°), which was the same region as shown in yellow square window in (b). All images were trimmed to maintain pixels as square.
5. Evaluation of the retinal imaging quality
5.1. Fourier analysis of retinal images
The power spectrum describes the amplitude of the spectral power in the images that is distributed across spatial frequency, where the spectral power is computed by radially integrating the Fourier spectrum for each spatial frequency. For cone images, a local peak at a specific spatial frequency ξ0 in the power spectrum represents the fundamental sampling frequency of the retina. Stated differently, the 1/ξ0 size of cone spacing can be resolved in the retinal images. The adequacy of the power spectral analysis was confirmed by counting the cone densities within the sample windows. Given the hexagonal packing feature of the human cone photoreceptor, the neighboring cone spacing can be estimated by (µm), where the cone density N is in cones/mm2. The diffraction-limited MTF for the measured pupil sizes allows an estimate of the expected contrast attenuation with spatial frequency independent of the specific resolution criterion chosen, and it can be plotted using the formula [44]
| (2) |
where ξcutoff is the system cutoff frequency. The Nyquist sampling limit of our system for Scan sizes 1-3 are 0.5 cycle/µm, 0.75 cycle/µm and 1.5 cycle/µm, respectively.
Figures 10 -13 compare images and their spectral analysis for four subjects in parafoveal and foveal regions. The local peaks of the power spectrum represent the dominant cone spacing within the sampling windows. In Window #1 of Fig. 10 (0.84° eccentricity) the dominant cone spacing was approximately 3.85 µm (0.26 cycle/µm) and in Window #2 (0.39° of eccentricity) spacing decreases to about 3.2 µm (0.31cycle/µm). The cone density determined by counting the data of Fig. 10 were 78399 cones/mm2 and 103200 cones/mm2 for Windows #1 and #2 respectively and the corresponding spacings were 3.84µm and 3.34µm, in reasonable agreement with the power spectral analysis.
Fig. 10.
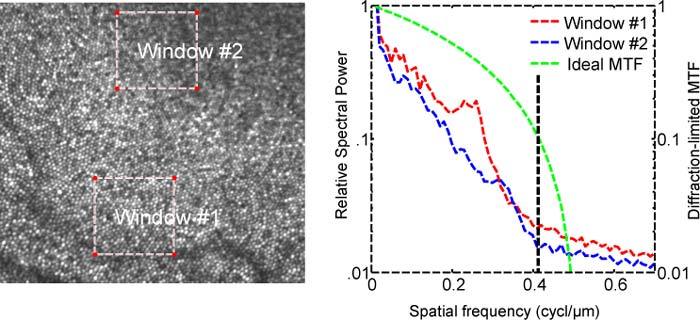
Left: Image of Subject S4. Right: Power spectrum of the two windows indicated on the left. Curves are the total power at a given frequency over all orientations. For reference the diffraction-limited MTF of a system with the same numerical aperture is shown in green curve and the vertical black line shows Rayleigh diffraction limit, which is 0.42 cycle/µm in this figure for pupil size of Φ7.2 mm.
Fig. 13.
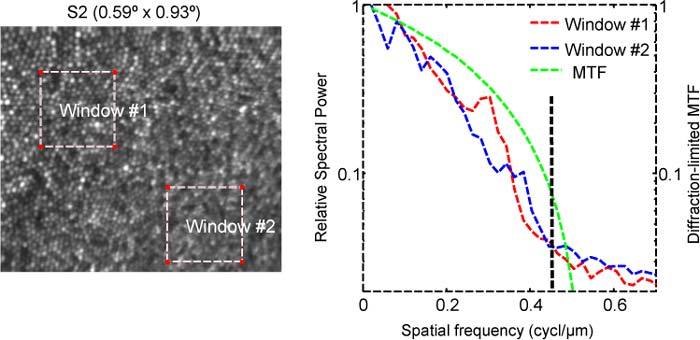
Similar to Fig. 10, but for subject S2 and with a smaller scan size. The Raleigh diffraction limit is 0.44 cycle/µm for subject pupil size of Φ 7.6 mm.
Figure 11 shows data from Subject S1 and the analysis for two windows. The peaks in the spatial power curves are at 0.28 cycle/µm and 0.4 cycle/µm for Windows #1-2, respectively. This gives dominant cone spacings of 2.5µm and 3.57µm accordingly. For comparison, the measured cone packing densities of Windows #1-2 were 106510 cones/mm2 and 180470 cones/mm2, respectively, from which the corresponding cone spacings were estimated as 3.29µm and 2.53µm. Given that the Raleigh diffraction limit for imaging pupil of Φ6.84 mm is 0.4 cycles/µm, we are resolving at least to the Rayleigh limit and a bit better.
Fig. 11.
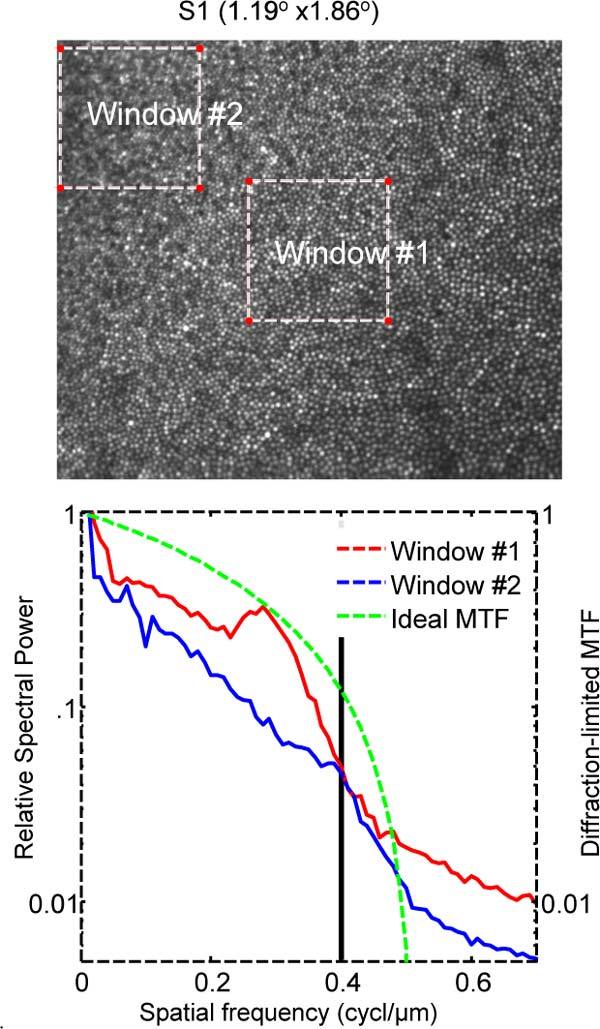
Power spectrum of foveal retinal image of Subject S1. Details are as described in Fig. 10.
Figure 12 is the foveal data from Subject S5. The spectral peak was at 0.29 cycle/µm (cone spacing 3.4 µm) within Window #1. Window #2 selected at the location with the highest cone density has a peak at about 0.38 cycle/µm (2.6 µm cone spacing), which was the Rayleigh diffraction limit for Subject S5 with the pupil size of Ф6.48 mm. This peak extended out toward 0.46 cycle/µm (2.17 µm cone spacing), which was the MTF cutoff frequency.
Fig. 12.
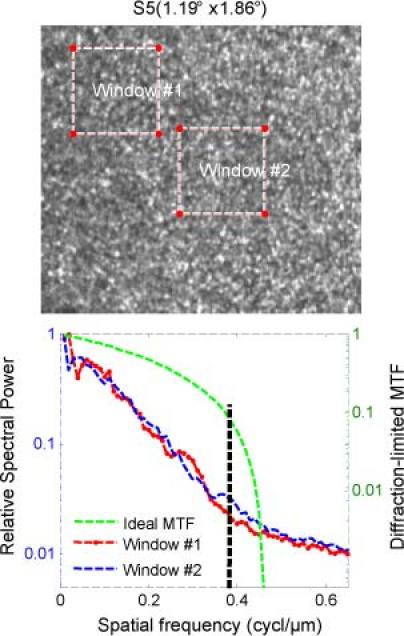
Similar to Fig. 10, but for Subject S5 (pupil size Ф 6.5 mm).
For the data in Fig. 13, we used the smallest field size, moving the Nyquist limit out to 1.5 cycles/µm. For Window #1 located at 0.66° of eccentricity, the dominant cone spacing was about 3.3µm (0.3 cycle/µm), while for Window #2 near the foveal center (0.22° of eccentricity), the power spectrum had a wide power peak located at 0.35~0.4 cycle/µm, which corresponded to cone spacing of 2.9µm~2.5µm. This peak extended out to the Raleigh diffraction limit at 0.44 cycle/µm (or 2.27µm cone spacing). For the peak of the power spectral plot at 0.39cycle/µm, the cone spacing was 2.56 µm.
5.2. Estimating system PSF from small size of features
Another measure of image quality is to estimate the system PSF. Because the retinal image represents the convolution of the imaging system PSF with the object, if we choose very small objects (ideally smaller than the diffraction limit), then the measured size would be the PSF of the system. Foveal cones make a reasonable target for such an analysis since there are occasionally very bright cones giving high contrasts, and in some subjects they are at or near the resolution limit for near infrared imaging. To test if the system could deliver on the expected confocal resolution advantage by using a small pinhole, we changed the detection pinhole to be approximately ½ the diameter of the Airy disc. For the sampled image at 0.33 µm/pixel scan scale, we then selected 15 bright cones in each of the three windows shown in Fig. 14(a) , and the average radial intensity profiles for these three windows are shown in Fig. 14(b). The half width at half height was estimated as approximately 1.4 µm at 0.5 degrees, and asymptoted to a value of approximately 1 µm at the foveal center. The estimated radii of the average cone profiles were 3.3 µm, 2.3 µm and 2 µm, respectively. Although these estimates were influenced more than the half-width estimates by brightness of nearby cones (represented by the flanking curves in the cross-sections), the data support the conservative conclusion that under these conditions we were reaching a resolution of 0.5 cycles/µm.
Fig. 14.
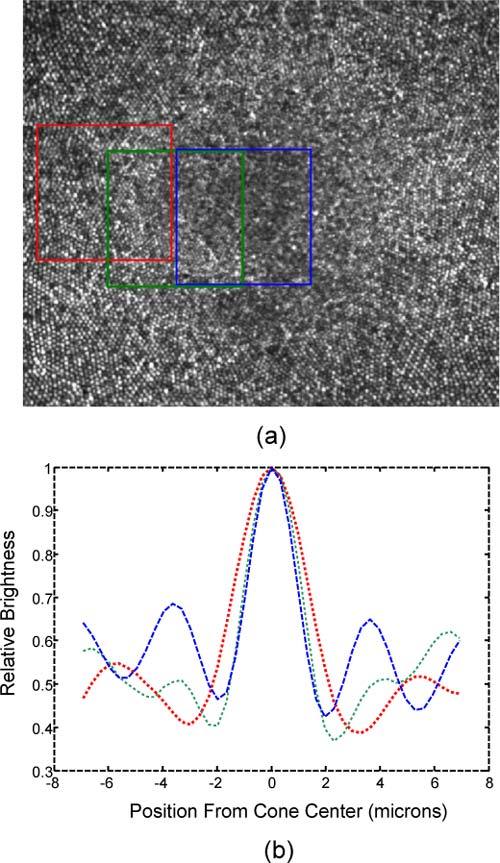
(a) Cone photoreceptor images of Subject S2 with Φ25 µm confocal pinhole and (b) their averaged intensity profiles. These are the image brightness cross-section profiles of cones at three distances from the fovea, which are the estimated PSFs for a Φ7.56 mm pupil as the sample window is moved from about 120 µm eccentricity (red box and curve) to the foveal center (blue box and curve).
6. Discussion and conclusion
Previous studies found that the successive dual DM AO was better than a single DM AO [18–21]. In the present paper we have shown that a simultaneous implementation of a W-T AO system can outperform either single DM alone, or either type of successively optimized W-T AO. Besides its high wavefront control accuracy the LM-based DLS controller has a number of additional advantages that are less readily quantified. Because it can efficiently partition the errors to the two DMs we were able to use a relatively low-stroke MEMS DM together with the higher stroke lower actuator-count electromagnetic DM to image almost any subject we tested. In other work we have tested individuals ranging in refractive error from −8.5 diopter myopes to 2.5 diopter hyperopes with no additional trial lenses. We typically do pre-distort the Mirao DM to match the expected wavefront, and this simply ensures that the SH sensor is within its working range at the start of a session. The robustness of performance greatly speeds up imaging sessions.
There are two central problems for analyzing the performance of a new imaging algorithm designed for use with in vivo retinal imaging. The first is simply choosing a metric for evaluating performance, and the second is its overall utility. It is clear that in recent years almost all AOSLO imaging systems are achieving very good imaging, including the central foveal cones [11]. However, to measure the improvements is therefore getting harder. In a conventional wide-field microscope with incoherent light, the image resolution of a perfect optical system is governed by the system MTF, and typically an estimate of resolution has been the Rayleigh criterion although the exact criteria used is somewhat arbitrary [11]. In a system with a high Strehl ratio and low noise it is reasonable to expect it to be able to perform better than the Rayleigh criterion. In confocal microscopy while the practical resolution will still depend on the signal to noise level [45], the confocal resolution can be as high as rconfocal = 0.88λf/D [46], although this requires very small confocal pinholes and a matched single mode laser. Table 1 shows the comparison of resolutions of the subjects imaged in the current study. Except for the final experiment all the confocal pinhole size we used was 100 µm, which was about twice the size of the Airy disc of our system with a pupil of Φ 6.5mm, our AOSLO imaging therefore did not take full advantage of the superior lateral resolution capabilities of the confocal configuration [47]. Nevertheless, in at least three of the subjects we were able to do better than the Rayleigh criterion, but we did not achieve the full confocal diffraction limited resolution, and thus the AO correction accuracy still needs to be improved for the diffraction-limited retinal imaging defined by Strehl ratio of 0.92 (λ/21) [48]. The second issue is related to stability and robustness of the system. Here it is difficult to quantify the performance. However experiments with model eyes showed that the system was able to produce near diffraction-limited performance for more than an hour. In human subjects we are able to quickly re-establish high quality images following blinks or eye movements, and the system has produced the results reported in subjects even requiring −6.5 diopters of correction.
Table 1. Comparison between Rayleigh diffraction limit, confocal limit and the resolution achieved with human eyesa.
| Subjects |
|||||
|---|---|---|---|---|---|
| Unit | S2 | S4 | S1 | S3/S5 | |
| Pupil size (D) | mm | 7.56 | 7.22 | 6.84 | 6.48 |
| Rayleigh resolution rRayleigh = 1.22λf/D | µm | 2.26 | 2.38 | 2.5 | 2.63 |
| cycle/ µm | 0.44 | 0.42 | 0.4 | 0.38 | |
| Confocal resolution rconfocal = 0.88λf/D | µm | 1.63 | 1.71 | 1.80 | 1.90 |
| cycle/µm | 0.61 | 0.59 | 0.55 | 0.53 | |
| Estimation of resolution achieved with human eye | µm | 2 | <2.5 | <2.5 | <2.5 |
| cycle/µm | >0.5 | >0.42 | >0.4 | >0.4 | |
aThe resolution we achieved with human eye is about at the Rayleigh diffraction limit, but it is still lower than the confocal diffraction limit. In these imaging, λ = 0.84µm, f = 16.684mm and the confocal pinhole size is Φ100 µm.
Acknowledgments
This work was supported by NIH grants R01 EY07624, EY014375, NEI- P30EY019008. We thank Gang Huang, Zhangyi Zhong, and Hongxin Song for their aid in the imaging experiments.
References and links
- 1.Liang J., Williams D. R., Miller D. T., “Supernormal vision and high-resolution retinal imaging through adaptive optics,” J. Opt. Soc. Am. A 14(11), 2884–2892 (1997). 10.1364/JOSAA.14.002884 [DOI] [PubMed] [Google Scholar]
- 2.Roorda A., Romero-Borja F., Donnelly III W., Queener H., Hebert T., Campbell M., “Adaptive optics scanning laser ophthalmoscopy,” Opt. Express 10(9), 405–412 (2002). [DOI] [PubMed] [Google Scholar]
- 3.Hermann B., Fernández E. J., Unterhuber A., Sattmann H., Fercher A. F., Drexler W., Prieto P. M., Artal P., “Adaptive-optics ultrahigh-resolution optical coherence tomography,” Opt. Lett. 29(18), 2142–2144 (2004). 10.1364/OL.29.002142 [DOI] [PubMed] [Google Scholar]
- 4.Zhang Y., Rha J., Jonnal R., Miller D., “Adaptive optics parallel spectral domain optical coherence tomography for imaging the living retina,” Opt. Express 13(12), 4792–4811 (2005). 10.1364/OPEX.13.004792 [DOI] [PubMed] [Google Scholar]
- 5.Hammer D. X., Ferguson R. D., Bigelow C. E., Iftimia N. V., Ustun T. E., Burns S. A., “Adaptive optics scanning laser ophthalmoscope for stabilized retinal imaging,” Opt. Express 14(8), 3354–3367 (2006). 10.1364/OE.14.003354 [DOI] [PMC free article] [PubMed] [Google Scholar]
- 6.Gray D. C., Merigan W., Wolfing J. I., Gee B. P., Porter J., Dubra A., Twietmeyer T. H., Ahamd K., Tumbar R., Reinholz F., Williams D. R., “In vivo fluorescence imaging of primate retinal ganglion cells and retinal pigment epithelial cells,” Opt. Express 14(16), 7144–7158 (2006). 10.1364/OE.14.007144 [DOI] [PubMed] [Google Scholar]
- 7.Merino D., Dainty C., Bradu A., Podoleanu A. G., “Adaptive optics enhanced simultaneous en-face optical coherence tomography and scanning laser ophthalmoscopy,” Opt. Express 14(8), 3345–3353 (2006). 10.1364/OE.14.003345 [DOI] [PubMed] [Google Scholar]
- 8.Zhang Y., Poonja S., Roorda A., “MEMS-based adaptive optics scanning laser ophthalmoscopy,” Opt. Lett. 31(9), 1268–1270 (2006). 10.1364/OL.31.001268 [DOI] [PubMed] [Google Scholar]
- 9.Burns S. A., Tumbar R., Elsner A. E., Ferguson D., Hammer D. X., “Large-field-of-view, modular, stabilized, adaptive-optics-based scanning laser ophthalmoscope,” J. Opt. Soc. Am. A 24(5), 1313–1326 (2007). 10.1364/JOSAA.24.001313 [DOI] [PMC free article] [PubMed] [Google Scholar]
- 10.M. Born and E. Wolf, Principles of Optics, 7th ed. (Cambridge University Press, 2001), p528 [Google Scholar]
- 11.Li K. Y., Tiruveedhula P., Roorda A., “Intersubject variability of foveal cone photoreceptor density in relation to eye length,” Invest. Ophthalmol. Vis. Sci. 51(12), 6858–6867 (2010). 10.1167/iovs.10-5499 [DOI] [PMC free article] [PubMed] [Google Scholar]
- 12.Roddier F., “Curvature sensing and compensation: a new concept in adaptive optics,” Appl. Opt. 27(7), 1223–1225 (1988). 10.1364/AO.27.001223 [DOI] [PubMed] [Google Scholar]
- 13.Ferguson R. D., Zhong Z., Hammer D. X., Mujat M., Patel A. H., Deng C., Zou W., Burns S. A., “Adaptive optics scanning laser ophthalmoscope with integrated wide-field retinal imaging and tracking,” J. Opt. Soc. Am. A 27(11), A265–A277 (2010). 10.1364/JOSAA.27.00A265 [DOI] [PMC free article] [PubMed] [Google Scholar]
- 14.Atchison D. A., Pritchard N., Schmid K. L., “Peripheral refraction along the horizontal and vertical visual fields in myopia,” Vision Res. 46(8-9), 1450–1458 (2006). 10.1016/j.visres.2005.10.023 [DOI] [PubMed] [Google Scholar]
- 15.Mathur A., Atchison D. A., Scott D. H., “Ocular aberrations in the peripheral visual field,” Opt. Lett. 33(8), 863–865 (2008). 10.1364/OL.33.000863 [DOI] [PubMed] [Google Scholar]
- 16.Wei X., Thibos L., “Modeling the eye’s optical system by ocular wavefront tomography,” Opt. Express 16(25), 20490–20502 (2008). 10.1364/OE.16.020490 [DOI] [PubMed] [Google Scholar]
- 17.Lundström L., Mira-Agudelo A., Artal P., “Peripheral optical errors and their change with accommodation differ between emmetropic and myopic eyes,” J. Vis. 9(6), 17 (2009). 10.1167/9.6.17 [DOI] [PubMed] [Google Scholar]
- 18.Zawadzki R. J., Jones S. M., Olivier S. S., Zhao M., Bower B. A., Izatt J. A., Choi S., Laut S., Werner J. S., “Adaptive-optics optical coherence tomography for high-resolution and high-speed 3D retinal in vivo imaging,” Opt. Express 13(21), 8532–8546 (2005). 10.1364/OPEX.13.008532 [DOI] [PMC free article] [PubMed] [Google Scholar]
- 19.Zawadzki R. J., Choi S. S., Jones S. M., Oliver S. S., Werner J. S., “Adaptive optics-optical coherence tomography: optimizing visualization of microscopic retinal structures in three dimensions,” J. Opt. Soc. Am. A 24(5), 1373–1383 (2007). 10.1364/JOSAA.24.001373 [DOI] [PMC free article] [PubMed] [Google Scholar]
- 20.Chen D. C., Jones S. M., Silva D. A., Olivier S. S., “High-resolution adaptive optics scanning laser ophthalmoscope with dual deformable mirrors,” J. Opt. Soc. Am. A 24(5), 1305–1312 (2007). 10.1364/JOSAA.24.001305 [DOI] [PubMed] [Google Scholar]
- 21.Cense B., Koperda E., Brown J. M., Kocaoglu O. P., Gao W., Jonnal R. S., Miller D. T., “Volumetric retinal imaging with ultrahigh-resolution spectral-domain optical coherence tomography and adaptive optics using two broadband light sources,” Opt. Express 17(5), 4095–4111 (2009). 10.1364/OE.17.004095 [DOI] [PMC free article] [PubMed] [Google Scholar]
- 22.Zou W., Burns S. A., “High-accuracy wavefront control for retinal imaging with Adaptive-Influence-Matrix Adaptive Optics,” Opt. Express 17(22), 20167–20177 (2009). 10.1364/OE.17.020167 [DOI] [PMC free article] [PubMed] [Google Scholar]
- 23.Li C., Sredar N., Ivers K. M., Queener H., Porter J., “A correction algorithm to simultaneously control dual deformable mirrors in a woofer-tweeter adaptive optics system,” Opt. Express 18(16), 16671–16684 (2010). 10.1364/OE.18.016671 [DOI] [PMC free article] [PubMed] [Google Scholar]
- 24.Hu S., Xu B., Zhang X., Hou J., Wu J., Jiang W., “Double-deformable-mirror adaptive optics system for phase compensation,” Appl. Opt. 45(12), 2638–2642 (2006). 10.1364/AO.45.002638 [DOI] [PubMed] [Google Scholar]
- 25.Brennan T. J., Rhoadarmer T. A., “Performance of a woofer-tweeter deformable mirror control architecture for high-bandwidth, high-spatial resolution adaptive optics,” Proc. SPIE 6306, 63060B–, 63060B-12. (2006). 10.1117/12.682482 [DOI] [Google Scholar]
- 26.O. Keskin, P. Hampton, R. Conan, C. Bradley, A. Hilton, and C. Blain, “Woofer-tweeter adaptive optics test bench,” in First NASA/ESA Conference on Adaptive Hardware and Systems (2006), pp.74–80, [Google Scholar]
- 27.Conan R., Bradley C., Hampton P., Keskin O., Hilton A., Blain C., “Distributed modal command for a two-deformable-mirror adaptive optics system,” Appl. Opt. 46(20), 4329–4340 (2007). 10.1364/AO.46.004329 [DOI] [PubMed] [Google Scholar]
- 28.Conan R., “Mean-square residual error of a wavefront after propagation through atmospheric turbulence and after correction with Zernike polynomials,” J. Opt. Soc. Am. A 25(2), 526–536 (2008). 10.1364/JOSAA.25.000526 [DOI] [PubMed] [Google Scholar]
- 29.Morzinski K., Macintosh B., Gavel D., Dillon D., “Stroke saturation on a MEMS deformable mirror for woofer-tweeter adaptive optics,” Opt. Express 17(7), 5829–5844 (2009). 10.1364/OE.17.005829 [DOI] [PubMed] [Google Scholar]
- 30.Lavigne J.-F., Véran J.-P., “Woofer-tweeter control in an adaptive optics system using a Fourier reconstructor,” J. Opt. Soc. Am. A 25(9), 2271–2279 (2008). 10.1364/JOSAA.25.002271 [DOI] [PubMed] [Google Scholar]
- 31.Zou W., Qi X., Burns S. A., “Wavefront-aberration sorting and correction for a dual-deformable-mirror adaptive-optics system,” Opt. Lett. 33(22), 2602–2604 (2008). 10.1364/OL.33.002602 [DOI] [PMC free article] [PubMed] [Google Scholar]
- 32.Model No. Mirao 52-e, Imagine Eyes, Orsay,France, http://www.imagine-eyes.com
- 33.Model No. µDM140–450-E-AgMgF, Boston MicroMachines Corp., MA, USA, http://www.bostonmicromachines.com
- 34.N. O. Product 0300–7.6-S: Adaptive Optics Associates, Inc., MA, USA, http://www.as.northropgrumman.com/businessventures/aoa/index.html
- 35.N. O. Product UP-1830CL-12B, Uniq Vision, Inc., CA, USA. http://www.uniqvision.com
- 36.Levenberg K., “A method for the solution of certain non-linear problems in least squares,” Q. Appl. Math. 2, 164–168 (1944). [Google Scholar]
- 37.Meiron J., “Damped least-squares method for automatic lens design,” J. Opt. Soc. Am. 55(9), 1105–1107 (1965). 10.1364/JOSA.55.001105 [DOI] [Google Scholar]
- 38.Su D. Q., Wang Y. N., “Automatic correction of aberration in astro-optical system,” Acta Astron. Sin. 15(1), 51–60 (1974). [Google Scholar]
- 39.Curcio C. A., Sloan K. R., Kalina R. E., Hendrickson A. E., “Human photoreceptor topography,” J. Comp. Neurol. 292(4), 497–523 (1990). 10.1002/cne.902920402 [DOI] [PubMed] [Google Scholar]
- 40.Yellott J. I., Jr, “Spectral analysis of spatial sampling by photoreceptors: topological disorder prevents aliasing,” Vision Res. 22(9), 1205–1210 (1982). 10.1016/0042-6989(82)90086-4 [DOI] [PubMed] [Google Scholar]
- 41.Török P., Higdon P. D., Wilson T., “Theory for confocal and conventional microscopes imaging small dielectric scatterers,” J. Mod. Opt. 45(8), 1681–1698 (1998). 10.1080/09500349808230662 [DOI] [Google Scholar]
- 42.Wilson T., Carlini A. R., “Size of the detector in confocal imaging systems,” Opt. Lett. 12(4), 227–229 (1987). 10.1364/OL.12.000227 [DOI] [PubMed] [Google Scholar]
- 43.A. H. Tunnacliffe, Introduction to Visual Optics (Association of British Dispensing Opticians, 1989). [Google Scholar]
- 44.G. Boreman, Modulation Transfer Function in Optical and Electro-Optical Systems (SPIE Press, 2001)., Eq. (1.28). [Google Scholar]
- 45.J. B. Pawley, “Fundamental limits in confocal microscopy,” in Handbook of Biological Confocal Microscopy, 3rd ed. (Springer, 2006). [Google Scholar]
- 46.Webb R. H., “Confocal optical microscopy,” Rep. Prog. Phys. 59(3), 427–471 (1996). 10.1088/0034-4885/59/3/003 [DOI] [Google Scholar]
- 47.Zhang Y., Roorda A., “Evaluating the lateral resolution of the adaptive optics scanning laser ophthalmoscope,” J. Biomed. Opt. 11(1), 014002 (2006). 10.1117/1.2166434 [DOI] [PubMed] [Google Scholar]
- 48.Mahajan V. N., “Strehl ratio for primary aberrations in terms of their aberration variance,” J. Opt. Soc. Am. 73(6), 860–861 (1983). 10.1364/JOSA.73.000860 [DOI] [Google Scholar]


