Abstract
Motile cilia are cellular organelles that generate directional fluid flow across various epithelial surfaces including the embryonic node and respiratory mucosa. The proper functioning of cilia is necessary for normal embryo development and, for the respiratory system, the clearance of mucus and potentially harmful particulate matter. Here we show that optical coherence tomography (OCT) is well-suited for quantitatively characterizing the microfluidic-scale flow generated by motile cilia. Our imaging focuses on the ciliated epithelium of Xenopus tropicalis embryos, a genetically manipulable and experimentally tractable animal model of human disease. We show qualitative flow profile characterization using OCT-based particle pathline imaging. We show quantitative, two-dimensional, two-component flow velocity field characterization using OCT-based particle tracking velocimetry. Quantitative imaging and phenotyping of cilia-driven fluid flow using OCT will enable more detailed research in ciliary biology and in respiratory medicine.
OCIS codes: (110.4500) Optical coherence tomography, (110.4153) Motion estimation and optical flow, (170.3880) Medical and biological imaging, (280.2490) Flow diagnostics
1. Background
Motile cilia are organelles that protrude from cells and generate directional, low Reynolds number fluid flow [1] at speeds of ~1-1000 μm/s [2–5]. During embryo development, cilia-driven fluid flow is essential to normal left-right axis development [2]. In addition, there is evidence that cilia-driven fluid flow is important for the development of the inner ear [6] and central nervous system [7]. Several different epithelial cell types have motile cilia, including respiratory, ependymal, and fallopian tube (oviduct) epithelium [8]. Respiratory cilia drive the directional flow of mucus, and defects in these cilia can lead to recurrent sinopulmonary infections [8]. Ependymal cilia drive cerebrospinal fluid flow, a flow that carries new neurons in the adult brain [9]. Fallopian tube cilia that line the luminal epithelium are important in tubal transport of ova [10]. Therefore, understanding ciliary physiology and cilia-driven fluid flow has broad relevance in medicine.
Like electro-osmotic driven flow in microfabricated microfluidic systems [11,12], cilia-driven fluid flow is a surface-driven flow generated by the application of a body force at a distance above a surface [13]. Cilia-driven flow physiology has been investigated using a variety of imaging techniques. However, the quantitative nature of cilia-driven flow is incompletely characterized. One of the main challenges in imaging cilia-driven fluid flow is that the ciliated surface that drives the flow is often orthogonal to the optical axis (Fig. 1 ). As a consequence, depth-resolved imaging is required to characterize two- and three-dimensional features of the flow field. Current methods, including dye imaging [9,14], light microscopy-based particle pathline imaging and particle tracking imaging [2,3,15,16], and real-time digitally subtracted radiography [9], are not depth-resolved. Scanning a high numerical aperture (NA>1) focus through the nodal pit was used to observe recirculating nodal flow [2]. However, this method has poor depth sectioning compared to confocal microscopy [17] and optical coherence tomography/microscopy [18].
Fig. 1.
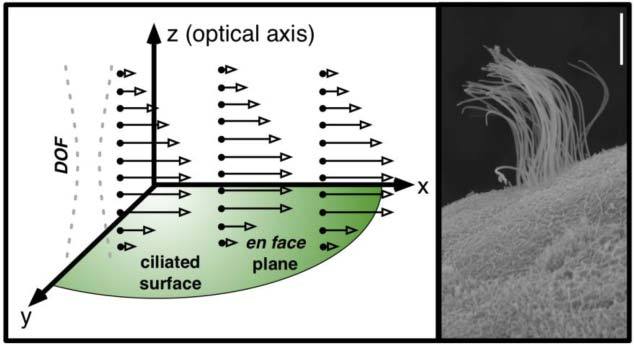
Left: Idealized cilia-driven flow seeded with tracer particles (black dots). Velocity vectors v(x,y,z) are open-tipped arrows. The ability of OCT to perform depth-resolved imaging along its depth of focus (DOF) enables visualization of flow generated by a ciliated surface that is largely orthogonal to the optical axis. Right: Scanning electron micrograph of a ciliated Xenopus tropicalis epithelial cell. Each multicilated cell is surrounded by several non-ciliated cells. The scale bar is 5 μm.
Optical coherence tomography (OCT) is an attractive imaging modality for the in vivo quantitative vectorial imaging of cilia-driven flow. OCT is a non-destructive imaging modality that is capable of cross-sectional imaging at micron-scale resolutions [19,20]. OCT has demonstrated utility in the in vivo imaging of microscale motions and flow [21–23]. In addition, OCT has been used to characterize flow in microfabricated microfluidic systems [24,25], including flow driven by biomimetic artificial cilia [26]. Although Doppler OCT has, in principle, the phase sensitivity to detect flows in the 1-1000 μm/s range [21], Doppler OCT requires multi-angle illumination optics to extract two-component (i.e. v = vxi + vzk) and three-component (i.e. v = vxi + vyj + vzk) velocity vector information [27,28]. An alternate approach employed in cardiovascular imaging is to estimate the Doppler angle through structural OCT imaging the vessel lumen [29–32]. While this approach is well-suited to parabolic microvascular and embryonic blood flow since the flow is confined to well-defined geometries, the approach is not well-suited to cilia-driven flow, which occurs in open geometries with less well-characterized flow profiles. An alternate approach to Doppler flow imaging is to track individual seed particles over time (i.e. particle tracking velocimetry (PTV) [33–35]). PTV is particularly useful when the flow can be sparsely seeded with tracer microparticles. PTV also is useful when simplifying geometric assumptions regarding flow patterns may not be appropriate. OCT is well-suited to PTV in that a B-scan is geometrically similar to sheet illumination typically employed by light microscopy-based PTV setups. In traditional PTV, sheet illumination ensures that seed particles from a specific plane are imaged [36]. In OCT, linear scanning the low numerical aperture sample beam also ensures that seed particles from a specific plane are imaged.
Here, we demonstrate that OCT is well-suited for the qualitative and quantitative characterization of cilia-driven fluid flow. Using micron-scale polystyrene microspheres as flow tracers, we obtain two-dimensional, two-component (i.e. v = vxi + vzk) flow velocity fields of fluid flow driven by the ciliated epidermis of Xenopus tropicalis embryos. The Xenopus genus (e.g. X. laevis, X. tropicalis) is an important animal model in in vivo ciliary biology. Xenopus embryos have a ciliated epidermis that generates directional fluid flow [3,14,37]. Several studies using Xenopus embryos have investigated the relationship among cilia-driven fluid forces, epidermal planar cell polarity, and cilia development [3,14]. We demonstrate OCT particle streak imaging as a method for visualizing complex flow patterns. Lastly, we show that recirculation/vortical flow patterns arise as a function of boundary conditions (i.e. location of water surface with respect to ciliated surface). Overall, OCT imaging and related qualitative and quantitative image processing techniques will propel new areas of research in ciliary biology, ranging from the microfluidics of cilia-driven fluid flow to the biomechanical phenotyping of mutant cilia.
2. Methods
2.1. Xenopus tropicalis culture and preparation
X. tropicalis embryos were generated according to established protocols [38]. All animal work was done in accordance with Yale IACUC approval.
2.2. OCT imaging, OCT pathline imaging, and color-encoding of time image processing
OCT imaging was performed using a commercially available OCT system (Thorlabs, Inc., Newton, NJ, USA) with an A-scan rate of 16 kHz and a center wavelength of 1325 nm, a transverse resolution of 25 μm, and an axial resolution of 9 μm in water. For OCT imaging, the embryos were placed in a custom-made well of a rubber O-ring glued to a frosted cover glass (Fig. 2 ). Cilia-driven fluid flow was seeded with 5 μm diameter polystyrene microspheres (Bangs Laboratories, Fishers, IN, USA). For a discretely indexed image stack Iij(mΔt), two-dimensional particle pathlines can be estimated by taking the maximum projection image across time. For log-transformed images, the minimum projection image across time provides an estimate of the stationary background image Bij. Background-free pathline images were generated by taking the maximum projection across time of Iij(mΔt)-Bij.
Fig. 2.
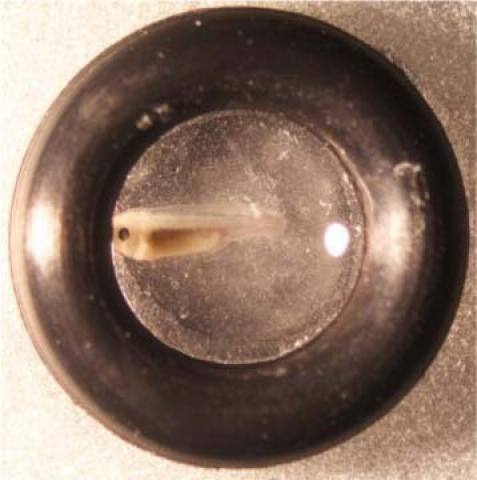
Photomicrograph of stage 36 X. tropicalis embryo in a well for OCT imaging.
Pathline imaging can be enhanced to color-encode time [4,6]. Time is encoded by assigning each image a color according to its timestamp and projecting all images over time. Adding time to the visualization reveals information about the direction of flow. Further, changes in colors also give a qualitative sense of flow rates. Our color-encoding algorithm used six colors: red, green, blue, yellow, cyan, and magenta. For M images (M mod 6 = 0), the MATLAB pseudocode that generates the red, green, and blue color channels (Ir, Ig, Ib) of the color-encoded pathline image is the following:
| Ir = zeros(); Ig = zeros(); Ib = zeros(); | ||||
| %initialize three empty channels | ||||
| for k = 1 to M/6, | %walk through all images | |||
| Ir = Ir | %accumulate red intensities | |||
| + I(0M/6 + k) | %add red for red/first time stamp | |||
| + I(3M/6 + k) | %add red for yellow/fourth time stamp | |||
| + I(5M/6 + k); | %add red for magenta/sixth time stamp | |||
| Ig = Ig | %accumulate green intensities | |||
| + I(1M/6 + k) | %add green for green/second time stamp | |||
| + I(3M/6 + k) | %add green for yellow/fourth time stamp | |||
| + I(4M/6 + k); | %add green for cyan/fifth time stamp | |||
| Ib = Ib | %accumulate blue intensities | |||
| + I(2M/6 + k) | %add blue for blue/third time stamp | |||
| + I(4M/6 + k) | %add blue for cyan/fifth time stamp | |||
| + I(5M/6 + k); | %add blue for magenta/sixth time stamp | |||
| end | ||||
| Ir = Ir./Imean; Ig = Ig./Imean; Ib = Ib./Imean; | ||||
| %scale channels with mean intensity | ||||
Particle tracking velocimetry analysis was performed using custom Python code. Our process for OCT-based particle tracking velocimetry is outlined in Fig. 3 . The four major steps are image segmentation, particle identification, particle localization, and particle pairing. The first three steps are performed on individual images, while the last step (particle pairing) is performed on each pair of consecutive images. The goal of image segmentation is to distinguish flow tracer particles from the rest of the image. We employed an intensity-based threshold algorithm that uses a threshold intensity Pt to classify a pixel as particle or non-particle. Thus, for a discretely indexed image Iij, a binary segmentation mask Pij is defined as Pij = 1 if Iij>Pt and Pij = 0 otherwise (see, for example, Ref. [39].). The binary segmentation mask Pij can exclude stationary object by applying the threshold criteria to a background-free image (Iij-Bij) where Bij = min(Iij,T). Here, min() returns the minimum value of each pixel in Iij over a given time interval T.
Fig. 3.
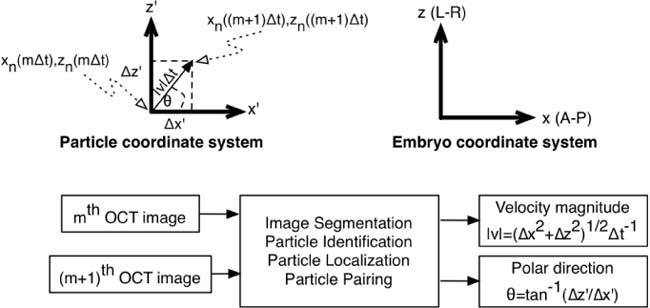
Top: Particle and embryo coordinate system. Bottom: Overview of image processing for OCT-based particle tracking velocimetry. tan−1 is the four-quadrant arctangent function.
After image segmentation, the next processing step is particle identification. Identification of individual particles is facilitated by the low particle density demanded by particle tracking velocimetry [33–35]. Particle identification was accomplished by traversing Pij pixel-by-pixel and labeling each cluster of “connected” pixels as a particle. A pixel in Pij is connected to another pixel in Pij if it (a) has a value of 1 and (b) if it has at least one neighbor with a value of 1 [40]. The last step in particle identification is to apply size-based inclusion criteria to each particle (i.e. each collection of connected pixels).
After image segmentation and particle identification, the next step is particle localization, that is, calculating the coordinate location of the nth particle (n∈[1..N]) at time mΔt (m∈[0..(M-1)], M is the number of image acquisitions in a particular sub-volume, Δt is the time to acquire a single sub-volume). We assume a linear model of image formation:
| (1) |
Here, I(x,z,mΔt) is the image volume formed by n particles located at (xn(mΔt), zn(mΔt)), PSF(x,z) is the two-dimensional OCT point spread function, δ(x,z) is Dirac’s delta function, and ⊗ is the convolution operator. In mathematical terms, the goal of localization is to estimate (xn(mΔt), zn(mΔt)). We will use the center-of-mass location of the particle (xc,n(mΔt), zc,n(mΔt)) as an estimate of the particle location. The center-of-mass coordinates of the nth particle can be calculated using [39]
| (2) |
Here, ROIn is a volumetric region of interest defined by the boundaries of the nth particle.
The final processing step is particle pairing. That is, each particle in the mth frame needs to be paired with a particle in the (m + 1)th frame. A particle in the mth frame that is not present in the next frame has left the field of view, while a particle in the (m + 1)th frame that is not in the prior frame has entered the field of view. We employed bipartite maximum matching [41] to pair particles in the mth frame with those in the (m + 1)th frame. For maximum matching analysis, we used code libraries from the NetworkX project (Los Alamos National Laboratory [42], ) Consider each particle as a vertex in a graph consisting of edges that originate in the mth frame and end in the (m + 1)th frame. Such a graph is bipartite in that edges exist between the two frames but not within each frame. To consider optimal pairing, an edge is drawn from each vertex in the mth frame to every vertex in the (m + 1)th frame. Each edge is given a weight equal to the inverse of the Euclidian distance between the edge's vertices. Weights below a threshold value (i.e. above a threshold Euclidian distance) are excluded as being improbably fast. Using this bipartite graph and associated weights, particle pairings are established by maximizing the sum of edge weights in 1:1 particle pairings.
Image segmentation, particle identification, particle localization, and particle pairing provides the information needed for OCT-based particle tracking velocimetry. OCT-based particle tracking velocimetry calculates the displacement of the nth particle along each Cartesian axis from time mΔt to time (m + 1)Δt. Thus, the velocity vx,n along the x-axis is given by [33–35]:
| (3) |
Each velocity measurement is located at the calculated center-of-mass of the nth particle during the mth volume acquisition. Δzn and vz,n are defined in a likewise manner. The velocity of the nth particle also can be expressed in polar coordinates (|vn(mΔt)|,θn(mΔt)) (Fig. 3):
| (4) |
Here, tan−1() is the four-quadrant artangent function.
2.3. Suitability of tracer particle for flow estimation
The 5 μm diameter polystyrene microspheres are expected to be good flow tracers because they have small expected values for slip velocity and for Brownian motion between consecutive images. Slip velocity (vslip) is the difference between particle velocity and the surrounding fluid flow velocity. A small slip velocity is therefore desirable. vslip is given by [43]:
| (5) |
where r is the particle radius, ρp is particle mass density (1.06 g/cm3), ρw is water mass density (1 g/cm3), η is the dynamic viscosity of water (10−3 kg/(m s), and ap is the particle acceleration. Acceleration secondary to gravity generates a very small slip velocity (~0.8 μm/s). Acceleration secondary to time-variation in fluid flow is expected to be even yet smaller. A flow acceleration of ~10 m/s2, the equivalent of accelerating fluid from 0 to 10 mm/s in 1 ms, would be required to generate slip of ~1 μm/s. Cilia-driven fluid flow varies much more slowly than this. In terms of Brownian motion between images, root mean square displacement srms in two dimensions is given by [1]:
| (6) |
where D is the particle diffusivity (D~r−1) and Δt is the time interval of interest. Using diffusivity as defined in [44] and using Δt = 24 ms (the inter-frame interval for the particle tracking experiments), srms~0.1 μm.
3. Results and discussion
Figure 4 and Media 1 (9.3MB, MOV) show cross-sectional OCT imaging of cilia-driven fluid flow. As shown in Fig. 1, the imaging plane is roughly orthogonal to the ciliated epithelial surface. Polystyrene microspheres that sparsely seed the flow are readily visualized (Fig. 4b). The stationary background is effectively subtracted away using a minimum projection image taken over the entire image stack (Fig. 4b-d). Particle pathline images are generate by calculation of maximum projection images (Fig. 4c). Particle pathline images give a qualitative picture of the cross-sectional flow patterns. Color-encoding of time pathline images (Fig. 4d) adds a semi-quantitative aspect to pathline imaging. While color-encoding does not directly give quantitative vector magnitude and directions, it allows for a qualitative sense of flow directionality and speed. As with electro-osmotic [12], cilia-driven fluid flow can generate complex flow patterns depending on variation of boundary conditions. Indeed, in addition to linear flow profiles seen in Figs. 4 and 7 (below), we observed recirculatory/vortical flow profiles (Fig. 5 /Media 2 (993.6KB, MOV) and Fig. 6 ). The recirculatory/vortical flow profiles are qualitatively similar to those generated by artificial cilia for microfabricated microfluidic mixers [26,45].
Fig. 4.
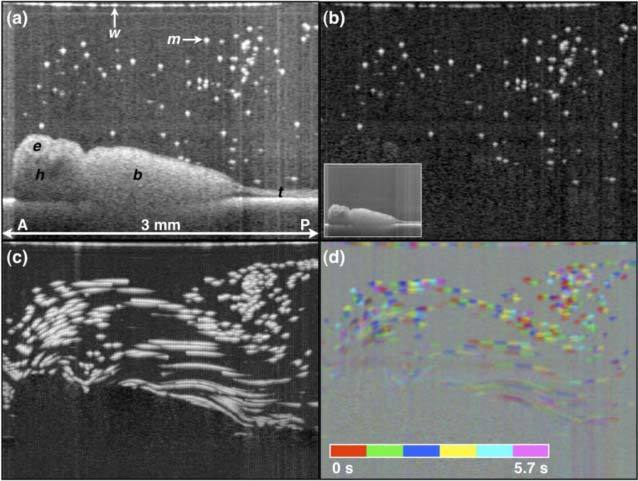
OCT imaging of X. tropicalis epithelial cilia-driven flow. (a) B-scan of embryo in microparticle-seeded physiologic solution. Original image stack filtered with a 2x2x2 (x,z,t) pixel filter. (b) Background-subtracted B-mode image. The inset in (b) is the minimum projection image across all B-scans over the 5.7 s acquisition. (c) OCT pathline imaging generated by taking the maximum projection over all background-subtracted images over the 5.7 s acquisition. (d) Color-encoding of time pathline imaging. b, body; e, eye; h, head; m, microsphere; t, tail; w, water-air interface. A, anterior; P, posterior. Scale image to have square pixels. Media 1 (9.3MB, MOV) shows the OCT movie, background-subtracted movie, and related cumulative maximum projection (i.e. cumulative particle pathline) movies.
Fig. 7.
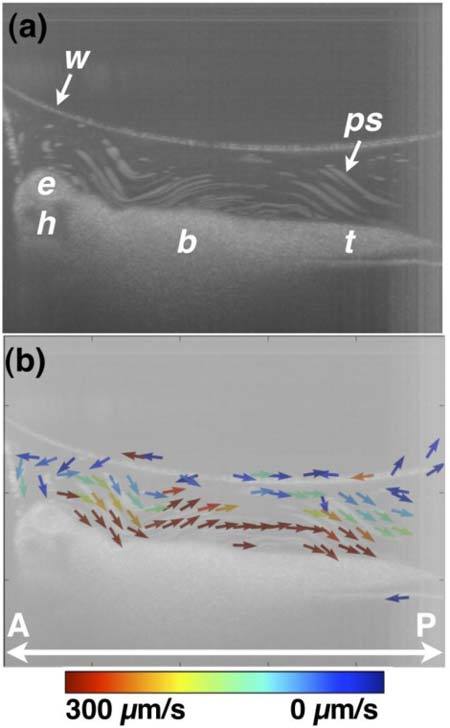
OCT-based particle tracking velocimetry of non-recirculatory cilia-driven fluid flow. Note that the same embryo was imaged in Figs. 6 and 7 and only the image well water volume differs between the two image acquisition sessions. (a) shows the particle pathline image and (b) shows the two-dimensional, two-component flow velocity field. The vector arrows at the air/water interface in (b) are artifactual b, body; e, eye; h, head; ps, polystyrene microsphere; t, tail; w, air/water interface. A, anterior; P, posterior.
Fig. 5.
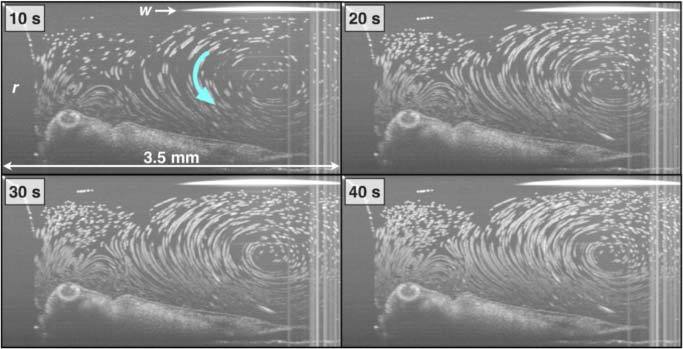
Recirculating flow patterns. Each panel is a cumulative maximum projection image (i.e. cumulative particle pathline) through the timestamp on each image. Media 2 (993.6KB, MOV) is the movie from which these still images were taken.
Fig. 6.
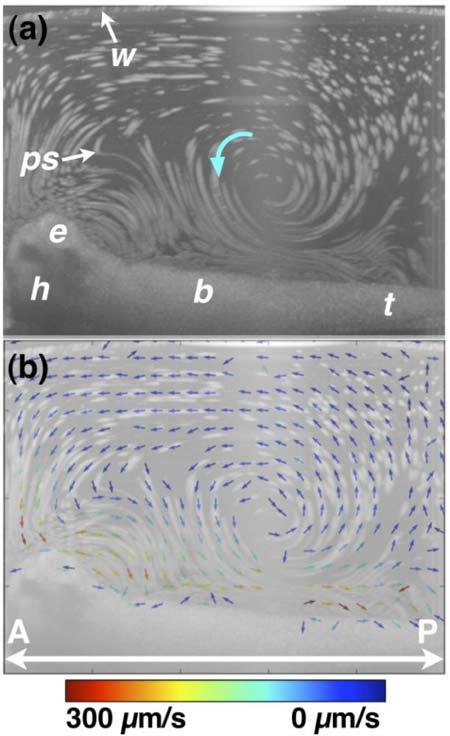
OCT-based particle tracking velocimetry of recirculatory/vortical cilia-driven fluid flow. Note that the same embryo was imaged in Figs. 6 and 7 and only the image well water volume differs between the two image acquisition sessions. (a) shows the particle pathline image. (b) shows the two-dimensional, two-component (i.e. v = vxi + vzk) flow velocity field superimposed on the particle pathline image. The arrow direction encodes vector direction, while the arrow color encodes vector magnitude. The recirculatory/vortical whorl noted with a blue arrow in (a) has a faster fluid flow closer to the body than further away. Near the surface of the embryo, the flow is largely anterior-to-posterior (i.e. head-to-tail), while “return” flow current is in a posterior-to-anterior direction. b, body; e, eye; h, head; ps, polystyrene microsphere; t, tail; w, air/water interface. A, anterior; P, posterior.
Figures 6 and 7 demonstrate two-dimensional, two-component flow velocimetry using OCT-based PTV. Figure 7 is the same embryo in Fig. 6 except it is sitting in a significantly smaller volume of physiologic solution. The orientation of the embryo is otherwise the same in the two figures. Consistency of orientation was ensured by performing imaging in a large volume (Fig. 6) and then removing fluid using a micropipette (Fig. 7). Figures 6a and 7a show particle pathline images, and Figs. 6b and 7b show the two-dimensional, two-component flow velocity fields. Flow velocities span about two orders of magnitude from ~1 to 100 μm/s. For comparison, retinal microvascular bloodflow has maximum velocities of tens of mm/s [29,32,46,47], and early embryonic blood flow has maximum velocities of ~1-10 mm/s [23,31,48–50]. Assuming a cilia length of 20 micrometers and a maximum flow velocity of 300 micrometers per second, the Reynolds number is ~2 × 10⁻³. Even if the embryo body length is used as characteristic size scale in calculating Reynolds number, Reynolds number is ~0.3, much less than 1. The low Reynolds number reinforces that the recirculatory/vortical cilia-driven fluid flow profiles are not turbulent but rather a manifestation of flow dominated by viscous forces in a complex three-dimensional geometry.
Our particle tracking data additionally allowed us to measure how long a particle resided within the B-scan field of view. The results shown in Fig. 8 show particle pathlines grayscale encoded with residence time in the field of view. While this map cannot give us quantitative measurement of the flow velocities along the y-axis, it can give us a qualitative sense of the three-dimensional flow patterns. For example, for vortical flow that is roughly parallel or antiparallel to the z-axis, there seems to be less vigorous out-of-plane motion since the residence time in the field of view seems to be longer. Further, for vortical flow parallel or antiparallel to the x-axis, out-of-plane flow seems to be more vigorous since the residence time for these particles is shorter.
Fig. 8.
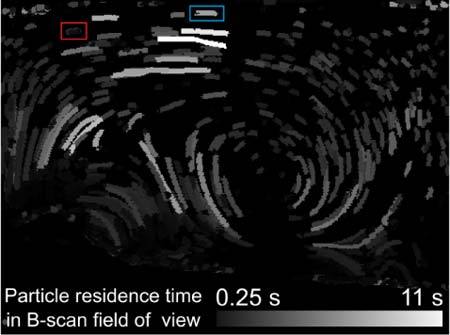
Particle residence time in B-scan field of view. The embryo has the same position and orientation as in Fig. 6. The grayscale intensity of the streaks encodes the duration in the field of view. The red rectangle marks the particle that was used for the upper plots in Fig. 9, blue marks the particle used for the lower plots in Fig. 9.
Since cilia-driven fluid flow is slow, the calculated frame-to-frame particle displacements were often less than one pixel. In order to minimize errors in velocity calculations, we employed averaging of repeated measurements. For example, in order to generate Fig. 6, a total of ~50,000 frame-to-frame particle displacement measurements were calculated. The ~400 velocity vectors were generated by spatially binning and averaging these individual calculations. Therefore, each velocity vector is the result of ~125 displacement measurements. To demonstrate that spatial averaging results in a value that converges to the expected mean displacement (and therefore expected mean velocity), Fig. 9 shows the average displacement values as a function of number of measurements for two particles traveling at a relatively steady velocity (see Fig. 8 for the pathlines corresponding to these particles). Both x and z displacements converge towards the mean velocity for that streak as more frames are considered. There is notable decrease in the variability in the average displacement once several tens of measurements are included in the calculation, thereby justifying our use of ~125 displacement measurements per velocity vector.
Fig. 9.
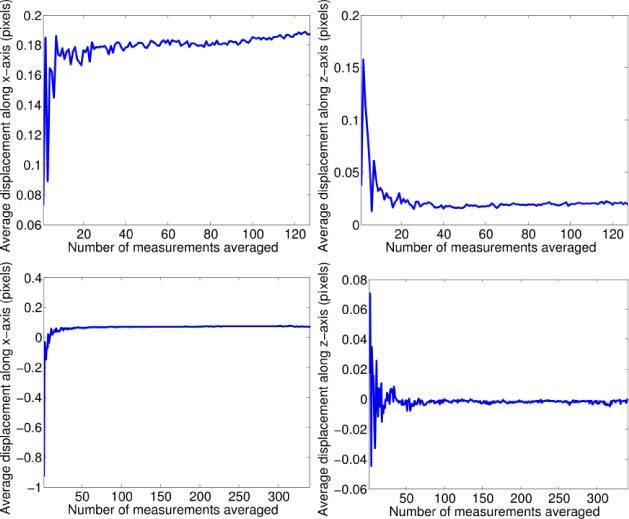
Plots demonstrating convergence of estimated particle displacement as a function of measurements used in the estimation. The plots on the left side display mean displacement along the x-axis, the right plots mean displacement along the z-axis. The upper two plots are extracted from the pathline in the red rectangle in Fig. 8, the lower two plots are extracted from the pathline in the blue rectangle.
4. Conclusion
The methods and results shown here demonstrate that OCT is uniquely well-suited for the quantitative in vivo imaging of cilia-driven fluid flow. In particular, OCT is able to visualize flow profiles in planes that are orthogonal to a ciliated epithelial surface, a notable shortcoming in previously used imaging approaches. The ability of OCT to perform cross-sectional imaging enables calculation of two-dimensional, two-component flow velocity maps using particle tracking velocimetry methods. OCT-based particle tracking velocimetry can be used to characterize or phenotype flow velocities and flow profiles (i.e. recirculatory/vortical flow versus directional flow). It is worth noting that, in contrast to particle tracking, single-beam Doppler OCT yields only one-component vector flow measurements, and that having two- or three-component Doppler flow vector measurements require multiangle approaches [27,49]. On the other hand, particle tracking velocimetry cannot be performed in a continuously scattering flowing media (e.g. blood), while Doppler imaging can be.
The techniques demonstrated here can be extended to three-dimensional, three-component flow velocitmetry. To scale up the current techniques in three dimensions using similar B-scan pixel densities would require line rates in the megahertz regime [51]. An alternate approach would be to divide the entire field of fiew into smaller subvolumes with each subvolume capable of being imaged by a submegahertz OCT system. After three-dimensional, three-component velocimetry is performed, the complete volume can be reconstructed by merging the subvolumes.
Qualitative imaging and phenotyping of cilia-driven fluid flow will enable more detailed research in ciliary biology and in respiratory medicine. Flow velocimetry can be used to characterize cilia performance or the overall performance of a ciliated surface. The ability to obtain quantitative vectorial flow profiles will enable the detailed study microfluidic phenomenon in biological cilia-driven fluid flow, including mixing.
Acknowledgments
We acknowledge the loan of the OCT from Thorlabs, Inc. We also acknowledge conversations about microfluidic flow with Michael Loewenberg (Yale Chemical Engineering).
References and links
- 1.H. C. Berg, Random Walks in Biology, revised ed. (Princeton University Press, 1993). [Google Scholar]
- 2.Okada Y., Takeda S., Tanaka Y., Belmonte J. C. I., Hirokawa N., “Mechanism of nodal flow: a conserved symmetry breaking event in left-right axis determination,” Cell 121(4), 633–644 (2005). 10.1016/j.cell.2005.04.008 [DOI] [PubMed] [Google Scholar]
- 3.Mitchell B., Jacobs R., Li J., Chien S., Kintner C., “A positive feedback mechanism governs the polarity and motion of motile cilia,” Nature 447(7140), 97–101 (2007). 10.1038/nature05771 [DOI] [PubMed] [Google Scholar]
- 4.Miskevich F., “Imaging fluid flow and cilia beating pattern in Xenopus brain ventricles,” J. Neurosci. Methods 189(1), 1–4 (2010). 10.1016/j.jneumeth.2010.02.015 [DOI] [PubMed] [Google Scholar]
- 5.Guirao B., Meunier A., Mortaud S., Aguilar A., Corsi J. M., Strehl L., Hirota Y., Desoeuvre A., Boutin C., Han Y. G., Mirzadeh Z., Cremer H., Montcouquiol M., Sawamoto K., Spassky N., “Coupling between hydrodynamic forces and planar cell polarity orients mammalian motile cilia,” Nat. Cell Biol. 12(4), 341–350 (2010). 10.1038/ncb2040 [DOI] [PubMed] [Google Scholar]
- 6.Colantonio J. R., Vermot J., Wu D., Langenbacher A. D., Fraser S., Chen J. N., Hill K. L., “The dynein regulatory complex is required for ciliary motility and otolith biogenesis in the inner ear,” Nature 457(7226), 205–209 (2009). 10.1038/nature07520 [DOI] [PMC free article] [PubMed] [Google Scholar]
- 7.Kramer-Zucker A. G., Olale F., Haycraft C. J., Yoder B. K., Schier A. F., Drummond I. A., “Cilia-driven fluid flow in the zebrafish pronephros, brain and Kupffer’s vesicle is required for normal organogenesis,” Development 132(8), 1907–1921 (2005). 10.1242/dev.01772 [DOI] [PubMed] [Google Scholar]
- 8.Baker K., Beales P. L., “Making sense of cilia in disease: the human ciliopathies,” Am. J. Med. Genet. C. Semin. Med. Genet. 151C(4), 281–295 (2009). 10.1002/ajmg.c.30231 [DOI] [PubMed] [Google Scholar]
- 9.Sawamoto K., Wichterle H., Gonzalez-Perez O., Cholfin J. A., Yamada M., Spassky N., Murcia N. S., Garcia-Verdugo J. M., Marin O., Rubenstein J. L. R., Tessier-Lavigne M., Okano H., Alvarez-Buylla A., “New neurons follow the flow of cerebrospinal fluid in the adult brain,” Science 311(5761), 629–632 (2006). 10.1126/science.1119133 [DOI] [PubMed] [Google Scholar]
- 10.Lyons R. A., Saridogan E., Djahanbakhch O., “The reproductive significance of human Fallopian tube cilia,” Hum. Reprod. Update 12(4), 363–372 (2006). 10.1093/humupd/dml012 [DOI] [PubMed] [Google Scholar]
- 11.Stone H. A., Stroock A. D., Ajdari A., “Engineering flows in small devices: microfluidics toward a lab-on-a-chip,” Annu. Rev. Fluid Mech. 36(1), 381–411 (2004). 10.1146/annurev.fluid.36.050802.122124 [DOI] [Google Scholar]
- 12.Stroock A. D., Weck M., Chiu D. T., Huck W. T. S., Kenis P. J. A., Ismagilov R. F., Whitesides G. M., “Patterning electro-osmotic flow with patterned surface charge,” Phys. Rev. Lett. 84(15), 3314–3317 (2000). 10.1103/PhysRevLett.84.3314 [DOI] [PubMed] [Google Scholar]
- 13.Guirao B., Joanny J. F., “Spontaneous creation of macroscopic flow and metachronal waves in an array of cilia,” Biophys. J. 92(6), 1900–1917 (2007). 10.1529/biophysj.106.084897 [DOI] [PMC free article] [PubMed] [Google Scholar]
- 14.Mitchell B., Stubbs J. L., Huisman F., Taborek P., Yu C., Kintner C., “The PCP pathway instructs the planar orientation of ciliated cells in the Xenopus larval skin,” Curr. Biol. 19(11), 924–929 (2009). 10.1016/j.cub.2009.04.018 [DOI] [PMC free article] [PubMed] [Google Scholar]
- 15.Francis R. J., Chatterjee B., Loges N. T., Zentgraf H., Omran H., Lo C. W., “Initiation and maturation of cilia-generated flow in newborn and postnatal mouse airway,” Am. J. Physiol. Lung Cell. Mol. Physiol. 296(6), L1067–L1075 (2009). 10.1152/ajplung.00001.2009 [DOI] [PMC free article] [PubMed] [Google Scholar]
- 16.Ikegami K., Sato S., Nakamura K., Ostrowski L. E., Setou M., “Tubulin polyglutamylation is essential for airway ciliary function through the regulation of beating asymmetry,” Proc. Natl. Acad. Sci. U.S.A. 107(23), 10490–10495 (2010). 10.1073/pnas.1002128107 [DOI] [PMC free article] [PubMed] [Google Scholar]
- 17.Webb R. H., “Confocal optical microscopy,” Rep. Prog. Phys. 59(3), 427–471 (1996). 10.1088/0034-4885/59/3/003 [DOI] [Google Scholar]
- 18.Izatt J. A., Kulkarni M. D., Wang H. W., Kobayashi K., Sivak M. V., “Optical coherence tomography and microscopy in gastrointestinal tissues,” IEEE J. Sel. Top. Quantum Electron. 2(4), 1017–1028 (1996). 10.1109/2944.577331 [DOI] [Google Scholar]
- 19.Huang D., Swanson E. A., Lin C. P., Schuman J. S., Stinson W. G., Chang W., Hee M. R., Flotte T., Gregory K., Puliafito C. A., Fujimoto J. G., “Optical coherence tomography,” Science 254(5035), 1178–1181 (1991). 10.1126/science.1957169 [DOI] [PMC free article] [PubMed] [Google Scholar]
- 20.Fercher A. F., Drexler W., Hitzenberger C. K., Lasser T., “Optical coherence tomography - principles and applications,” Rep. Prog. Phys. 66(2), 239–303 (2003). 10.1088/0034-4885/66/2/204 [DOI] [Google Scholar]
- 21.Choma M. A., Ellerbee A. K., Yazdanfar S., Izatt J. A., “Doppler flow imaging of cytoplasmic streaming using spectral domain phase microscopy,” J. Biomed. Opt. 11(2), 024014 (2006). 10.1117/1.2193167 [DOI] [PubMed] [Google Scholar]
- 22.Bykov A. V., Priezzhev A. V., Lauri J., Myllylä R., “Doppler OCT imaging of cytoplasm shuttle flow in Physarum polycephalum,” J Biophotonics 2(8-9), 540–547 (2009). 10.1002/jbio.200910057 [DOI] [PubMed] [Google Scholar]
- 23.Choma M. A., Suter M. J., Vakoc B. J., Bouma B. E., Tearney G. J., “Physiological homology between Drosophila melanogaster and vertebrate cardiovascular systems,” Dis Model Mech 4(3), 411–420 (2011). 10.1242/dmm.005231 [DOI] [PMC free article] [PubMed] [Google Scholar]
- 24.Xi C. W., Marks D. L., Parikh D. S., Raskin L., Boppart S. A., “Structural and functional imaging of 3D microfluidic mixers using optical coherence tomography,” Proc. Natl. Acad. Sci. U.S.A. 101(20), 7516–7521 (2004). 10.1073/pnas.0402433101 [DOI] [PMC free article] [PubMed] [Google Scholar]
- 25.Ahn Y. C., Jung W. G., Chen Z. P., “Optical sectioning for microfluidics: secondary flow and mixing in a meandering microchannel,” Lab Chip 8(1), 125–133 (2008). 10.1039/b713626a [DOI] [PMC free article] [PubMed] [Google Scholar]
- 26.Baltussen M., Anderson P., Bos F., den Toonder J., “Inertial flow effects in a micro-mixer based on artificial cilia,” Lab Chip 9(16), 2326–2331 (2009). 10.1039/b901660k [DOI] [PubMed] [Google Scholar]
- 27.Pedersen C. J., Huang D., Shure M. A., Rollins A. M., “Measurement of absolute flow velocity vector using dual-angle, delay-encoded Doppler optical coherence tomography,” Opt. Lett. 32(5), 506–508 (2007). 10.1364/OL.32.000506 [DOI] [PubMed] [Google Scholar]
- 28.Ahn Y. C., Jung W., Chen Z. P., “Quantification of a three-dimensional velocity vector using spectral-domain Doppler optical coherence tomography,” Opt. Lett. 32(11), 1587–1589 (2007). 10.1364/OL.32.001587 [DOI] [PubMed] [Google Scholar]
- 29.Makita S., Fabritius T., Yasuno Y., “Quantitative retinal-blood flow measurement with three-dimensional vessel geometry determination using ultrahigh-resolution Doppler optical coherence angiography,” Opt. Lett. 33(8), 836–838 (2008). 10.1364/OL.33.000836 [DOI] [PubMed] [Google Scholar]
- 30.Davis A., Izatt J., Rothenberg F., “Quantitative measurement of blood flow dynamics in embryonic vasculature using spectral Doppler velocimetry,” Anat. Rec. (Hoboken) 292(3), 311–319 (2009). 10.1002/ar.20808 [DOI] [PMC free article] [PubMed] [Google Scholar]
- 31.Ma Z., Liu A., Yin X., Troyer A., Thornburg K., Wang R. K., Rugonyi S., “Measurement of absolute blood flow velocity in outflow tract of HH18 chicken embryo based on 4D reconstruction using spectral domain optical coherence tomography,” Biomed. Opt. Express 1(3), 798–811 (2010). 10.1364/BOE.1.000798 [DOI] [PMC free article] [PubMed] [Google Scholar]
- 32.Singh A. S. G., Kolbitsch C., Schmoll T., Leitgeb R. A., “Stable absolute flow estimation with Doppler OCT based on virtual circumpapillary scans,” Biomed. Opt. Express 1(4), 1047–1058 (2010). 10.1364/BOE.1.001047 [DOI] [PMC free article] [PubMed] [Google Scholar]
- 33.Adrian R. J., “Particle-imaging techniques for experimental fluid-mechanics,” Annu. Rev. Fluid Mech. 23(1), 261–304 (1991). 10.1146/annurev.fl.23.010191.001401 [DOI] [Google Scholar]
- 34.Pereira F., Stuer H., Graff E. C., Gharib M., “Two-frame 3D particle tracking,” Meas. Sci. Technol. 17(7), 1680–1692 (2006). 10.1088/0957-0233/17/7/006 [DOI] [Google Scholar]
- 35.Lee S. J., Kim S., “Advanced particle-based velocimetry techniques for microscale flows,” Microfluidics Nanofluidics 6(5), 577–588 (2009). 10.1007/s10404-009-0409-6 [DOI] [Google Scholar]
- 36.M. Raffel, C. E. Willert, S. T. Wereley, and J. Kompenhans, “Introduction,” in Particle Image Velocimetry, 2nd ed. (Springer, New York, 2007). [Google Scholar]
- 37.Billett F. S., Gould R. P., “Fine structural changes in the differentiating epidermis of Xenopus laevis embryos,” J. Anat. 108(Pt 3), 465–480 (1971). [PMC free article] [PubMed] [Google Scholar]
- 38.Khokha M. K., Chung C., Bustamante E. L., Gaw L. W., Trott K. A., Yeh J., Lim N., Lin J. C., Taverner N., Amaya E., Papalopulu N., Smith J. C., Zorn A. M., Harland R. M., Grammer T. C., “Techniques and probes for the study of Xenopus tropicalis development,” Dev. Dyn. 225(4), 499–510 (2002). 10.1002/dvdy.10184 [DOI] [PubMed] [Google Scholar]
- 39.Patwardhan A., “Subpixel position measurement using 1D, 2D and 3D centroid algorithms with emphasis on applications in confocal microscopy,” J. Microsc. (Oxford) 186(3), 246–257 (1997). 10.1046/j.1365-2818.1997.1970761.x [DOI] [Google Scholar]
- 40.J. L. Semmlow, “Image Segmentation,” in Biosignal and Medical Image Processing (Marcel Dekker, Inc., New York, 2004). [Google Scholar]
- 41.L. Lovasz and M. D. Plummer, Matching Theory (Elsevier Science Ltd, Amsterdam, 1986). [Google Scholar]
- 42.L. A. N. Laboratory, “NetworkX Developer Zone” (2011), http://networkx.lanl.gov/trac
- 43.B. J. McKeon, G. v. Comte-Bellot, J. F. Foss, J. Westerweel, F. Scarano, C. Tropea, J. F. Meyers, J. W. Lee, A. A. Cavone, R. Schodl, M. M. Koochesfahani, D. G. Nocera, Y. Andreopoulos, W. J. A. Dahm, J. A. Mullin, J. M. Wallace, P. V. Vukoslavcevic, S. C. Morris, E. R. Pardyjak, and A. Cuerva, “Velocity, vorticity, and Mach number,” in Springer Handbook of Experimental Fluid Mechanics, C. Tropea, A. L. Yarin, and J. F. Foss, eds. (Springer-Verlag, Berlin, 2007), p. 288. [Google Scholar]
- 44.Boas D. A., Bizheva K. K., Siegel A. M., “Using dynamic low-coherence interferometry to image Brownian motion within highly scattering media,” Opt. Lett. 23(5), 319–321 (1998). 10.1364/OL.23.000319 [DOI] [PubMed] [Google Scholar]
- 45.Oh K., Smith B., Devasia S., Riley J. J., Chung J. H., “Characterization of mixing performance for bio-mimetic silicone cilia,” Microfluidics Nanofluidics 9(4-5), 645–655 (2010). 10.1007/s10404-010-0578-3 [DOI] [Google Scholar]
- 46.Wehbe H., Ruggeri M., Jiao S., Gregori G., Puliafito C. A., Zhao W., “Automatic retinal blood flow calculation using spectral domain optical coherence tomography,” Opt. Express 15(23), 15193–15206 (2007). 10.1364/OE.15.015193 [DOI] [PubMed] [Google Scholar]
- 47.Werkmeister R. M., Dragostinoff N., Pircher M., Götzinger E., Hitzenberger C. K., Leitgeb R. A., Schmetterer L., “Bidirectional Doppler Fourier-domain optical coherence tomography for measurement of absolute flow velocities in human retinal vessels,” Opt. Lett. 33(24), 2967–2969 (2008). 10.1364/OL.33.002967 [DOI] [PubMed] [Google Scholar]
- 48.Hove J. R., Köster R. W., Forouhar A. S., Acevedo-Bolton G., Fraser S. E., Gharib M., “Intracardiac fluid forces are an essential epigenetic factor for embryonic cardiogenesis,” Nature 421(6919), 172–177 (2003). 10.1038/nature01282 [DOI] [PubMed] [Google Scholar]
- 49.Iftimia N. V., Hammer D. X., Ferguson R. D., Mujat M., Vu D., Ferrante A. A., “Dual-beam Fourier domain optical Doppler tomography of zebrafish,” Opt. Express 16(18), 13624–13636 (2008). 10.1364/OE.16.013624 [DOI] [PubMed] [Google Scholar]
- 50.Jenkins M. W., Peterson L., Gu S., Gargesha M., Wilson D. L., Watanabe M., Rollins A. M., “Measuring hemodynamics in the developing heart tube with four-dimensional gated Doppler optical coherence tomography,” J. Biomed. Opt. 15(6), 066022 (2010). 10.1117/1.3509382 [DOI] [PMC free article] [PubMed] [Google Scholar]
- 51.Wieser W., Biedermann B. R., Klein T., Eigenwillig C. M., Huber R., “Multi-megahertz OCT: high quality 3D imaging at 20 million A-scans and 4.5 GVoxels per second,” Opt. Express 18(14), 14685–14704 (2010). 10.1364/OE.18.014685 [DOI] [PubMed] [Google Scholar]


