Abstract
Purpose
To demonstrate the feasibility of combining a chemical shift-based water-fat separation method (IDEAL) with a 2D ultrashort echo time (UTE) sequence for imaging and quantification of the short T2 tissues with robust fat suppression.
Materials and Methods
A 2D multislice UTE data acquisition scheme was combined with IDEAL processing, including estimation, chemical shift artifacts correction, and multifrequency modeling of the fat spectrum to image short T2 tissues such as the Achilles tendon and meniscus both in vitro and in vivo. The integration of an advanced field map estimation technique into this combined method, such as region growing (RG), is also investigated.
Results
The combination of IDEAL with UTE imaging is feasible and excellent water-fat separation can be achieved for the Achilles tendon and meniscus with simultaneous estimation and chemical shift artifact correction. Multifrequency modeling of the fat spectrum yields more complete water-fat separation with more accurate correction for chemical shift artifacts. The RG scheme helps to avoid water-fat swapping.
Conclusion
The combination of UTE data acquisition with IDEAL has potential applications in imaging and quantifying short T2 tissues, eliminating the necessity for fat suppression pulses that may directly suppress the short T2 signals.
Keywords: ultrashort TE (UTE), ultrashort TE spectroscopic imaging (UTESI), IDEAL, water-fat separation, T*2 estimation, artifact correction
Tissues with relatively long T2 relaxation components in the human musculoskeletal (MSK) system can be visualized with conventional magnetic resonance imaging (MRI) techniques. However, there are a variety of tissues with short T2 values that cannot be directly visualized with conventional techniques due to rapid T2 or signal decay. Such tissues include the deep radial and calcified layers of articular cartilage, menisci, ligaments, tendons, and entheses (1–4). Novel MRI techniques have been developed to visualize these short T2 tissues in the MSK system (1–5).
One method used to detect the short T2 signal components is ultrashort TE (UTE) imaging (1–4,6). UTE methods employ a variety of approaches, including short half pulses for slice selection, rapid transmit/receive (T/R) switching, radial ramp sampling of k-space, and variable-rate selective excitation (VERSE) to acquire the signal immediately after radiofrequency (RF) excitation. A minimum echo time (TE) of 8 μs has been achieved (7). In conventional UTE imaging, fat saturation is typically required to improve the contrast for tissues with short T2 times. However, conventional chemical shift-based fat saturation may be problematic when imaging short T2 tissues because the broad spectral width of these species may overlap with that of fat. As a result, fat saturation pulse may inadvertently saturate the signal from short T2 tissues, either directly or as a result of magnetization transfer.
One possible approach to separate fat signal from water in imaging of short T2 tissues is to combine UTE with spectroscopic imaging (UTESI) (1,8,9). Similar to echo-planar spectroscopic imaging (EPSI) (10), spectroscopic images with high spatial resolution can be obtained by performing Fourier transform in the spectral dimension on a pixel-by-pixel basis, providing spectral information including spectrum, bulk susceptibility effect, water-fat separation, etc. (8,9).
While UTESI has been a successful technique to separate different chemical species (primarily water and fat), chemical shift artifacts from the non-Cartesian UTE technique and B0 inhomogeneities have not been addressed in previous UTE applications. With conventional MRI, many chemical shift-based decomposition techniques, such as the multipoint Dixon approach (11), direct phase encoding (12), or IDEAL (iterative decomposition of water and fat with echo asymmetry and least-squares estimation) (13–17), have been increasingly used for long T2 tissues, providing excellent water-fat separation with correction of some of these artifacts. Therefore, new methods, such as a UTE IDEAL approach which combines conventional water-fat separation methods with UTE data acquisition may overcome some of the aforementioned challenges and eliminate the necessity for fat saturation pulses. From both the data acquisition and reconstruction perspectives, the UTE IDEAL approach shares a lot of similarities with conventional IDEAL, and is expected to preserve signal from short T2 tissue and provide high contrast water-only images as well as mapping.
In this work we present a chemical shift separation method, based on the IDEAL water-fat separation algorithms and UTE data acquisition, to image short T2 tissues with water-fat separation and estimation. This technique employs multifrequency modeling of fat to improve water-fat separation. The combination of k-space formulation of IDEAL with estimation is also proposed to efficiently correct chemical shift artifacts. This technique was employed to image and quantify the Achilles tendon and meniscus both in vitro and in vivo using a clinical 3T scanner.
Theory
Drawbacks of Fat Saturation for Short T2 Tissue
Chemical shift-based fat saturation pulses are usually spectrally selective. Because the width of the water peak of short T2 tissues may be very wide (due to the short T2) and may overlap with that of the fat peak, a fraction of the short T2 signal (for example, up to 32% for the Achilles tendon; unpubl. results) may be suppressed by the fat saturation pulse. Another drawback of the saturation pulse is that fat has multiple peaks, some of which are very close to the water peak. Therefore, a spectral selective pulse cannot effectively suppress the signal from all of the fat protons (17), resulting in reduced image contrast for short T2 tissues.
Brief Review of IDEAL and Its Variations
In 2004 and 2005, Reeder et al (13,14) described the IDEAL technique for water-fat separation. In this method, the B0 inhomogeneity map is iteratively solved by minimizing the residue of the signal model and acquired images. It is well known that water-fat separation may suffer from water-fat ambiguity, and in 2005 Yu et al (18) presented a region-growing (RG) scheme to obtain a more accurate field map. Since then, a number of different approaches have been introduced to more robustly estimate the field map (19,20). In 2007 Yu et al (15) presented a variation of this method, termed -IDEAL, which considers the effective decay between the acquisition of different echoes. -IDEAL introduces the concept of the complex field map, whose real part is the conventional B0 inhomogeneity and whose imaginary part corresponds to the map. In 2008, a k-space formulation of the IDEAL algorithm, named k-space IDEAL, was described by Brodsky et al (16). The key principle of the k-space approach is that it introduces a timestamp, τk⃗,n, to account for the relative time between the center of k-space and the sampled point and then corrects the chemical shift artifacts experienced with non-Cartesian trajectories. In the same year, Yu et al (17) described the use of multifrequency spectral modeling in combination with the -IDEAL approach to account for the spectral complexity of fat. This spectral modeling was included in Brodsky et al's work (16) as well. Meanwhile, Bydder et al (21) also described the use of multifrequency spectral modeling for quantification of fat. For the purposes of this work, we will refer to the use of multifrequency fat spectral modeling as “multipeak” (MP) IDEAL.
Combining -IDEAL and k-space IDEAL
The reported image space -IDEAL can be combined with the k-space IDEAL formulation by implementing the two algorithms sequentially. Specifically, a basic chemical shift decomposition signal model can be mathematically described by:
| [1] |
where ρm is the intensity of the mth species and is, in general, a complex term with its own magnitude and phase. Δfm is the chemical shift (in Hz) for the mth species which is modeled in Eq. [1] as having a single spectral peak, ψ(r⃗) is the local magnetic resonance offset (in Hz), and n refers to the echo index. If the effect of decay between the acquired echo images is significant, such as in UTE applications where the tissues of interest have very short T2 relaxation times, an exponential decay term can be added into Eq. [1], as in the -IDEAL model:
| [2] |
In the above equation, and which is the complex field map. Here or is a spatially variant but species-independent parameter; therefore, this parameter assumes that all species share the same value if they coexist in a single voxel (15). This complex field map can be determined iteratively and then demodulated from the source signals, which can be written as:
| [3] |
Performing a Fourier transform on the image ŝn (r⃗) yields the k-space representation of the demodulated signal, ŝn (τk⃗,nk⃗):
| [4] |
where the new term τk⃗,n refers to the relative time between the acquisition of sample point k⃗ and the center of k-space (22-24). Unlike the image space model in Eq. [3] where it is assumed that all signals of an echo are collected at a single timepoint (tn), the k-space formulation allows the characterization of the sample time difference for each k-space point during the readout. As a result, this method corrects for the phase accumulated during the actual readout time due to the chemical shifts of different species (ie, water and fat). It will be shown later that the k-space formulation can significantly improve the quality of the fat image by removing blurring caused by chemical shift.
Multipeak Signal Model
Although it is often approximated by a single peak, the fat spectrum has multiple spectral peaks. As demonstrated in recent studies (16,17,25), the presence of multiple fat peaks can effectively increase the line width of the main fat peak (3.5 ppm downfield from water), simulating a faster decay. For qualitative water-fat separation, the single peak model often results in “gray fat” in the water image, resulting from incomplete water-fat separation due to fat peaks near the water peak. Assuming that the relative amplitudes of these peaks are measured and known as prior knowledge, the fat spectral peaks can be modeled (“multipeak” model) accordingly. Therefore, the image space formulation, Eq. [2], becomes:
| [5] |
and the k-space formulation Eq. [4] becomes:
| [6] |
where Δfp is the resonant frequency of the pth fat peak (p = 1, 2, …, P) relative to water, and αp is its relative amplitude, such that . In Eqs. [5] and [6] we have already simplified our model by assuming that water and fat are the only two species present in the image, ie, m = 1 means water (w), m = 2 means fat (f), and M = 2.
Materials and Methods
The proposed chemical shift decomposition algorithm, described by Eq. [6], is a k-space formulation of IDEAL with estimation and multifrequency fat spectrum modeling, and can be summarized schematically in Fig. 1. The implementation of this method includes the following steps as denoted in the figure:
Figure 1.
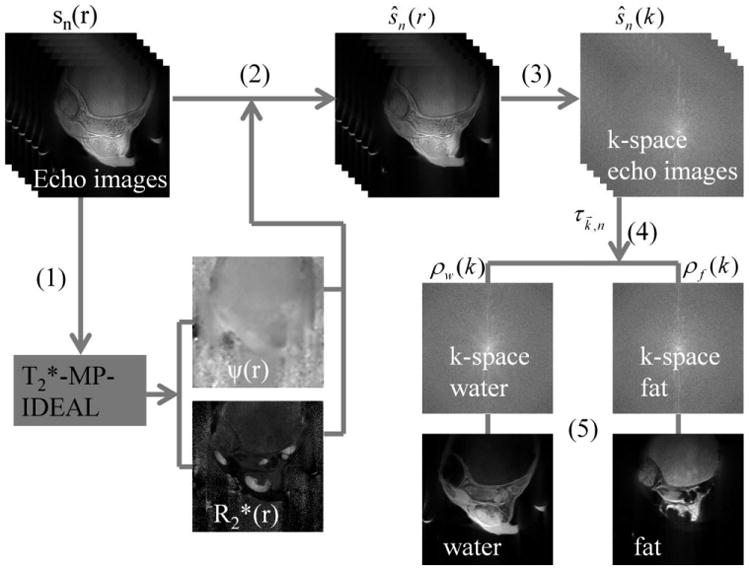
Schematic diagram of the proposed decomposition method; (1–5) correspond to the five steps described in Materials and Methods.
Perform the image space IDEAL algorithm with estimation and multipeak fat spectral model (Eq. [5]) on the reconstructed echo images to generate a B0 inhomogeneity map (ψ(r⃗)) and an map. Advanced field map estimation methods, such as an RG scheme, can be included in this step.
Use the B0 inhomogeneity map and the map to process the complex echo images to obtain demodulated echo sources, ie, ŝn(r).
Perform a Fourier transform (if Cartesian acquisition) or non-Cartesian sampling operator on the demodulated echo images, generating a k-space representation of these images, ŝn(k).
Decompose the water and fat signal in k-space to obtain ρw(k) and ρf(k) using a least-square approach and the actual readout time τk⃗,n, which was determined using known pulse sequence timing (Eq. [6]).
Perform an inverse Fourier transform or non-Cartesian reconstruction method to generate the final water and fat images.
Institutional Review Board approval and informed consent were obtained prior to all scanning. The proposed method was applied to the Achilles tendon and meniscus using a 2D multislice radial UTE technique in cadaveric ankle specimens (Experiments 1 and 4) and healthy volunteers (Experiments 2 and 3) using a 3 T Signa TwinSpeed scanner (GE Healthcare Technologies, Milwaukee, WI) with a maximum gradient performance of 40 mT/m and 150 mT/m/msec.
In Experiments 1 and 2, single-echo acquisition was used since the Achilles tendon has a short of around 2 msec. For each echo image, 512 half projections were acquired and each half projection contained 284 points sampled at a rate of 8 μs per points. Six echo images were acquired with the center of k-space sampled at TE = 8 μs, 400 μs, 800 μs, 1200 μs, 2000 μs, 3000 μs. Common imaging parameters include: FOV = 10 cm, readout = 512, slice thickness = 3.0 mm, bandwidth (BW) = ±62.5 kHz, NEX = 2, flip angle = 45°, TR =100 msec, and total scan time = 10.6 minutes. For Experiment 3 a multiecho UTE sequence was used for meniscus imaging with improved scanning efficiency. The meniscus has a longer allowing multiecho acquisition. In this experiment, four echoes were acquired with TE = 8 μs, 3.3 msec, 6.6 msec, and 9.9 msec, TR = 500 msec, FOV =15 cm, slice thickness = 3 mm, 22 slices, FA = 45°, BW = ±125 kHz, resulting in a total scan time of 8.5 minutes. Each image contained 512 half projection with 262 sampling points. We also investigated the feasibility of multiecho UTE acquisition for the Achilles tendon in Experiment 4, where a total number of six echo images were acquired at three separate TRs: TE = 12 μs/3.4 msec acquired in the first TR, TE = 0.8 msec/4.2 msec in the second and TE = 1.6 msec/5 msec in the third (9). Taking the shorter of the Achilles tendon into account, we increased the sampling bandwidth to ±125 kHz, reduced the spatial resolution by increasing the FOV to 15 cm, and reducing readout to 384 (262 sampling points) to reduce the echo spacing down to 3.4 msec. Other imaging parameters included: TR = 200 msec, FA = 45°, NEX = 2, 16 slices with slice thickness = 2 mm, 512 half projections, scan time = 10.5 minutes. In this experiment, a fat saturation image obtained with a fat-selective saturation pulse followed by a spoiling gradient was also included for comparison. Slice thickness = 3 mm, TR = 300 msec, FOV =12 cm with 512 readout.
In the reconstruction, half projections that were 180° apart were combined into a full projection prior to standard filtered back-projection (FBP) reconstruction to generate echo source images. In the third step of the proposed method, the demodulated echo images, ŝn(r), were reprojected (ie, Radon transformed) and Fourier transformed to produce the radial k-space representation, ŝn(k).
Images reconstructed from Experiments 1 and 2 using IDEAL with estimation and multipeak fat model, with and without the k-space formulation, were compared in order to evaluate the importance of the different reconstruction steps. In addition, the significance of the accurate spectral modeling of fat was studied. Subsequently, the role of the RG field map estimation was investigated using data from Experiment 3. Finally, data from Experiment 4 were processed to show the feasibility of achieving scan time reduction using multipass multiecho sequences for UTE IDEAL tendon imaging.
Results
Figure 2 shows the results from Experiments 1 and 2. The image space (Eq. [5]) and k-space IDEAL (Eq. [6]), both with estimation and multipeak modeling, were compared. In both experiments the readout duration was 8 μs/point × 284 points = 2.3 msec, which corresponds to an approximate 2π phase for fat at 3 T As a result, severe blurring artifacts, which manifest as ringing artifacts in radial imaging of fat, are observed in Fig. 2b,c and h,i (arrows). The blurring artifacts are removed using the k-space decomposition approach, as shown in Fig. 2e,f and k,l, which corrects for accumulated phase during readout.
Figure 2.
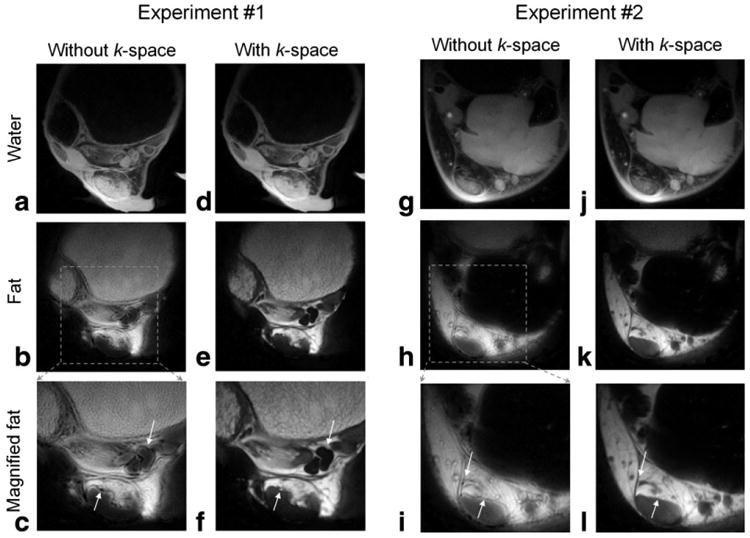
Comparison of the results from Experiments 1 and 2 using IDEAL with and without k-space formulation. compensation and multipeak model were included for both reconstruction methods. The chemical shift-induced blurring, indicated by the arrows, was significantly reduced by the k-space formulation.
Figure 3 shows the comparison between the single peak (Eq. [4]) and multipeak model (Eq. [6]) using data from Experiment 2. The frequencies and amplitudes of the multiple fat resonant peaks, shown in Table 1, were chosen based on previously reported work (26). The multipeak approach has two effects. First, it helps to suppress the remaining residual fat signal (“gray fat”) in the water image, as indicated by the arrows in the water image. Second, it corrects the chemical shift-induced artifacts more accurately than the single peak model (arrows in fat images).
Figure 3.
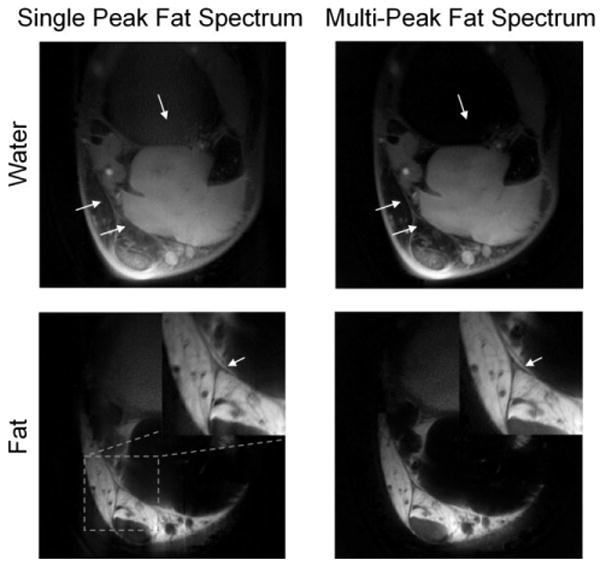
Multifrequency spectral modeling of fat spectrum (right) helped eliminating the “gray fat” signal in the water image with single peak fat spectrum model (left), as shown by the arrows in the water images. Multipeak model also corrected the chemical shift artifacts more accurately than single peak model, as shown by the increased sharpness (arrows in the fat images).
Table 1. Resonant Peaks of Fat at 3.0 T (26).
| Peak | #1 | #2 | #3 | #4 | #5 | #6 |
|---|---|---|---|---|---|---|
| fp (Hz) | 434 | 332 | 486 | −76 | 52 | 250 |
| αp | 0.69 | 0.13 | 0.09 | 0.05 | 0.04 | < 0.01 |
Figure 4 shows images from one slice in Experiment 3. Using a simple pixel independent approach (as defined in Ref. 18), the algorithm yields an incorrect field map and therefore results in water-fat swap. After applying the RG method the field map is correctly estimated throughout the image.
Figure 4.
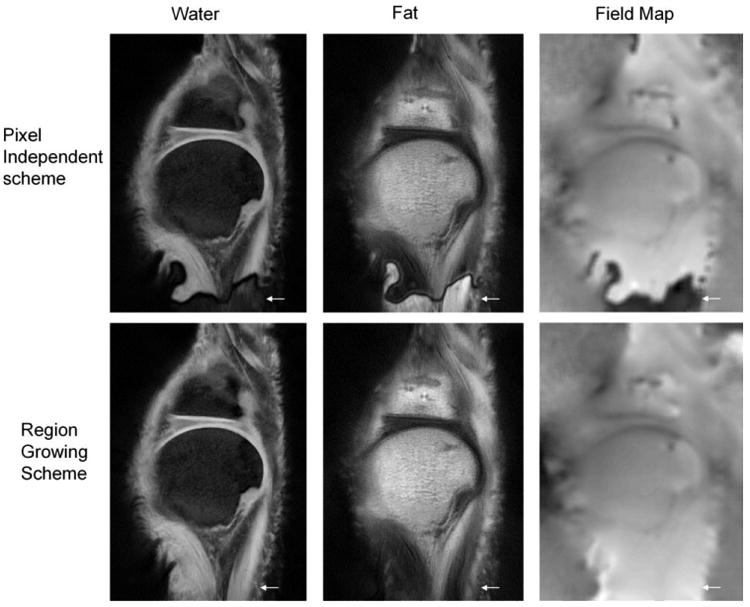
Water, fat, and field map images from the central slice in Experiment 3. A simple pixel independent approach yielded water-fat swapping (arrows). The RG method provided a more accurate field map and avoided the phase swapping.
Figure 5 shows the map obtained from the first step in Fig. 1 for the first three experiments. A region of interest (ROI) containing 10 × 10 pixels was placed in the central portion of the Achilles tendon and meniscus and their were measured to be ≈2.2 ± 0.24 msec, 1.5 ± 0.20 msec, and 9.0 ± 1.6 msec for Experiments 1, 2, and 3, respectively. The map for Experiment 3 is noisier because only four echoes were acquired (please see Discussion, below).
Figure 5.
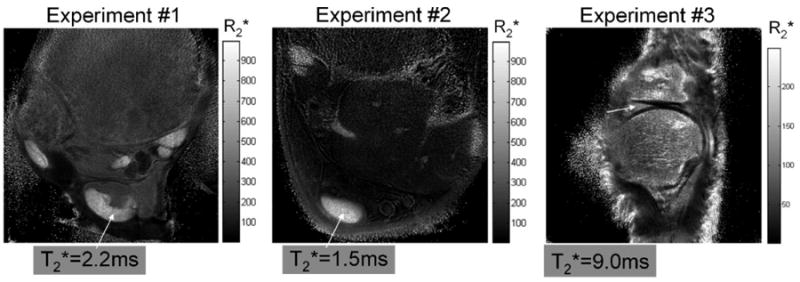
The maps from the first three experiments. The tendon (arrows) was found to have a of ≈2.2 ± 0.24 msec for Experiment 1 and 1.5 ± 0.20 msec for Experiment 2. For Experiment 3 the of meniscus, pointed by the arrow, was about 9.0 ± 1.6 msec.
Figure 6 shows comparison between the fat saturation and UTE IDEAL techniques using data from Experiment 4. The water images of all slices from the UTE IDEAL method provides superior fat suppression than the chemical shift-based fat saturation technique, and the fine structures surrounding the tendon are much better depicted.
Figure 6.

Results from Experiment 4, a 2D multislice multiecho and multipass UTE IDEAL scan of an ankle specimen. Images from multiple slices are shown. A fat saturated image is also provided for comparison. UTE IDEAL provides superior fat suppression and better depiction of the tendon and its surrounding structures than the conventional fat saturated UTE acquisition technique.
Discussion
In this work we present a k-space water-fat decomposition method for UTE imaging of short T2 tissues. The proposed method integrates the advantages of -IDEAL, k-space IDEAL, and MP-IDEAL to compensate for decay between echo source images, to correct for chemical shift-induced ringing artifacts in UTE imaging, and to account for the spectral complexity of fat.
In this work we used a single echo acquisition with variable TE delays for tendon imaging in Experiments 1 and 2 to demonstrate the importance of each reconstruction step in the proposed water-fat separation method, such as k-space formulation and multifrequency modeling of a fat spectrum. The strategy to select the TEs is as follows. First, it is clear that collecting more echoes will improve the accuracy of the fitting of all parameters, especially . However, due to scan time limitations, we found that six-echo acquisitions in 8–10 minutes achieved a good balance between total scan time and accuracy in fitting. Second, since the imaging object contains tissue with very short (≈2 msec), we chose the first echo time, TE1, to be the shortest echo time achievable using our UTE technique (8 μs). Third, as suggested in Ref. (15), when acquiring more than three echoes the noise performance, measured by the effective number of signal averages (NSA), is less sensitive to the change of echo spacing, unless echo spacing is close to 0 or 2π. According to these considerations, we chose TE1 = 8 μs and ΔTE = 0.4 msec for the first three echoes in order to acquire images with better signal-to-noise ratio (SNR), and ΔTE = 0.8 msec spacing for later echoes in order to allow sufficient phase difference between fat and water and enough decay for better estimation. While single echo acquisition is very robust in terms of avoiding water-fat ambiguity and acquiring more echoes at earlier TEs with higher signal, the TR is limited by scan time and precludes sufficient slice coverage.
Since meniscus has a longer T2, single-pass, multiecho acquisition is possible to acquire all echoes needed within one TR, as demonstrated in Experiment 3. This allows sufficient slice coverage within acceptable scan time. However, the minimal echo spacing, ie, ΔTE, is limited by the hardware (maximum gradient, maximum slew rate, bandwidth, etc.). For the protocol used in Experiment 3, ΔTE corresponds to a water-fat phase difference larger than 2π. The major impact of this is the increased number of local minima in the residue curve for field map estimations (18). That is why advanced field map estimation methods, such as an RG scheme, are necessary for single-pass multiecho UTE IDEAL acquisition.
In order to increase the TR and slice coverage for tendon imaging, we implemented a multipass multiecho acquisition, as demonstrated in Experiment 4. Since tendon has short (≈2 msec), increasing echo train length is not helpful due to low signal at later echoes. For a more robust field map estimation, a three-pass protocol with two echoes per pass was chosen in this work. Since the first three echoes were equally spaced within a 2π water-fat phase difference in Experiment 4, a very basic MP-IDEAL algorithm can be first performed on the earliest three echoes to generate an initial guess of the field map, subsequently incorporating this initial guess in the proposed water-fat separation method (Eq. [6]) to process all the echo images acquired. Other protocols such as two passes with two echoes per pass are also possible. However, because of the large ΔTE and only four echo images acquired, more advanced field map estimation methods are needed and estimation is expected be less accurate.
The major limitation of this work is that it uses two assumptions associated with the signal model described by Eq. [6] in this article. First, it assumes that any species coexisting in a voxel will have the same and this may be problematic for some human MSK tissues or at interfaces between two species. However, the ROIs in this work, ie, tendon and meniscus, are mostly comprised of water. Therefore, species-independent estimation is a valid assumption for tendon or meniscus imaging. Recently, Chebrolu et al (27) provided an approach to estimate for water and fat independently, and can in principle be included in the UTE IDEAL application. Another assumption in this work is that water is a single T2 compartment in the ROI, which may not be true for tendon or meniscus imaging. Even though we can model water in multiple compartments as multiple independent species in Eq. [6], more echo images are needed due to the increase of unknowns in the equation. One possible approach may include incorporating prior knowledge of the multiple water compartments in the signal model, similar to the current multifrequency modeling of fat spectrum. These two assumptions imply that the obtained by the proposed model is an average value of all the species and all compartments within a voxel.
In conclusion, we have presented a water-fat decomposition method for UTE applications. The proposed method combines a chemical shift-based water-fat separation method that corrects for the effects of decay ( -IDEAL) with a k-space formulation (k-space IDEAL) and includes the effects of accurate spectral modeling (MP-IDEAL). This combined UTE IDEAL method provides high contrast imaging of the short T2 tissues with robust fat water separation, as well as automatic mapping.
References
- 1.Gold GE, Pauly JM, Macovski A, Herfkens RJ. MR spectroscopic imaging of collagen: tendons and knee menisci. Magn Reson Med. 1995;34:647–654. doi: 10.1002/mrm.1910340502. [DOI] [PubMed] [Google Scholar]
- 2.Robson MD, Gatehouse PD, Bydder M, Bydder GM. Magnetic resonance: an introduction to ultrashort TE (UTE) imaging. J Comput Assist Tomogr. 2003;27:825–846. doi: 10.1097/00004728-200311000-00001. [DOI] [PubMed] [Google Scholar]
- 3.Gatehouse PD, Bydder GM. Magnetic resonance imaging of short T2 components in tissue. Clin Radiol. 2003;58:1–19. doi: 10.1053/crad.2003.1157. [DOI] [PubMed] [Google Scholar]
- 4.Robson MD, Benjamin M, Gishen P, Bydder GM. Magnetic resonance imaging of the Achilles tendon using ultrashort TE (UTE) pulse sequences. Clin Radiol. 2004;59:727–735. doi: 10.1016/j.crad.2003.11.021. [DOI] [PubMed] [Google Scholar]
- 5.Idiyatullin D, Corum C, Park JY, Garwood M. Fast and quiet MRI using a swept radiofrequency. J Magn Reson. 2006;181:342–349. doi: 10.1016/j.jmr.2006.05.014. [DOI] [PubMed] [Google Scholar]
- 6.Rahmer J, Bornert P, Groen J, Bos C. Three-dimensional radial ultrashort echo-time imaging with T2 adapted sampling. Magn Reson Med. 2006;55:1075–1082. doi: 10.1002/mrm.20868. [DOI] [PubMed] [Google Scholar]
- 7.Brittain JH, Shankaranarayanan A, Ramanan V, et al. Ultra-short TE imaging with single-digit (8 μs) TE. Proc 12th Annual Meeting ISMRM, Kyoto; 2004. p. 629. [Google Scholar]
- 8.Du J, Hamilton G, Takahashi A, Bydder M, Chung CB. Ultrashort echo time spectroscopic imaging (UTESI) of cortical bone. Magn Reson Med. 2007;58:1001–1009. doi: 10.1002/mrm.21397. [DOI] [PubMed] [Google Scholar]
- 9.Du J, Takahashi AM, Chung CB. Ultrashort TE spectroscopic imaging (UTESI): application to the imaging of short T2 relaxation tissues in the musculoskeletal system. J Magn Reson Imaging. 2009;29:412–421. doi: 10.1002/jmri.21465. [DOI] [PubMed] [Google Scholar]
- 10.Posse S, DeCarli C, Le Bihan D. Three-dimensional echo-planar MR spectroscopic imaging at short echo times in the human brain. Radiology. 1994;192:733–738. doi: 10.1148/radiology.192.3.8058941. [DOI] [PubMed] [Google Scholar]
- 11.Dixon WT. Simple proton spectroscopic imaging. Radiology. 1984;153:189–194. doi: 10.1148/radiology.153.1.6089263. [DOI] [PubMed] [Google Scholar]
- 12.Xiang QS, An L. Water-fat imaging with direct phase encoding. J Magn Reson Imaging. 1997;7:1002–1015. doi: 10.1002/jmri.1880070612. [DOI] [PubMed] [Google Scholar]
- 13.Reeder SB, Wen Z, Yu H, et al. Multicoil Dixon chemical species separation with an iterative least-squares estimation method. Magn Reson Med. 2004;51:35–45. doi: 10.1002/mrm.10675. [DOI] [PubMed] [Google Scholar]
- 14.Reeder SB, Pineda AR, Wen Z, et al. Iterative decomposition of water and fat with echo asymmetry and least-squares estimation (IDEAL): application with fast spin-echo imaging. Magn Reson Med. 2005;54:636–644. doi: 10.1002/mrm.20624. [DOI] [PubMed] [Google Scholar]
- 15.Yu H, McKenzie CA, Shimakawa A, et al. Multiecho reconstruction for simultaneous water-fat decomposition and T2* estimation. J Magn Reson Imaging. 2007;26:1153–1161. doi: 10.1002/jmri.21090. [DOI] [PubMed] [Google Scholar]
- 16.Brodsky EK, Holmes JH, Yu H, Reeder SB. Generalized k-space decomposition with chemical shift correction for non-Cartesian water-fat imaging. Magn Reson Med. 2008;59:1151–1164. doi: 10.1002/mrm.21580. [DOI] [PubMed] [Google Scholar]
- 17.Yu H, Shimakawa A, McKenzie CA, Brodsky E, Brittain JH, Reeder SB. Multiecho water-fat separation and simultaneous R2* estimation with multifrequency fat spectrum modeling. Magn Reson Med. 2008;60:1122–1134. doi: 10.1002/mrm.21737. [DOI] [PMC free article] [PubMed] [Google Scholar]
- 18.Yu H, Reeder SB, Shimakawa A, Brittain JH, Pelc NJ. Field map estimation with a region growing scheme for iterative 3-point water-fat decomposition. Magn Reson Med. 2005;54:1032–1039. doi: 10.1002/mrm.20654. [DOI] [PubMed] [Google Scholar]
- 19.Lu W, Hargreaves BA. Multiresolution field map estimation using golden section search for water-fat separation. Magn Reson Med. 2008;60:236–244. doi: 10.1002/mrm.21544. [DOI] [PubMed] [Google Scholar]
- 20.Lu Y, Lu W, Hargreaves BA. JIGSAW: joint inhomogeneity estimation via global segment assembly for water-fat separation. Proc 17th Annual Meeting ISMRM, Honolulu; 2009. p. 566. [DOI] [PubMed] [Google Scholar]
- 21.Bydder M, Yokoo T, Hamilton G, et al. Relaxation effects in the quantification of fat using gradient echo imaging. Magn Reson Imaging. 2008;26:347–359. doi: 10.1016/j.mri.2007.08.012. [DOI] [PMC free article] [PubMed] [Google Scholar]
- 22.Levin YS, Mayer D, Yen YF, Hurd RE, Spielman DM. Optimization of fast spiral chemical shift imaging using least squares reconstruction: application for hyperpolarized (13)C metabolic imaging. Magn Reson Med. 2007;58:245–252. doi: 10.1002/mrm.21327. [DOI] [PubMed] [Google Scholar]
- 23.Maeda A, Sano K, Yokoyama T. Reconstruction by weighted correlation for MRI with time-varying gradients. IEEE Trans Med Imaging. 1988;7:26–31. doi: 10.1109/42.3926. [DOI] [PubMed] [Google Scholar]
- 24.Man LC, Pauly JM, Macovski A. Multifrequency interpolation for fast off-resonance correction. Magn Reson Med. 1997;37:785–792. doi: 10.1002/mrm.1910370523. [DOI] [PubMed] [Google Scholar]
- 25.Kijowski R, Woods MA, Lee KS, et al. Improved fat suppression using multipeak reconstruction for IDEAL chemical shift fat-water separation: application with fast spin echo imaging. J Magn Reson Imaging. 2009;29:436–442. doi: 10.1002/jmri.21664. [DOI] [PMC free article] [PubMed] [Google Scholar]
- 26.Middleton MS, Hamilton G, Bydder M, Sirlin CB. How much fat is under the water peak in liver fat MR spectroscopy?. Proc 17th Annual Meeting ISMRM, Honolulu; 2009. p. 4331. [Google Scholar]
- 27.Chebrolu VV, Hines CD, Yu H, et al. Independent estimation of T2* for water and fat for improved accuracy of fat quantification. Proc 17th Annual Meeting ISMRM, Honolulu; 2009. p. 2847. [DOI] [PMC free article] [PubMed] [Google Scholar]


