

Abstract
Identification and annotation of all the genes in the sequenced Drosophila genome is a work in progress. Wild-type testis function requires many genes and is thus of potentially high value for the identification of transcription units. We therefore undertook a survey of the repertoire of genes expressed in the Drosophila testis by computational and microarray analysis. We generated 3141 high-quality testis expressed sequence tags (ESTs). Testis ESTs computationally collapsed into 1560 cDNA set used for further analysis. Of those, 11% correspond to named genes, and 33% provide biological evidence for a predicted gene. A surprising 47% fail to align with existing ESTs and 16% with predicted genes in the current genome release. EST frequency and microarray expression profiles indicate that the testis mRNA population is highly complex and shows an extended range of transcript abundance. Furthermore, >80% of the genes expressed in the testis showed onefold overexpression relative to ovaries, or gonadectomized flies. Additionally, >3% showed more than threefold overexpression at p <0.05. Surprisingly, 22% of the genes most highly overexpressed in testis match Drosophila genomic sequence, but not predicted genes. These data strongly support the idea that sequencing additional cDNA libraries from defined tissues, such as testis, will be important tools for refined annotation of the Drosophila genome. Additionally, these data suggest that the number of genes in Drosophila will significantly exceed the conservative estimate of 13,601.
[The sequence data described in this paper have been submitted to the dbEST data library under accession nos. AI944400–AI947263 and BE661985–BE662262.]
[The microarray data described in this paper have been submitted to the GEO data library under accession nos. GPLS, GSM3–GSM10.]
Genome projects are revolutionizing biology. However, extracting biologically relevant information from sequence data will be a protracted process. Clearly, a thorough analysis of even a single gene by traditional molecular genetic techniques is wrought with complexities that are only resolved by multifaceted analysis. Similarly, only by compiling evidence from computational, functional, and evolutionary data will we ultimately arrive at a comprehensive understanding of how an organism is genetically encoded.
The immediate challenge in the post-genomic era is identifying transcribed regions of DNA. Genefinding programs are vitally important tools for identifying transcription units, but are subject to errors. The alcohol dehydrogenase region of Drosophila is a case in point. Gene-calling programs failed to identify some known genes in this region (Ashburner et al. 1999; Ashburner 2000; Birney and Durbin 2000; Gaasterland et al. 2000; Henikoff and Henikoff 2000; Krogh 2000; Parra et al. 2000; Reese et al. 2000a;b; Salamov and Solovyev 2000). Expressed sequence tag (EST) analysis is also an important tool for identifying transcription units but is also subject to errors (Adams et al. 1991; Okubo et al. 1992; Weinstock et al. 1994; Adams et al. 1995; Hillier et al. 1996; Audic and Claverie 1997; Wolfsberg and Landsman 1997; Rubin et al. 2000). For instance, it is difficult to know if novel or rare ESTs represent genuine rare transcripts or artifacts arising from splicing intermediates, genomic contamination, or illegitimate transcription from intergenic regions. Consequently, we need multiple sources of evidence for accurate gene discovery and genome annotation. Microarrays derived from EST collections provide an important assay. For example, a novel EST showing evidence of intron/exon structure and a dynamic spatial or temporal microarray expression profile is quite likely to represent a genuine gene. Such strong evidence can confirm gene predictions, or add unrecognized genes to the Drosophila list. We therefore undertook combined EST, computational, and microarray analyses. We selected the Drosophila testis, a complex organ (for review, see Fuller 1993) in which systematic studies of gene expression have been modest (DiBenedetto et al. 1987).
It is generally recognized that the testis expresses a large set of genes (for reviews, see Poccia 1994; Eddy 1998). For example, many Drosophila male sterile mutations exist, and up to 40% of loci that mutate to give an overt phenotype are also required for male fertility (Lifschytz and Yakobovitz 1978; Castrillon et al. 1993; for review, see Fuller 1993). At the molecular level, components of the basal transcriptional machinery are nearly three orders of magnitude enriched in rodent spermatids, suggesting a need for high-level gene expression (Schmidt and Schibler 1995; Persengiev et al. 1996). However, genetic complexity and high-level transcription does not imply, a priori, that the testis is a good source of EST data. For example, two extreme Drosophila testis gene expression profiles would limit the value of testis ESTs. First, because the axomeme of the Drosophila sperm is unusually long (nearly the length of the adult), it is possible that the testis expresses very high levels of a few genes encoding cytoskeletal proteins. Such abundance would effectively mask the underlying transcriptional complexity. An example of this type of profile is human skeletal muscle, where just 10 EST species account for 45% of the EST population (Lanfranchi et al. 1996). Second, the peculiar nature of sperm development [such as lampbrush chromosomes and a high reliance on translational control mechanisms (for review, see Fuller 1993)] may require, result in, or permit deregulated transcription in the testis. This would lead to high-level transcription of many or all genes, and perhaps even intergenic regions. Although the later global transcription would be of high biological interest to those interested in spermatogenesis, the data obtained by the analysis of these ESTs would be of questionable value for genome annotation. A more interesting possibility, from a genomics standpoint, is that high-level and high-complexity gene expression is required for the complex remodeling of an undifferentiated stem cell into a highly specialized haploid sperm. If this is the case, the analysis of transcripts produced in the testis will be quite useful in the ongoing effort to identify Drosophila genes and gene structure.
RESULTS
The adult Drosophila testis bears all stages of spermatogenesis. Therefore, the transcripts in the testis comprise a relatively complete set of instructions for a complex developmental process (for review, see Fuller 1993). Stem cells and dividing cystocytes are located at the apical region. The next third of the testis contains the highly transcriptionally active spermatocytes. These cells derive from, and are approximately 40× the size of, the parent cystocytes. Thus, primary spermatocytes supply the bulk of the mRNA we have analyzed. Small clusters of meiotic cysts and round spermatids occupy the next zone. The remainder of the testis bears transcriptionally silent differentiating spermatids and mature sperm. Whereas the bulk of the testis is of germline origin, there are also small clusters of somatic cells that surround germline cysts, the somatic testis sheath, and the reproductive tract. We constructed a Drosophila testes cDNA library from dissected testis, and some fragments of the male reproductive tract (vas deferens, ejaculatory duct, and fragments of removed accessory glands).
The testis library is of high quality (Table 1). The unamplified library contained 8 × 10⁶ pfu indicating that the library samples a large pool of testis transcripts. Only 6% of inserts sequenced on both strands were chimeric (i.e., having inserts that map to two different regions of the genome that cannot be explained by typical intron/exon structure) and <1% of clones showed no inserts. We employed two measures to estimate the portion of full-length cDNAs in the library. Of the inserts derived from known genes, 67% showed the presence of the predicted AUG initiation codon, and 39% of the testis clones that match Berkeley Drosophila Genome Project (BDGP) ESTs (Rubin et al. 2000) showed more extended 5′ terminal sequences. Both of these indices suggest that high portions of the cDNAs are full length. For the bulk of the cDNAs, we sequenced random clones from the testis library by single pass 5′ sequencing (Table 2). The testis EST data consists of 3141 high-quality sequence reads that passed base calling, length, repeat, vector, and mitochondrial filters. Testis EST sequences can be accessed in the NCBI EST database, dbEST (Boguski et al. 1993).
Table 1.
Testis cDNA Library Characterization
| Testis cDNA library1 | |
| unamplified | 8 × 10⁶ pfu |
| amplified | 1.8 × 10¹² pfu |
| mass excised | 4.7 × 10¹³ cfu |
| Insert characterization2 | |
| size selection | 1–7 kb |
| inserts >1 kb | 74% (n = 173) |
| no insert | <<1% (n = 3,408) |
| chimeric | 5% (n = 86) |
| initiating AUG present3 | 67% (n = 139) |
| longer (5′) than BDGP EST2 | 39% (n = 385) |
Includes testis, vas deferens, and portions of ejaculatory apparatus and accessory glands.
n = number tested for indicated property.
Clones where: BLAST E-values versus nr or BDGP EST databases are <1E-20, orientation was plus/plus, and identity = 100%.
Table 2.
Testis EST Characterization
EST Complexity
If the testis expresses very high levels of only a few genes or was grossly deregulated, it would be unsuitable for an EST project. To determine if the overall form of the transcription profile was unusual, we compared testis EST profiles to those of other tissues. To accomplish this, we did BLASTN alignments of the complete testis collection against itself. Similarly, the ovary and head BDGP EST collections (Rubin et al. 2000) were self-aligned. Because our goal was to determine how many of the ESTs were novel and not to assign sequences to gene families, we set a BLAST cutoff E value of 1E-20. Empirical tests indicated that this cutoff is stringent enough to avoid calling a related gene a match, but not so stringent as to miss matches due to limited overlap (see Methods). The plot of frequency of sequence matches within all three libraries shows how frequently a given EST species occurs within each of the collections (Fig. 1). In the testis collection, we found that 42% of the EST reads aligned only with themselves, 30% overlapped with only 2–5 reads, and 7% of reads overlapped 20 or more times. These data suggest that most EST species in the library are represented at <0.03% and that only a few ESTs are represented at >0.6%. The maximum testis EST frequency was 1.2% (these ESTs correspond to a novel gene). The EST profiles were similar in all three tissues suggesting that all the mRNA populations from which these libraries were derived are complex with an extended abundance range. The absence of skewing to the right indicates that messages encoding a few terminal differentiation products do not compose the bulk of the mRNA population in any of these libraries. Because all of the libraries show a profile skewed to the left, the testis profile is representative and is unlikely to reflect grossly deregulated transcription in the testis. The testis and head libraries do show a larger proportion of singletons, which is consistent with anecdotal accounts of complex gene-expression patterns in brain and testis. Since the testis EST profile shows no unusual features, these data indicate that testis ESTs are useful tools for gene discovery and genome annotation.
Figure 1.

EST abundance profiles in testis ovary and head. Histograms of EST abundance frequencies. (A) Testis EST set, (B) BDGP ovary EST set, and (C) BDGP head EST set. The abundance of ESTs, measured as the frequency of BLASTN sequence matches within each EST set (x-axis), are plotted against the frequency of ESTs falling within each abundance class (y-axis).
To estimate the total number of different genes represented by the testis ESTs, we assembled the total set into a nonoverlapping set of 1100 singletons and 460 contigs (Table 3). Singletons plus contigs compose the 1560 computationally nonoverlapping testis EST collection. This is a computational analysis, so some of the nonoverlapping sequences will ultimately be shown to derive from the same gene. To estimate how many genes are represented by multiple nonoverlapping ESTs, we checked the ESTs that align with 17 known genes expressed in testis, and found two examples (12%) of genes (exuperantia and don juan) represented twice. Conversely, some contigs could be spurious due to overlapping genes on opposite strands or chimeric inserts, for example. Analysis of 89 contigs suggests that 8% of contigs derive from different genes. Because these two types of errors essentially cancel, the nonoverlapping set of 1560 provides a good approximation of gene representation in the testis EST collection.
Table 3.
Non-Overlapping Testis ESTs
| singletons | 11001 |
| contigs | 460 |
| average sequences/contig | 4.4 |
| average contig length | 735 |
| total non-overlapping sequences | 1560 |
| estimated redundancy2 | 12% (n = 17) |
| estimated false contigs3 | 8% (n = 89) |
The number of singletons derived from this PHRED/Consed analysis is not equal to the number of singletons derived from BLASTN analysis.
Where multiple contigs represent a single locus. Contigs representing genes known to be expressed in testis were sampled.
Where a single contig maps to two different locations. Contigs composed of three ESTs were sampled.
Alignments of Testis ESTs to Protein, EST, and Predicted Gene Databases
To determine how many previously known or predicted genes occurred in the testis ESTs and how many were novel, we did a series of BLAST alignments (Table 4). We aligned the total EST set and the nonoverlapping testis EST collection reads with the BDGP ESTs and the BDGP/Celera Genomics (CG) GadFly predicted genes (Adams et al. 2000; Rubin et al. 2000). Additionally, we aligned conceptual translation products with the GenBank nonredundant protein database (Benson et al. 1999).
Table 4.
Sequence Match Categories
| Sequence match category | Total testis ESTs | Non-overlapping testis ESTs | ||
|---|---|---|---|---|
| nr protein1 | BDGP EST2 | GadFly predicted3 | ||
| + | + | + | 7% (231) | 9% (139) |
| + | − | + | 2% (53) | 2% (30) |
| + | + | − | <<1% (1) | <<1% (1) |
| + | − | − | <<1% (1) | <<1% (1) |
| − | + | + | 46% (1443) | 41% (641) |
| − | − | + | 29% (909) | 33% (511) |
| − | + | − | 4% (139) | 3% (42) |
| − | − | − | 12% (364) | 13% (195) |
BLASTX sequence match (E-value <1E-20 and >90% sequence identity) with GenBank non-redundant protein.
BLASTN sequence match (E-value <1E-20) with BDGP EST.
BLASTN sequence match (E-value <1E-20) with BDGP/CG GadFly predicted gene.
Identification of ESTs matching genes with known functions is especially important as a method of library validation (Table 4). Of the nonoverlapping ESTs, 11% aligned with known genes based on protein encoding regions (excluding genome project data) and 9% were previously represented by an BDGP EST. Reassuringly, genes expressed specifically in the Drosophila testes such as, don juan, Janus, androcam, pelota, nebbish, sperm-specific tubulin, protamine, and a number of male-specific-transcript genes (Msts) were found (FlyBase 1999), indicating that expected testis-specific transcripts are represented in the EST set. Many of the above genes encode structural proteins. We were also interested in seeing if ESTs representing the full gamut of cellular functions were present, or if there was a strong skew towards sperm-specific structural-component encoding transcripts. EST-matching genes functioning in germ cell development (arrest, exuperantia, cappuccino, columbus, and gonadal), signaling (branchless, bunched, fizzy-related, and strawberry notch), chromosome mechanics and structure (centrosomin, boundary element associated factor, mei-218, and mei-S332), and transcription (caudal, cubitus interuptus, cap-n-collar, Dp, and cut) were also present (c.f., FlyBase 1999). Thus, the current testis EST collection, although certainly not a full representation of testis transcription, contains tags derived from genes encoding a wide mix of cellular functions, including information regulation. To systematically determine if the testis ESTs were well represented in other Drosophila EST collections (Rubin et al. 2000), or if there was a high portion of new representatives, we performed a BLASTN alignment. Only 53% of nonoverlapping testis ESTs aligned with the ∼80,000 EST BDGP collection (Table 4). Thus, the testis EST set is a valuable addition to the current stable of Drosophila cDNAs.
Many predicted genes in Drosophila are not confirmed by biological data (Adams et al. 2000). For this reason, an especially important class of testis ESTs are those that align with predicted genes, but not named genes or BDGP ESTs (Table 4). An impressive 33% of the nonoverlapping testis ESTs align with predicted genes in the GadFly database but fail to align with either previously known genes or ESTs. Thus, our data provides the first biological evidence for over 500 predicted genes. ESTs failing to match predicted genes are also important, as they could represent previously unrecognized genes. Somewhat surprisingly, only 84% of nonoverlapping testis ESTs matched predicted genes in the first version of the annotated Drosophila genome. Of the 706 nonoverlapping ESTs that fail to align with known genes or BDGP ESTs, only 511 (72%) match a predicted gene. If 90% of the nonoverlapping testis ESTs represent a gene, then over 200 additional genes (or minimally uncalled exons) are identified in this study. The testis ESTs contribute significant new data to validate and refine predicted genes, and perhaps for adding previously unrecognized genes to the Drosophila gene total.
Alignment of Testis, Ovary, and Head EST Collections
Genes are expressed at different levels in different tissues. There are two basic strategies for collecting as many transcription units as possible. One could sequence cDNAs from a very complex mix of tissues, such as whole adult, or from a very complex tissue, such as testis or brain, to a great depth. Alternatively, one could sequence more shallowly from as many cDNAs sources as possible. The advantage of the later method is that isolating a particular source tissue for an EST collection results in the enrichment for genes highly expressed in that tissue. To determine if the testis ESTs represent a particularly rich source, or if essentially all libraries are enriched for a subset of cDNAs, we compared the testis, BDGP head, and BDGP ovary EST collections inter se.
We performed BLAST alignments between three EST collections from testis, ovary, and head. We found that the high proportion of novel ESTs in the testis collection is not peculiar. In a three-way comparison of ESTs in the Drosophila testis, ovary, and head EST collections (Fig. 2), we found that a significant proportion of ESTs are represented in only one tissue regardless of source: 55% of testis EST are present only in the testis EST collection, 30% of ovary ESTs are present only in the ovary EST collection, and 60% of the head ESTs are present only in the head EST collection. At the other extreme, similar proportions of ESTs from each collection align with ESTs in all three collections: 8% of testis, 11% of ovary, and 8% of head ESTs are common. Interestingly, even those EST reads represented in the testis and in another EST collection tend to be highly overrepresented in the testis (Fig. 3). Indeed, only the ESTs represented in all three sets show a distribution pattern that is consistent with so-called “housekeeping” functions. Thus, it is quite likely that the analysis of more Drosophila tissues will substantially augment our picture of the transcribed regions of the genome.
Figure 2.

Three-way comparison of sequence matches between the testis, ovary, and head EST sets. All figure elements are color coded. 100% of testis (blue), ovary (red), and head (green) ESTs are within each color coded circle. The total number of ESTs in each collection is indicated. The color coded numbers show the percentage of ESTs from any of the three collections represented in the intersecting segments of the Venn diagram. For example, 60% of head ESTs are represented in only the head EST collection, 3% of head ESTs are represented in the head and testis EST collection, 8% of head ESTs are represented in all three EST collections, and 29% of head ESTs are represented in the head and ovary EST collections.
Figure 3.

Frequency scatter plots of testis ESTs also represented in other EST collections. Frequency that a given testis EST is represented in one library is plotted against the frequency that the same testis EST is represented in a second EST collection. (A) Testis frequency versus ovary frequency. (B) Testis frequency versus head frequency. (C) Ovary frequency versus head frequency.
Testis Expression Profile Analyzed by Microarrays
In terms of achieving full coverage of Drosophila transcription units, an important question is how many testis transcripts are so rare in most tissues that they could not be found easily by sequencing other cDNA libraries to a greater depth. The computational analysis of the testis ESTs, outlined above, suggested that many genes are preferentially expressed in testis, but the alarming lack of overlap between the various EST collections might also suggest that many sequences are being lost during library construction (c.f., Wang et al. 2000). Alternatively, the lack of overlap between testis and other EST collections might be due to underlying differences in mRNA profiles. We directly examined how testis gene expression differs from that in related tissues by microarray analysis. Because labeled testis cDNAs should preferentially hybridize to testis cDNAs on the array, we could not normalize to total counts. We therefore normalized against control spots on the filters (see Methods). To bias the results in favor of genes common to the two tissues, and thus against the hypothesis that lack of overlap between collections is biologically based, we selected ovary and gonadectomized flies as test samples. The testis is similar to the ovary because of the presence of a germline, a cell lineage distinguished from the soma by its potential to undergo meiosis and form gametes. The testis shares a common sexual identity with the male soma.
We first asked how many of the testis ESTs were derived from mRNAs enriched in the germline. To investigate the contribution of germline gene expression to the testis EST collection, we compared expression profiles in testes versus gonadectomized males, and ovaries versus gonadectomized females. When labeled cDNA from these tissues was hybridized to the arrays, a remarkable 89% of array elements showed greater than onefold stronger signal when probed with testis versus gonadectomized male cDNA. Fifty percent showed a signal that was greater than 1.6-fold stronger (Fig. 4). Whereas individual data points at greater than onefold overexpression could be due to chance (statistical data are presented in the next section), the population of data points clearly depart from a one-to-one relationship. Additionally, the distribution was not normal, but showed skewing toward high testis expression. These data suggest that most of the cDNAs in testis EST collection derive from genes overrepresented in the steady-state testis mRNA pool. If this pattern of gene expression revealed by the micorarray experiments reflects germline-preferential expression, then a similar pattern should be observed when arrays were probed with labeled ovary versus gonadectomized female cDNA. However, comparing ovary to gonadectomized female array intensities revealed essentially equivalent gene expression in the two tissues (and also validates the normalization protocol). The median difference was only 1.1-fold overexpression in ovary (Fig. 4). Thus, although the testis gene expression profile clearly differs radically from gonadectomized male, there is little enrichment for genes expressed non-sex-specifically in germ cells in the testis EST collection.
Figure 4.

DNA microarray analysis of gene expression in testis, ovaries, males, and females. Frequency histograms of hybridization fold intensity differences, from microarrays printed with testis cDNAs and hybridized with labeled cDNA from (A) testis versus male, (B) ovary versus gonadectomized female, (C) testis versus ovary, and (D) gonadectomized male versus gonadectomized female. The hybridization intensity difference (x-axis) is plotted against the frequency of microarray element falling within each class (y-axis). Where the tissue shown as the numerator resulted in stronger hybridization signal, the intensity difference has a positive value; where the tissue shown as the denominator resulted in a stronger hybridization signal, the intensity difference has a negative value. The broken line indicates where the 1:1 hybridization intensity (no difference) falls on the x-axis. The median intensity difference is given (arrow).
We then asked how many of the testis ESTs were derived from mRNAs enriched in males. To investigate how the cDNAs species in the testis EST collection might be determined by sexual identity, we compared testes versus ovaries, and gonadectomized males versus females. The microarray experiments indicate that the steady-state testis mRNA pool is as different from the ovary as it is from the bulk of the male soma. When probed with labeled testis cDNA versus ovary cDNA, 85% of the array elements showed a stronger signal and 50% showed greater than 1.5-fold overexpression in testis (Fig. 4). As was the case with testis versus male, these data suggest that the bulk of the cDNAs in the testis EST collection are derived from mRNAs that are highly enriched in the steady-state testis pool. In contrast, comparing gonadectomized males to gonadectomized females revealed intensity differences clustered tightly around a one-to-one relationship, with a median intensity difference of 1.0 (Fig. 4). Briefly, the testis expression profile does not correlate with either ovary expression, as would be expected for germline-specific functions, or with gonadectomized male, as would be expected for simple sexual dimorphisms. When probed with testis, 82% of the array targets were preferentially illuminated relative to both gonadectomized males and ovaries. These data unambiguously indicate that the Drosophila testis expresses a complex and surprisingly restricted profile of genes that is much more than the simple intersection of male/female and germline/soma dichotomies. Given that over 80% of testis cDNAs are overexpressed in testis, it is not surprising that 55% of only 3141 testis ESTs are missing from 29,120 ovary and head ESTs. In terms of gene discovery, the microarray data supports the suggestion that sequencing additional tissue-specific libraries is more efficient than sequencing existing high-quality libraries to greater depth.
Clustering and Computational Analysis of Statistically Significant Microarray Data Points
Microarray data also provides a good source of high-quality annotation information, as genomic regions that are transcribed in a developmentally regulated fashion are quite likely to be real genes. We were therefore interested in determining if genes that showed developmentally regulated expression in microarray experiments were more or less likely to be represented by novel ESTs or predicted genes. For example, if the majority of the 237 nonoverlapping testis EST that fail to align with predicted genes are derived from contaminating genomic DNA, or other artifacts, then none of these would be expected to hybridize well in DNA microarray experiments. We were therefore interested in parsing out only the most highly expressed genes.
To select individual genes for analysis, we performed a statistical test based on replicate microarray experiments to identify elements where p <0.05. We also imposed an arbitrary ratio limit of threefold to restrict the analysis to those genes that are likely to be most highly overexpressed in the testis (or other samples). In comparisons of testis to gonadectomized males, 3% of the array elements showed greater than threefold stronger signal at p <0.05 when probed with testis cDNA versus gonadectomized male cDNA (Fig. 5). Similarly, in comparisons of testis to ovary, 4% of array elements showed threefold greater signal, at p <0.05, when probed with testis versus ovary cDNA (Fig. 5). The reciprocal biases toward either male or ovarian expression were never over 1%. The array elements showing a threefold overexpression at p <0.05 in any experiment were selected for further study (Fig. 6).
Figure 5.

Statistically significant microarray intensity differences. Scatter plots of normalized microarray intensity values averaged from replicate experiments; the arbitrary scale is linear (see Methods). (A) Testis versus gonadectomized male, (B) ovary versus gonadectomized female, (C) testis versus ovary, and (D) gonadectomized male versus gonadectomized female. Individual data points (representing single cDNA microarray elements) that show statistically significant differences, P <0.05, and greater than a threefold intensity difference, are color coded red or green (corresponding to the color coded axis labels). The percentage of array targets satisfying this cutoff are given and are similarly color coded. Data points not satisfying these criteria are yellow.
Figure 6.

Summary of statistically significant microarray expression profiles (P <0.05, and threefold intensity difference). (A) Spotted cDNA clone name. (B) Microarray intensity differences from replicate comparisons (1, 2, 3, 4, and mean) of hybridizations with labeled cDNA from the indicated tissues. Tissues are color coded. For a given spotted cDNA, high relative hybridization with labeled “red” cDNA is indicated by red boxes, while high relative hybridization with labeled “green” cDNA is indicated by green boxes. Colorimetric scale is shown on the right. The P values for each spotted cDNA in each experimental series are indicated by blue color coded bars, with the scale shown on the right. The microarray cDNA clones are clustered into those showing testis (62), male (3), ovary (8), or female (1) preferential microarray expression profiles as indicated on the right. (C) A summary of sequence matches between ESTs from the respective microarray cDNAs and the indicated sequence databases. The black and white key is shown on the right (cutoffs are as follows: GenBank nr protein: BLASTX E-value <1E-20, and >90% sequence identity, BDGP ESTs and BDGP/CG predicted genes from the GadFly database: BLASTN E-value <1E-20).
If the individual microarray data points are accurate reflections of testis transcription, then it would be expected that clones showing the greatest microarray expression differences would include some genes with a previously known germline and/or testis function. Indeed, 24% of the selected ESTs represent genes identified in the pregenome literature (18% with sequence matches to the nr protein database [Fig. 6] and 7% with sequence matches to the nr nucleotide database [not shown]). Those in the testis-enriched group include: don juan, encoding a sperm tail specific protein of unknown function (Santel et al. 1997); male-specific transcript 87F (Kuhn et al. 1991); exuperantia, encoding a germline restricted RNA-binding protein required for fertility (Hazelrigg et al. 1990); janus-A and janus-B, which are coordinately regulated genes expressed specifically in the male germline (Yanicostas et al. 1989); prominin-like, encoding a protein found at the leading edges of cytoplasmic projections (Weigmann et al. 1997); and Dynein light chain 90F, encoding a molecular motor (Harrison et al. 1998). The don juan, male specific transcript 87F, and janus genes are expressed only in testis, clearly validating the microarray data. The known gene in the male-enriched group is male specific transcript 57D which encodes an accessory gland protein (Simmerl et al. 1995). This transcript is expected in the gonadectomized male samples and the testis samples, as fragments of the accessory glands were included in both. Known genes in the ovary-enriched group are also unsurprising. Two genes encoding ribosomal proteins were found (ribosomal proteins L32, and P1). Certainly, ribosomal protein gene expression is expected in all cells, but large numbers of ribosomal components are synthesized in the developing eggs, and down regulation of Ribosomal protein genes is known to cause defective egg formation (Qian et al. 1988). Briefly, the observed microarray expression profiles are consistent with the known functions of the above genes.
Microarray data is strong biological evidence that a particular cDNA is derived from a bona fide gene. Thus, genes showing clear patterns of differential expression in the microarray experiments are good tools for validating the rest of the testis EST collection. We therefore looked to see if microarray validated (Fig. 6) and total nonoverlapping ESTs (Table 4) matched similar frequencies of known, predicted, and novel genes. Of the set of elements chosen for analysis because of high hybridization differences, only 18% are from known genes (Fig. 6). This is essentially the same figure (11%) obtained when the entire set of nonoverlapping testis EST set was analyzed (Table 4). Similarly, of the cDNAs that show high and differential hybridization in the microarray experiments, 22% of the corresponding ESTs do not match a predicted gene, versus 16% for the entire nonoverlapping testis EST collection. The analysis of the ESTs derived from the most enriched testis mRNAs provides very strong, and thus far unique, evidence for 10 predicted genes. These data also provide strong evidence for 16 novel genes or novel transcription forms. Because of the similar frequencies of named, predicted, and novel genes seen when total nonoverlapping testis ESTs and microarray verified ESTs are analyzed computationally, confidence in the analysis of the entire set is raised. Thus, these computational and microarray data provide strong biological evidence for over 500 predicted, and over 200 new, genes or transcript forms.
Mapping Novel Genes
An abundantly expressed gene could fail to match a predicted gene for a number of reasons. Given the current state of gene prediction programs, trivial reasons include missed exons due to promoter, splice, and poly-A variants. A nontrivial reason is a completely missed transcription unit. A definitive resolution of why a testis EST fails to align with a predicted gene is a difficult task. We begin this process by examining ESTs identified in the microarray experiments for indication of exon/intron structure, and for arrangement relative to known or predicted genes. To do this, we examined the sequence alignment of testis ESTs, GenBank nonredundant, BDGP ESTs, and BDGP/CG GadFly predicted genes, to the genomic DNA sequence surrounding novel testis EST reads (Fig. 7; Benson et al. 1999; Adams et al. 2000; Rubin et al. 2000). The 15 genes with the strongest biological support were examined (Fig. 7): 67% show no obvious connection to named or predicted genes, 7% are clearly due to additional exons of predicted genes, and 27% are ambiguous.
Figure 7.
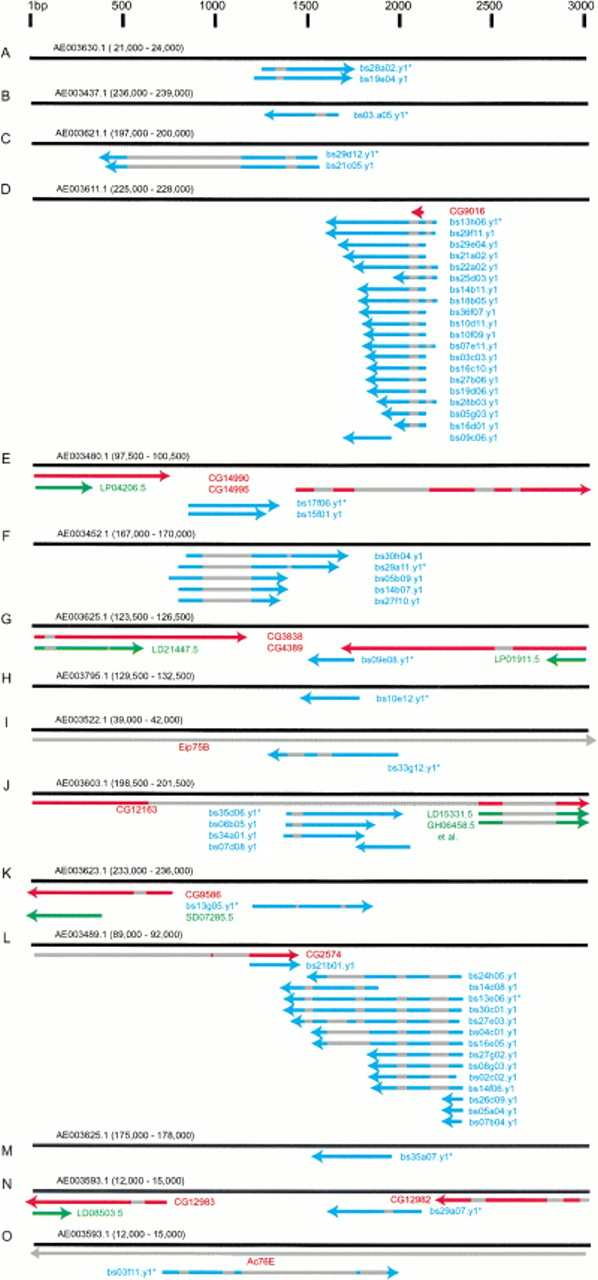
Genomic regions flanking novel, microarray verified, testis transcription units. (A-O) Diagram of sequence alignment between the indicated 3-kb genomic sequences (black bars, coordinates in parentheses, scale at top) and testis ESTs (blue bars), BDGP ESTs (green bars) and known or predicted genes (red bars). The orientation of genes and ESTs are indicated (arrowheads), as are interrupted sequence alignments (gray bars), and the representative clone printed on the microarray (*).
The organization of 5′ testis EST reads are consistent with typical gene structures. In seven cases where multiple overlapping EST reads are mapped, the sequences show good 5′ alignment (Fig. 7A,C,D,E,F,J,L). This suggests the presence of a nearby promoter in the genomic sequence, and that the EST reads are from full-length, or nearly full-length, cDNAs. Similarly, it does not appear that isolation of incompletely processed pre-mRNAs during library construction can account for the common failure to align testis ESTs with known or predicted genes. Of the mapped testis ESTs, 73% show interrupted alignment with genomic sequence, suggesting that they were derived from spliced mRNAs, not pre-mRNAs (Fig. 7A–D,F,I–L,N,O). Indeed, the gene represented by bs13e06 has 14 matching testis ESTs with multiple aligned exons, suggesting at least 3 mRNA splice variants (Fig. 7L). We found only one case of a failed alignment that is definitively due to exon structure differences between ESTs and predicted genes. The gene defined by bs13h06 was represented by 20 testis ESTs, which match a predicted gene over a single small region (Fig. 7D). This EST contig failed to match this short predicted gene in the BLAST search since the small length of overlap did not meet the E-value cutoff. In this case, the gene prediction program identified one of at least three exons.
Four transcription units deduced from testis EST sequence are in the same orientation and in the vicinity of either predicted genes or BDGP ESTs. It is difficult to determine if these represent extensions of predicted genes (especially in the absence of full-length testis or BDGP EST sequence), or if the region is particularly gene dense. The transcription units deduced from bs17f06 and bs09e08 are on the same strand and within approximately 150 bp of a predicted gene (Fig. 7E,G). The bs35d06 EST suggests a gene transcribed in the same orientation as, and within an intron of, CG12163, and thus may define a new exon (Fig. 7J). The transcription unit represented by bs35d06 is also in proximity to head and ovary ESTs; however, in the microarray experiments, bs35d06 hybridized two- to threefold better to labeled testis cDNA than to labeled ovary, male, or female cDNAs. This is an argument against joining bs35d06 with the head and ovary ESTs in the region.
Three transcription units within introns are likely. It is known that Drosophila has a surprisingly large number of genes within genes, usually on the opposite strand (Ashburner et al. 1999), and that these are problematic for gene predicting algorithms (Reese et al. 2000a,b). The transcription units defined by bs33g12, and bs03f11 EST reads are within introns of known genes, but in opposite orientation, suggesting the presence of genes within genes (Fig. 7I,O). The transcription unit defined by bs35d06 is also within a predicted intron, but in the same orientation (Fig. 7J). Two more transcription units, represented by bs13g05 and bs13e06, are within approximately 400 bp of predicted genes (with confirming ESTs) but in the opposite orientation, and hence are likely to define different genes (Fig. 7K,L). Lastly, five transcription units, represented by bs28a02, bs03a05, bs29d12, bs29a11, and bs35a07, do not map in close proximity to known genes (Fig. 7A–C,F,M). Although we cannot eliminate the possibility that these particular ESTs are derived from outlying exons, it seems unlikely that this will be the general case. In summary, of the novel testis cDNAs showing the greatest microarray expression differences, all define previously unknown exons, one matches and extends a predicted gene, four may possibly extend predicted genes, and ten are probably new genes.
DISCUSSION
Testis Gene Expression
There are many anecdotal reports of genes expressed in a specific and restricted pattern in a tissue of interest and in the testis. The biological relevance of the testis expression is often questioned. The computational and microarray data presented in this study support the idea that the testis expresses a complex set of transcripts. However, the profiles are not consistent with deregulated or random transcription, as EST frequencies and microarray hybridization intensities showed an extended dynamic range. The opposite concern, that the testis expresses abundant terminal differentiation products at levels high enough to swamp out more moderately expressed genes, was not borne out. There are many more rare EST species than common ones. Importantly, computational comparisons of testis, head, and ovary EST collections suggest that the dynamic range of testis expression is similar to other complex body parts.
Whereas overall profiles of gene expression were similar in testis and other tissues (many rare messages and a few common ones), individual genes showed tissue-specific differences. Most strikingly, the gonads of the sexes are analogous organs, but surprisingly the microarray data indicate that the testis expression profile is nearly as different from ovary as it is from the bulk of the soma. Furthermore, microarray experiments show that the majority of the nonoverlapping testis ESTs represent mRNAs with significantly higher abundance in testis compared to other tissues. Perhaps, the testis requires the expression of this impressive battery of genes for the highly complex process required to generate sperm, and not simply because they do no harm (reviewed by Fuller 1993).
Sequencing More cDNA Libraries
One of the clear conclusions from nearly 20 years of studying development at the molecular level is that most genes are utilized in multiple developmental events or pathways. Consequently, one might expect that many or most of the genes expressed in an organism could be sampled by screening only a few complex tissues such as brain or testis. However, it is also the case that relatively few genes are expressed at similar levels in all tissues. This suggests that temporally or spatially restricted samples provide a significant enrichment for genes that are expressed at high level in that tissue at that time, while being rare at most points during the life of the organism.
In this study, we found that only 53% of testis ESTs overlap with the much larger set of 80,000 ESTs derived from other Drosophila sources (Rubin et al. 2000). A priori this could indicate that testis gene expression is particularly divergent from other probed tissues (ovary, embryo, head, larval, pupal, tissue culture cells, and head). Certainly, the computational and microarray data argues strongly for a highly specialized gene expression profile in the testis. However, this may, or may not be a unique feature of the testis. The computational analysis of EST frequencies within and between testis, ovary, and head ESTs suggests that each library brings a surprisingly restricted set of cDNAs into the EST stable. Whereas the ovary and head enrichments have not been verified by microarray experiments, the testis EST microarray experiments clearly indicate that many genes are highly expressed in testis and lowly expressed elsewhere. Thus, even the modest sequencing depth we employed in this study was sufficient to isolate multiple copies of many previously unknown cDNAs. If this holds for other Drosophila tissues, then shallow sequencing depth in a large number of tissue-specific libraries might maximize gene discovery in Drosophila. Indeed, low overlap between cDNA libraries may be general. In a 292,878 human EST data set, 42% of the nonoverlapping ESTs derived from a single organ or tissue, and only 3% were ubiquitous (Adams et al. 1995).
How Many Genes?
The total gene number in Drosophila has long been a matter of intense speculation (e.g., Muller 1928; Lefevre and Watkins 1986), and is still far from settled (Ashburner et al. 1999; Asburner 2000; Adams et al. 2000). Two approaches to gene-finding using the current Drosophila genome sequence data predicted between 17,464 and 13,189 genes (Adams et al. 2000). Guided by gene density estimates from the comprehensive analysis of the Adh region (Ashburner et al. 1999), Adams et al. made a conservative estimate of 13,601 genes. However, in light of the gene density in the annotated genome sequence, Ashburner conceded that their analysis of the Adh region may have been too conservative, which in turn affects the estimate by Adams et al. (Adams et al. 2000; Ashburner et al. 2000). Our study of transcription in the testis clearly indicates the existence of a significant class of undetected genes in the current genome release. If cDNAs from other Drosophila tissues show similar tendencies, then sequencing additional cDNA libraries will significantly augment our understanding of the Drosophila transcriptosome and boost the Drosophila gene number well beyond 13,601.
METHODS
Flies and Dissections
All flies were from the y w67c1 strain and were grown at 25°C. Flies used for library construction were 1–5 d posteclosion. Flies used for microarray experiments were 12–24 h posteclosion. All flies were anesthetized on CO2 and dissected in 1 × PBS. Following each dissection, the tissues were transferred to a microcentrifuge tube on dry ice for snap freezing. Testis samples included testis, vas deferens, about half of the anterior ejaculatory duct, and fragments of the removed male accessory glands. Ovary samples include ovary, lateral oviduct, and most of the common oviduct. Gonadectomized samples include all remaining adult tissues.
Testis Library
Total RNA was extracted from flash frozen tissues (Trizol; Life Technologies) and Poly(A)+ RNA (2 μg) was selected using Oligotex (Qiagen). cDNA synthesis was according to the manufacturer's instructions (Stratagene). Briefly, RNA was poly(dT) primed and cDNA fractions between 1 and 6 kb were pooled for cloning. cDNA was directionally cloned with 5′ EcoRI and 3′ XhoI linkers in the Uni-Zap XR vector (Stratagene). The unamplified library contained 8 × 10⁶ pfu. The library was amplified once (1 × 10⁶ pfu yielded 1.75 × 10¹² pfu) and an aliquot was mass excised (1 × 10⁸ pfu yielded 4.7 × 10⁹ cfu) to give clones in the pBluescript SK- plasmid vector.
Sequencing and Sequence Analysis
Random clones (3408) were 5′-end sequenced (PE/Applied Biosystems M13RP1 reverse primer and dye terminator). Chromatogram traces were evaluated using PHRED (Ewing and Green 1998; Ewing et al. 1998) yielding 3228 sequences, trimmed of vector using CrossMatch (P. Green, http://bozeman.mbt.washington.edu/phrap.docs/phrap.html), yielding 3180 sequences. Reads were also screened for contaminating Escherichia coli and mitochondrial sequences using BLASTN (Altschul et al. 1997), yielding 3179 and 3141 sequences, respectively. All sequences were checked for repetitive elements using RepeatMasker (A.F.A. Smith and P. Green, unpubl.; c.f. RepeatMasker http://ftp.genome.washington.edu/RM/RepeatMasker.html), but were found to be essentially free of known Drosophila repeats. The 3141 high-quality sequences had an average read of 449 bp and a cumulative length of 1.41 Mbp. Sequences were submitted to NCBI and have accession nos. AI944400–AI947263. Clones will soon be available from the UK Human Genome Mapping Project Resource Centre (http://www.hgmp.mrc.ac.uk/).
Computational Analysis
Batch sequence alignments were performed on a computer workstation (Sun Microsystems) using BLAST (Altschul et al. 1997). For all BLASTN work the parameters were: E-value <1E-20, λ = 1.37, K = 0.711, H = 1.31, 1–3 matrix, gap penalty = 5, gap extension = 2. For all BLASTX work, the parameters were E-value <1E-6, λ = 0.27, K = 0.047, H = 0.23, BLOSUM62 matrix, gap penalty = 11, gap extension = 1. Drosophila sequences matches where the E-value was <1E-20 were considered to be derived from the same gene. The 1E-20 cutoff was chosen to approximate perfect matches between sequences from the same gene for empirical reasons. Ideally, a BLAST output where a query sequence is known to be present in a large database only once should give a single match. In tests where we aligned ESTs to the finished Drosophila genomic scaffolds, there were relatively few ESTs that matched multiple segments. For example, 6990 ESTs were aligned to the genomic scaffold at 1E-20 and returned 1.04 matches per EST. The few false–positives are likely due to gene family members. Similarly, a BLAST alignment of a sequence against itself should always result in a match. For example, in a test where 1526 testis ESTs were aligned against themselves, there were only 10, or 0.6%, that failed to self-align at 1E-20 (failed self-alignment is due to the filtering of low-complexity sequences that is required to generate valid output), suggesting that this cutoff also minimizes false negatives. Nonredundant database sequence matches of <1E-6 for the nonoverlapping testis ESTs are reported in the Gene Expression Omnibus (GEO, http://www.ncbi.nlm.nih.gov/geo/; see the section on Micorarray Data Handling, below).
The GenBank nonredundant protein database (Benson et al. 1999) was downloaded from the NCBI web site (http://www.ncbi.nlm.nih.gov/Ftp/index.html). Sequence databases of nontestis Drosophila ESTs (Rubin et al. 2000), and BDGP/CG predicted genes (Adams et al. 2000), were downloaded from the BDGP web site (http://www.fruitfly.org/sequence/download.html). The GM, GH, and HL subsets of the BDGP ESTs were parsed out from the BDGP EST data set. To identify nonoverlapping clones for the microarray, the 3141 high-quality sequences were assembled into contigs using PHRAP and Consed (Gordon et al. 1998; P. Green, http://bozeman.mbt.washington.edu/phrap.docs/phrap.html). This yielded 460 contigs. Average contig length was 735 bp and was composed of 4.4 EST reads.
Array Printing
The array was assembled using 1681 testes ESTs, representing 1527 nonoverlapping EST sequences and 144 anonymous clones. An aliquot of the same DNA preparation used in the sequencing reactions, diluted 2/50 in TE, provided material for the PCRs. Inserts were PCR amplified (1 × PCR buffer [Life Technologies], 1.5 mM MgCl2, 0.2 mM dNTPs, 1 μM T7 22-mer primer, 1 μM T3 20-mer primer, 2 μL of Plasmid DNA dilution [approximately 10 ng], 0.035 U/μL recombinant Taq DNA polymerase [Life Technologies], in a volume of 100 μL, cycled 94°C 2 min, 30 × [94°C 0.5 min, 55°C 0.5 min, 2.5 min 72°C], 10 min 72°C in a PTC-225 DNA Engine Tetrad [MJ Research]), and successful amplification was confirmed by agarose gel electrophoresis. Samples of approximately 5 nl of 250 μ /mL DNA, in 0.1N NaOH were printed in 300 μm spots in subarrays of 12 × 12 clones at 665 μm spacing on Supercharge nytran membranes (Schleicher & Schuell) using a GMS 417 arrayer (Genetic Microsystems). Subarrays were printed in duplicate. Printing was validated by hybridization of one array with the short vector sequence common to all amplicons (pBluescript SK, 626–791 bp).
Labeling and Hybridization
Total RNA was extracted from flash frozen tissues (Trizol; Life Technologies) and was reverse transcribed [20 μg total RNA, 0.025 μg/μL oligo d(T)12–18, 1 x 1st strand buffer (Life Technologies), 10 mM DTT, 500 μM dATP, dGTP, dTTP, 0.5 μ:M [33P]-dCTP [2.5 Ci/μmol; NEN Life Sciences Products], 1 U/μL RNaseOUT (Life Technologies), 10 U/μL SuperScript II reverse transcriptase (Life Technologies), in a total volume of 40 μL for 35 min 42° C, followed by an additional 35 min incubation with the addition of 400 U SuperScript II reverse transcriptase]. RNA was hydrolyzed (45 mM EDTA, 18 mM NaOH, 1 h at 65° C), and unincorporated nucleotides removed on Biospin 30 columns (BioRad). Prehybridization was in 1 x Microhyb (Research Genetics), 10% dextran sulphate, 0.25 mg/mL sonicated salmon sperm DNA, 0.2 mg/mL polyA RNA at 65° C for 4 h. Heat denatured probe was added to the prehybridization solution and hybridized for 16–18 h at 65°C. All prehybridization and hybridization steps were performed in 50 mL centrifuge tubes (Falcon) in roller bottles (Hybaid). Filters were washed twice for 10 min at 25°C, for 15 min at 65°C (2 x SSC, 0.1% SDS), for 20 min at 65°C (2 x SSC, 0.1% SDS). Hybridized microarrays were exposed and quantitated as previously described (Whitney et al. 1999).
Microarray Data Accession
Microarray data can be found in the NCBI Gene Expression Omnibus, GEO under accession nos. GPL5 and GSM3–GSM10 (A. Lash, R. Edgar, M. Domrachev, V. Soussov, and J. Ostell, http://www.ncbi.nlm.nih.gov/geo/). Briefly, version 1.0 of the testis platform is organized into 12 subarrays printed in duplicate. Each array element is linked to a clone list, sequence accession numbers, and BLAST output definition lines. Two quality control measures are also given. The first is a binary score for successful PCR. The second, is raw intensity data from a hybridization to the primers used to amplify the inserts. Assuming that all array element hybridize similarly, this is a relative measurement of how many molecules were spotted at each array element. Data from individual experiments is linked to the platform. Raw intensity values and background subtracted and normalized data are presented.
Microarray Data Correction
Background and normalization correction places the lowest intensity elements at the origin and the highest intensity elements, showing low experiment-to-experiment variance, at one. Background correction was accomplished by taking the average intensity of two blank positions in each of the 24 12 × 12 element subarrays. Normalization was to control spots modeled from the raw intensity values. This normalization protocol is similar to “spiking” type controls in that there are control spots, but uses an empirically defined set of spots. Because spiking RNA is exogenous, one cannot be certain that the control and experimental RNA are of identical quality. Twenty-five elements from each quadrant of the array were selected based on low variance over all the experiments. The average intensity value for these control elements in each quadrant was calculated. The first hybridization with labeled testis cDNA to the first replicate set of elements in the first quadrant of the array was set as the standard against which the remaining data sets were normalized. Thus, where Vx is the; corrected value for any given point x, S is the raw hybridization intensity, B is the average local background, NT is the average normalization element value in quadrant one of testis experiment one, BT is the average local background in quadrant one of testis experiment one, Nx is the average normalization value for quadrant bearing point x, and Bx is the average local background for subarray bearing point x, the corrected value was determined according to the following formula:
 |
Thus for each data set the average background and the average control element intensities were set equal to those in the testis. The arbitrary value 39,542 was added to minimize the occurence of negative values.
Statistical Treatment of Microarray Data
All experiments were done in quadruplicate. Sample duplicate subarrays are shown in Figure 8. The variability in the system occurred mostly between replicate experiments (fluctuations in dissection, RNA isolation, radiolabeling efficiency, r2 = 0.68 in the typical example shown). There was very little variability between replicate spots hybridized with the same labeled cDNA (r2 = 0.97 in the typical example shown). We therefore averaged duplicate spot intensity values after normalization, then used a statistical test to distinguish significant array intensity differences between tissues. For each pair-wise tissue comparison, P values were calculated for each clone using the two-sided t test for differences in means. To satisfy a 0.05 significance cutoff, the difference in mean intensity values must equal or exceed 4.3 × the estimated standard error (Claverie 1999).
Figure 8.
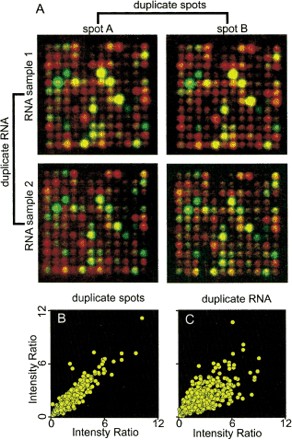
Reproducibility of microarray data. Data from duplicate experiments with radiolabeled cDNA from testis and gonadectomized male. (A) Merged, pseudoclored images of the same subarray from microarrays hybridized with radiolabeled cDNA from testis (red channel) and gonadectomized male (green channel). Duplicate spots are shown in the columns headed spot A and spot B. Results from duplicate experiments (independent tissue, RNA, reverse transcription, and hybridization) are shown in the rows labeled RNA sample 1 and RNA sample 2. (B, C) Scatter plots of hybridization intensity ratios. (B) Scatter plot of hybridization intensity ratios for duplicate spots (r 2= 0.97). (C) Scatter plot of hybridization intensity for duplicate RNA samples (values from duplicate spots were averaged, r2 = 0.68).
Acknowledgments
We thank members of NISC staff and Jeff Touchman for sequencing; William Wood for help with microarray production; Virginia Boulais for growing flies; and Jay Miller and Carl Baker for Phosphoimager use.
The publication costs of this article were defrayed in part by payment of page charges. This article must therefore be hereby marked “advertisement” in accordance with 18 USC section 1734 solely to indicate this fact.
Footnotes
E-MAIL oliver@helix.nih.gov; FAX (301) 496-5239.
Article and publication are at www.genome.org/cgi/doi/10.1101/gr.159800.
REFERENCES
- Adams MD, Celniker SE, Holt RA, Evans CA, Gocayne JD, Amanatides PG, Scherer SE, Li PW, Hoskins RA, Galle RF, et al. The genome sequence of Drosophila melanogaster. Science. 2000;287:2185–2195. doi: 10.1126/science.287.5461.2185. [DOI] [PubMed] [Google Scholar]
- Adams MD, Kelley JM, Gocayne JD, Dubnick M, Polymeropoulos MH, Xiao H, Merril CR, Wu A, Olde B, Moreno RF, et al. Complementary DNA sequencing: Expressed sequence tags and human genome project. Science. 1991;252:1651–1656. doi: 10.1126/science.2047873. [DOI] [PubMed] [Google Scholar]
- Adams MD, Kerlavage AR, Fleischmann RD, Fuldner RA, Bult CJ, Lee NH, Kirkness EF, Weinstock KG, Gocayne JD, White O, et al. Initial assessment of human gene diversity and expression patterns based upon 83 million nucleotides of cDNA sequence. Nature. 1995;377:3–174. [PubMed] [Google Scholar]
- Altschul SF, Madden TL, Schaffer AA, Zhang J, Zhang Z, Miller W, Lipman DJ. Gapped BLAST and PSI-BLAST: A new generation of protein database search programs. Nucleic Acids Res. 1997;25:3389–3402. doi: 10.1093/nar/25.17.3389. [DOI] [PMC free article] [PubMed] [Google Scholar]
- Ashburner M. A biologist's view of the Drosophila genome annotation assessment project. Genome Res. 2000;10:391–393. doi: 10.1101/gr.10.4.391. [DOI] [PubMed] [Google Scholar]
- Ashburner M, Misra S, Roote J, Lewis SE, Blazej R, Davis T, Doyle C, Galle R, George R, Harris N, et al. An exploration of the sequence of a 2.9-Mb region of the genome of Drosophila melanogaster: The Adh region. Genetics. 1999;153:179–219. doi: 10.1093/genetics/153.1.179. [DOI] [PMC free article] [PubMed] [Google Scholar]
- Audic S, Claverie JM. The significance of digital gene expression profiles. Genome Res. 1997;7:986–995. doi: 10.1101/gr.7.10.986. [DOI] [PubMed] [Google Scholar]
- Benson DA, Boguski MS, Lipman DJ, Ostell J, Ouellette BF, Rapp BA, Wheeler DL. GenBank. Nucleic Acids Res. 1999;27:12–17. doi: 10.1093/nar/27.1.12. [DOI] [PMC free article] [PubMed] [Google Scholar]
- Birney E, Durbin R. Using GeneWise in the Drosophila annotation experiment. Genome Res. 2000;10:547–548. doi: 10.1101/gr.10.4.547. [DOI] [PMC free article] [PubMed] [Google Scholar]
- Boguski MS, Lowe TM, Tolstoshev CM. dbEST—Database for “expressed sequence tags”. Nat Genet. 1993;4:332–333. doi: 10.1038/ng0893-332. [DOI] [PubMed] [Google Scholar]
- Castrillon DH, Gonczy P, Alexander S, Rawson R, Eberhart CG, Viswanathan S, DiNardo S, Wasserman SA. Toward a molecular genetic analysis of spermatogenesis in Drosophila melanogaster: Characterization of male-sterile mutants generated by single P element mutagenesis. Genetics. 1993;135:489–505. doi: 10.1093/genetics/135.2.489. [DOI] [PMC free article] [PubMed] [Google Scholar]
- Claverie JM. Computational methods for the identification of differential and coordinated gene expression. Hum Mol Genet. 1999;8:1821–1832. doi: 10.1093/hmg/8.10.1821. [DOI] [PubMed] [Google Scholar]
- DiBenedetto AJ, Lakich DM, Kruger WD, Belote JM, Baker BS, Wolfner MF. Sequences expressed sex-specifically in Drosophila melanogaster adults. Dev Biol. 1987;119:242–251. doi: 10.1016/0012-1606(87)90225-9. [DOI] [PubMed] [Google Scholar]
- Eddy EM. Regulation of gene expression during spermatogenesis. Semin Cell Dev Biol. 1998;9:451–457. doi: 10.1006/scdb.1998.0201. [DOI] [PubMed] [Google Scholar]
- Ewing B, Green P. Base-calling of automated sequencer traces using PHRED. II. Error probabilities. Genome Res. 1998;8:186–194. [PubMed] [Google Scholar]
- Ewing B, Hillier L, Wendl MC, Green P. Base-calling of automated sequencer traces using PHRED. I. Accuracy assessment. Genome Res. 1998;8:175–185. doi: 10.1101/gr.8.3.175. [DOI] [PubMed] [Google Scholar]
- FlyBase. The FlyBase database of the Drosophila Genome Projects and community literature. Nucleic Acids Res. 1999;27:85–88. doi: 10.1093/nar/27.1.85. [DOI] [PMC free article] [PubMed] [Google Scholar]
- Fuller MT. Spermatogenesis. In: Bate M, Martinez-Arias A, editors. The development of Drosophila melanogaster. Cold Spring Harbor, NY: Cold Spring Harbor Laboratory Press; 1993. pp. 1–70. [Google Scholar]
- Gaasterland T, Sczyrba A, Thomas E, Aytekin-Kurban G, Gordon P, Sensen CW. MAGPIE/EGRET annotation of the 2.9-Mb Drosophila melanogaster Adh region. Genome Res. 2000;10:502–510. doi: 10.1101/gr.10.4.502. [DOI] [PMC free article] [PubMed] [Google Scholar]
- Gordon D, Abajian C, Green P. Consed: A graphical tool for sequence finishing. Genome Res. 1998;8:195–202. doi: 10.1101/gr.8.3.195. [DOI] [PubMed] [Google Scholar]
- Harrison A, Olds-Clarke P, King SM. Identification of the t complex-encoded cytoplasmic dynein light chain tctex1 in inner arm I1 supports the involvement of flagellar dyneins in meiotic drive. J Cell Biol. 1998;140:1137–1147. doi: 10.1083/jcb.140.5.1137. [DOI] [PMC free article] [PubMed] [Google Scholar]
- Hazelrigg T, Watkins WS, Marcey D, Tu C, Karow M, Lin XR. The exuperantia gene is required for Drosophila spermatogenesis as well as anteroposterior polarity of the developing oocyte, and encodes overlapping sex-specific transcripts. Genetics. 1990;126:607–617. doi: 10.1093/genetics/126.3.607. [DOI] [PMC free article] [PubMed] [Google Scholar]
- Henikoff JG, Henikoff S. Drosophila genomic sequence annotation using the BLOCKS+ database. Genome Res. 2000;10:543–546. doi: 10.1101/gr.10.4.543. [DOI] [PMC free article] [PubMed] [Google Scholar]
- Hillier LD, Lennon G, Becker M, Bonaldo MF, Chiapelli B, Chissoe S, Dietrich N, DuBuque T, Favello A, Gish W, et al. Generation and analysis of 280,000 human expressed sequence tags. Genome Res. 1996;6:807–828. doi: 10.1101/gr.6.9.807. [DOI] [PubMed] [Google Scholar]
- Krogh A. Using database matches with HMMMGene for automated gene detection in Drosophila. Genome Res. 2000;10:523–528. doi: 10.1101/gr.10.4.523. [DOI] [PMC free article] [PubMed] [Google Scholar]
- Kuhn R, Kuhn C, Borsch D, Glatzer KH, Schafer U, Schafer M. A cluster of four genes selectively expressed in the male germ line of Drosophila melanogaster. Mech Dev. 1991;35:143–151. doi: 10.1016/0925-4773(91)90064-d. [DOI] [PubMed] [Google Scholar]
- Lanfranchi G, Muraro T, Caldara F, Pacchioni B, Pallavicini A, Pandolfo D, Toppo S, Trevisan S, Scarso S, Valle G. Identification of 4370 expressed sequence tags from a 3′-end-specific cDNA library of human skeletal muscle by DNA sequencing and filter hybridization. Genome Res. 1996;6:35–42. doi: 10.1101/gr.6.1.35. [DOI] [PubMed] [Google Scholar]
- Lefevre G, Watkins W. The question of the total gene number in Drosophila melanogaster. Genetics. 1986;113:869–895. doi: 10.1093/genetics/113.4.869. [DOI] [PMC free article] [PubMed] [Google Scholar]
- Lifschytz E, Yakobovitz N. The role of X-linked lethal and viable male-sterile mutations in male gametogenesis of Drosophila melanogaster: genetic analysis. Mol Gen Genet. 1978;161:275–284. doi: 10.1007/BF00331001. [DOI] [PubMed] [Google Scholar]
- Muller HJ. The gene as the basis of life. Proc 4th Intl Congr Plant Sci [Ithaca, NY, 1926] 1928;1:897–921. [Google Scholar]
- Okubo K, Hori N, Matoba R, Niiyama T, Fukushima A, Kojima Y, Matsubara K. Large scale cDNA sequencing for analysis of quantitative and qualitative aspects of gene expression. Nat Genet. 1992;2:173–179. doi: 10.1038/ng1192-173. [DOI] [PubMed] [Google Scholar]
- Parra G, Blanco E, Guigo R. GeneID in Drosophila. Genome Res. 2000;10:511–515. doi: 10.1101/gr.10.4.511. [DOI] [PMC free article] [PubMed] [Google Scholar]
- Persengiev SP, Robert S, Kilpatrick DL. Transcription of the TATA binding protein gene is highly up-regulated during spermatogenesis. Mol Endocrinol. 1996;10:742–747. doi: 10.1210/mend.10.6.8776734. [DOI] [PubMed] [Google Scholar]
- Poccia D. Molecular aspects of spermatogenesis. Austin, TX: R.G. Landes Compay; 1994. [Google Scholar]
- Qian S, Hongo S, Jacobs-Lorena M. Antisense ribosomal protein gene expression specifically disrupts oogenesis in Drosophila melanogaster. Proc Natl Acad Sci . 1988;85:9601–9605. doi: 10.1073/pnas.85.24.9601. [DOI] [PMC free article] [PubMed] [Google Scholar]
- Reese MG, Hartzell G, Harris NL, Ohler U, Abril JF, Lewis SE. Genome annotation assessment in Drosophila melanogaster. Genome Res. 2000a;10:483–501. doi: 10.1101/gr.10.4.483. [DOI] [PMC free article] [PubMed] [Google Scholar]
- Reese MG, Kulp D, Tammana H, Haussler D. Genie —Gene finding in Drosophila melanogaster. Genome Res. 2000b;10:529–538. doi: 10.1101/gr.10.4.529. [DOI] [PMC free article] [PubMed] [Google Scholar]
- Rubin GM, Hong L, Brokstein P, Evans-Holm M, Frise E, Stapleton M, Harvey DA. A Drosophila complementary DNA resource. Science. 2000;287:2222–2224. doi: 10.1126/science.287.5461.2222. [DOI] [PubMed] [Google Scholar]
- Salamov AA, Solovyev VV. Ab initio gene finding in Drosophila genomic DNA. Genome Res. 2000;10:516–522. doi: 10.1101/gr.10.4.516. [DOI] [PMC free article] [PubMed] [Google Scholar]
- Santel A, Winhauer T, Blumer N, Renkawitz-Pohl R. The Drosophila don juan (dj) gene encodes a novel sperm specific protein component characterized by an unusual domain of a repetitive amino acid motif. Mech Dev. 1997;64:19–30. doi: 10.1016/s0925-4773(97)00031-2. [DOI] [PubMed] [Google Scholar]
- Schmidt EE, Schibler U. High accumulation of components of the RNA polymerase II transcription machinery in rodent spermatids. Development. 1995;121:2373–2383. doi: 10.1242/dev.121.8.2373. [DOI] [PubMed] [Google Scholar]
- Simmerl E, Schafer M, Schafer U. Structure and regulation of a gene cluster for male accessory gland transcripts in Drosophila melanogaster. Insect Biochem Mol Biol. 1995;25:127–137. doi: 10.1016/0965-1748(94)00034-f. [DOI] [PubMed] [Google Scholar]
- Wang S M, Fears S C, Zhang L, Chen J J, Rowley J D. Screening poly(dA/dT)- cDNAs for gene identification. Proc Natl Acad Sci. 2000;97:4162–4167. doi: 10.1073/pnas.97.8.4162. [DOI] [PMC free article] [PubMed] [Google Scholar]
- Weigmann A, Corbeil D, Hellwig A, Huttner WB. Prominin, a novel microvilli-specific polytopic membrane protein of the apical surface of epithelial cells, is targeted to plasmalemmal protrusions of non-epithelial cells. Proc Natl Acad Sci. 1997;94:12425–12430. doi: 10.1073/pnas.94.23.12425. [DOI] [PMC free article] [PubMed] [Google Scholar]
- Weinstock KG, Kirkness EF, Lee NH, Earle-Hughes JA, Venter JC. cDNA sequencing: A means of understanding cellular physiology. Curr Opin Biotechnol. 1994;5:599–603. doi: 10.1016/0958-1669(94)90081-7. [DOI] [PubMed] [Google Scholar]
- Whitney LW, Becker KG, Tresser NJ, Caballero-Ramos CI, Munson PJ, Prabhu VV, Trent JM, McFarland HF, Biddison WE. Analysis of gene expression in multiple sclerosis lesions using cDNA microarrays. Ann Neurol. 1999;46:425–428. doi: 10.1002/1531-8249(199909)46:3<425::aid-ana22>3.0.co;2-o. [DOI] [PubMed] [Google Scholar]
- Wolfsberg TG, Landsman D. A comparison of expressed sequence tags (ESTs) to human genomic sequences. Nucleic Acids Res. 1997;25:1626–1632. doi: 10.1093/nar/25.8.1626. [DOI] [PMC free article] [PubMed] [Google Scholar]
- Yanicostas C, Vincent A, Lepesant JA. Transcriptional and posttranscriptional regulation contributes to the sex-regulated expression of two sequence-related genes at the janus locus of Drosophila melanogaster. Mol Cell Biol. 1989;9:2526–2535. doi: 10.1128/mcb.9.6.2526. [DOI] [PMC free article] [PubMed] [Google Scholar]