

Abstract
Purpose
To address phase and amplitude errors for multi-point water–fat separation with “bipolar” acquisitions, which efficiently collect all echoes with alternating read-out gradient polarities in one repetition.
Materials and Methods
With the bipolar acquisitions, eddy currents and other system nonidealities can induce inconsistent phase errors between echoes, disrupting water–fat separation. Previous studies have addressed phase correction in the read-out direction. However, the bipolar acquisitions may be subject to spatially high order phase errors as well as an amplitude modulation in the read-out direction. A method to correct for the 2D phase and amplitude errors is introduced. Low resolution reference data with reversed gradient polarities are collected. From the pair of low-resolution data collected with opposite gradient polarities, the two-dimensional phase errors are estimated and corrected. The pair of data are then combined for water–fat separation.
Results
We demonstrate that the proposed method can effectively remove the high order errors with phantom and in vivo experiments, including obliquely oriented scans.
Conclusion
For bipolar multi-echo acquisitions, uniform water–fat separation can be achieved by removing high order phase errors with the proposed method.
Keywords: water–fat separation, bipolar gradient, eddy currents, bandpass filter asymmetry, oblique scan, multi-echo
Chemical shift based multi-echo water–fat separation techniques (1–3) have seen a recent resurgence of interest for clinical use. These methods acquire multiple images at different echo times so that chemical shift induced phase shifts can be used to separate water and fat signals. Traditionally, each echo is collected in a separate sequence repetition (“single-echo per TR”), allowing flexible imaging prescriptions at the cost of doubling or tripling the minimum scan times. More recent implementations collect all echoes in one TR (4–7), significantly shortening the required scan times. In these “multi-echo per TR” sequences, there are two approaches to collect the echoes. The “unipolar” sequences (with “fly-back” gradients) acquire all echoes using the same gradient polarity (7), ensuring phase consistency among the echoes. The second approach, using “bipolar” acquisitions (also referred to as “non–fly-back” sequences), collects echoes during both positive and negative gradient polarities (4–6).
The bipolar approach offers many advantages as compared to the unipolar sequence. Removing the “fly-back” gradients between the echoes greatly improves the SNR efficiency of the bipolar sequence (5). The minimum TR and scan time are also significantly shortened. In addition, the minimum echo spacing (echo time increment) is reduced, effectively increasing the spectral bandwidth in which water–fat can be unambiguously determined. Thus, a more robust water–fat separation may be achievable (8,9). Alternatively, a higher resolution in the read-out direction can be achieved if the echo spacing remains unchanged.
However, the bipolar acquisition also brings unique challenges. First, the chemical shift now appears in opposite directions at echoes with different gradient polarities; therefore, k-space water–fat separation methods are required to correct for the chemical shift artifact (5,10). More importantly, the bipolar sequences must account for phase errors that result from eddy currents and other system nonidealities. While these phase errors also exist in unipolar acquisitions, they effectively add a constant phase on all the echoes, so the relative phases between the echoes remain unchanged. For bipolar acquisitions, the phase errors are modulated in opposite directions spatially for positive and negative gradient polarities, disrupting the inter-echo phase consistency that is critical for water–fat separation.
The phase errors associated with the switching of the gradient polarities have been studied extensively for echo planar imaging acquisitions. Gradient delays and eddy currents caused by the rapidly changing gradient fields may induce phase errors in all spatial directions (11–13). The linear phase error in the read-out direction is the dominant component seen in the bipolar multi-echo acquisitions, which can be estimated and effectively corrected by detecting a shift of the k-space peak (5) or collecting reference scans without phase encoding (4). The latter approach is capable of correcting for a nonlinear phase error. The remaining phase errors in other spatial directions may be caused by eddy currents in other conducting structures in the system, e.g., the radiofrequency (RF) shield (14), concomitant gradients, and cross term eddy currents. Furthermore, for obliquely oriented imaging planes, the anisotropic gradient delays result in a dominant linear phase error that may not be aligned with the read-out direction, introducing relatively substantial linear phase errors in phase encoding or slice directions (15).
The inconsistency between the echoes collected with bipolar gradients is not limited to the phase errors (16). The receiver chain filters in general have a non-flat frequency response, effectively introducing an asymmetric amplitude modulation on the read-out lines (16–18), but in opposite spatial directions for echoes collected with positive and negative gradient polarities. This amplitude modulation is solely in the read-out direction.
In this work, we introduce a method to estimate and correct for the two-dimensional (2D) phase errors and amplitude modulation before separating water and fat, achieved by collecting additional phase encoded k-space data with the reversed gradient polarity. We demonstrate that the high order phase and amplitude inconsistency can be effectively removed, which leads to more uniform water–fat separation.
Materials and Methods
Signal Model
The signals collected with the positive (+) and the negative (−) gradient polarities can be described as:
| [1] |
The following notation is used:
i: the echo index (i = 1, 2… number of TE)
x: read-out direction
x0: the FOV offset in the read-out direction relative to the scanner iso-center
y: phase encoding direction
: the ith echo image collected with the positive (+) or the negative (−) read-out gradient
si(x, y): the original image free from the phase and amplitude modulations caused by the bipolar gradients.
f(±(x + x0)): the amplitude modulation induced by the receiver filter response (16–18), the direction of which depends on the read-out gradient polarity.
e±jθi(x,y): the 2D phase error that has opposite signs with the positive (“+”) and the negative (“−”) gradient polarities.
Ideally, the receiver filters have a flat response in the pass band (i.e., f(x) = 1). However, due to the causality of the receiver filters, their frequency response in general are asymmetric either relative to the center of the image (due to anti-aliasing filter, etc) or relative to the iso-center (due to RF coils). As will be shown later, the dominant factor observed in our experiments comes from the asymmetric response of the RF coils, therefore we model f(x) to be asymmetric relative to the iso-center, i.e., f(x + x0) ≠ f(−(x + x0)). For systems that are dominant by receiver chain filter asymmetry, the following analysis is still valid by setting x0 = 0. Furthermore, we define:
| [2] |
In Eq. [1] and Eq. [2], only the amplitude modulation is included in f (x). The phase modulation from the receiver filter response is implied in the phase error term e±jθi(x,y).
For convenience, we separate the phase error e±jθi(x,y) into two parts:
| [3] |
e±jθi(x) denotes the dominant linear phase error in the read-out direction, while e±jθ̂i(x,y) represents the remaining high order phase error.
Acquisition
In our approach, we first correct for the dominant linear phase error, followed by correction of the remaining high order phase and amplitude errors. This is because the high order errors are in general relatively small and spatially slowly varying. The data necessary to estimate correction factors are acquired by collecting a few additional phase encoded reference lines with the opposite gradient polarity at each echo. Figure 1 illustrates this approach for a three-point acquisition. Each line represents one k-space phase encoded line, and the direction of the lines is determined by the gradient polarity used. In addition to the regular full resolution data (Ny lines) that are collected with positive, negative, positive bipolar gradients for the three echoes, additional phase encoded reference lines (Nr lines) are also collected, but with the reversed gradient polarities at each echo (i.e., negative, positive, negative). With this approach, a pair of low-resolution images from opposite gradient polarities can be obtained and used for correction of phase and amplitude errors that are smoothly varying in space.
Figure 1.
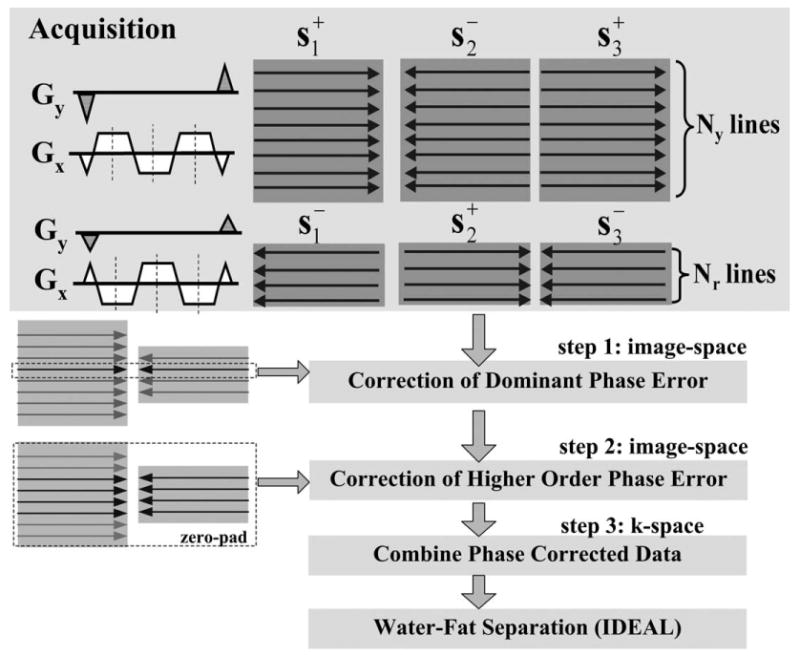
Acquisition strategy and flow diagram of the 2D phase and amplitude correction algorithm. During the acquisition, additional phase encoded reference lines (Nr) are collected but with the reversed gradient polarity at each echo. Each line represents one k-space phase encoded line, and the direction of the arrows indicates the gradient polarity used. During the reconstruction, the pair of center k-space lines collected with opposite gradient polarities is used for estimating a linear dominant phase error in the read-out direction. The remaining high order phase errors are corrected using the pair of low-resolution images reconstructed from the center Nr lines. Finally, the phase corrected reference lines are combined with the regular data to form the final multi-echo data, which are then processed by the IDEAL algorithm to separate water and fat.
Phase and Amplitude Correction
We use a three-step approach to correct for the 2D phase and amplitude errors.
Step 1: Dominant Phase Error
We correct for the linear dominant phase error, i.e. θi (x) in Eq. [3], by detecting the k-space center shift using the two center phase encoding lines between the regular data and the reference data (see Fig. 1). The cross-correlation of the two lines is used to find the noninteger k-space shift (5). To take into account the possible constant phase shift between the two lines, the phase difference between the k-space peaks of the two lines is halved and added to the linear phase as the estimated θi (x).
Step 2: High Order Phase Error
After the linear phase error (θi (x)) is estimated, it is removed from , which can be now represented as:
| [4] |
The high order phase error can be estimated by taking the phase difference of the pair of the low-resolution images reconstructed from the reference and regular data:
| [5] |
For simplicity, denotes the low-resolution images reconstructed from the center Nr phase encoding lines.
Step 3: Data Combination
The phase corrected are combined:
| [6] |
We have used the model in Eq. [2] for f (x). Note that after the combination, the amplitude modulation a(x) is consistent through out the echoes, which does not affect the quality of the water–fat separation.
In practice, low-resolution reference data are collected. The combination in Eq. 6 is performed in k-space by adding the phase corrected full resolution data and low resolution reference data. Because the previous step of 2D phase correction is performed in image space with zero-padded low-resolution images, Gibbs ringing may be introduced by the phase corrected reference lines. To better “stitch” the two sets of the data without ringing artifacts, a weighting function along the phase encoding direction is applied to the low resolution data. The weighting function is zero at the phase encoding steps where the reference data are not collected and smoothly increases to 1 at the k-space center.
Experiments
Experiments were performed to demonstrate the proposed correction method for bipolar water–fat separation. A GE HDx 1.5 Tesla (T) scanner (GE Healthcare, Waukesha, WI, USA) was used. Volunteers were scanned after informed consent and approval from our Institutional Review Board. A multi-echo 3D SPGR sequence was used. In phantom experiments, two full resolution three-point bipolar data were collected, but with opposite gradient polarities at each echo, i.e., Ny = Nr. This allowed evaluation of 2D phase and amplitude correction with full resolution correction (Ny = Nr) as well as using only low-resolution lines (Nr = 16). The method was also evaluated for oblique scanning. For in vivo scans, 16 reference lines (Nr = 16) were collected along with the full resolution data.
After the phase and amplitude inconsistencies were removed, the multi-echo images were processed using the IDEAL water–fat separation algorithm (19). The water and fat images were examined to evaluate the effectiveness of the phase and amplitude correction. Note that the proposed method could also be applied to any other multi-echo water–fat separation method.
Results
Figure 2 shows results from a water–fat phantom scan at 1.5T. For this scan, two sets of three-echo bipolar data were collected, but with opposite gradient polarities at each echo, i.e., Nr = Ny = 192. The center of the phantom is roughly positioned in the iso-center while the imaging field of view (FOV) is offset by 47 mm in the read-out direction. The imaging parameters include: matrix = 256 × 192, FOV = 32 × 32 cm, bandwidth (BW) = ±100 kHz, repetition time (TR) = 7.7 ms, 32 locations, slice thickness = 4 mm, flip angle = 12°, echo time (TE) = (2.0 ms, 3.6 ms, 5.2 ms), single-channel head coil. Water and fat images from five different reconstructions are shown in Figure 2a. Directly applying water–fat separation to the bipolar source data leads to failed separation primarily in the read-out direction, as expected. With 1D linear phase correction only, water–fat separation is improved. However, incomplete separation is particularly apparent in the fat image due to the remaining high order phase and amplitude errors. With the 2D phase only correction (Nr = 16), water–fat separation is further improved. When both 2D phase and amplitude corrections are included, complete water–fat separation is achieved with Nr = 16 or Ny = Nr. The residual water signal in the fat image can be a serious artifact when using water–fat separation techniques for quantitative applications, such as imaging fatty infiltration of liver.
Figure 2.
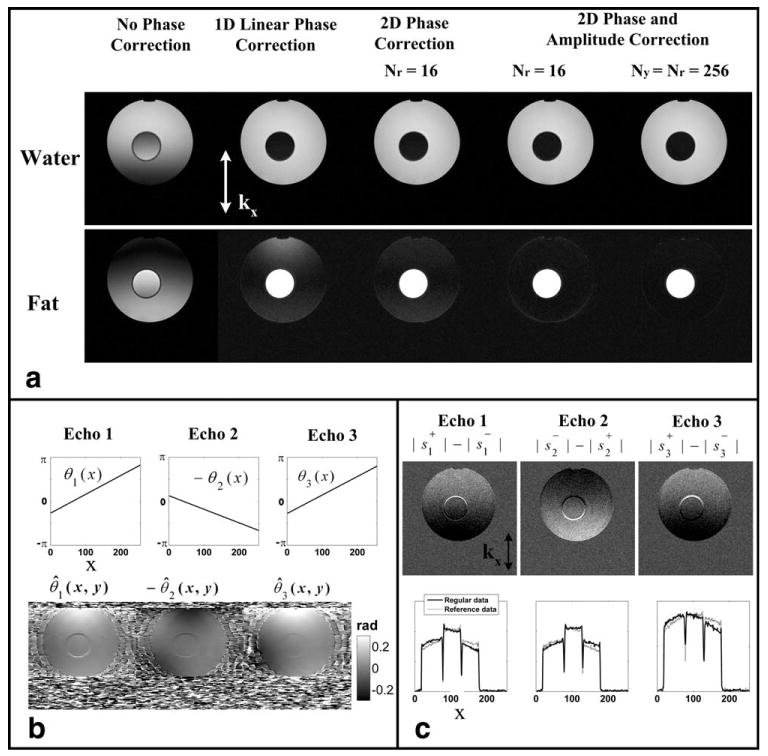
Results from a water–fat phantom scan with the bipolar acquisition and the proposed reconstruction algorithm. The center of the phantom is near scanner iso-center, while the imaging FOV is offset by 47 mm in the read-out direction. a: Separated water and fat images using the three-point bipolar data with no phase correction, 1D linear phase correction, 2D phase correction (Nr = 16) and 2D phase and amplitude correction (Nr = 16 and Nr = Ny = 192), respectively (from left to right), showing progressive improvement of the water–fat separation. b: The estimated linear and high order 2D phases at each echo. c: The asymmetric amplitude modulation. The subtraction images of the two magnitude images collected with opposite gradients clearly show an asymmetric amplitude modulation that depends on the gradient polarity used, which can be appreciated better from the plots of the two central lines.
The intermediate images from the reconstruction are also presented in Figure 2, including estimated linear phase errors in the read-out direction θi(x) and the 2D phase errors θ̂i(x,y) (Nr = 16) (Fig. 2b). As can be seen, the phase error is dominantly in the read-out direction. The presence of the high order phase error is evident, leading to spatially variant incomplete water–fat separation. Figure 2c illustrates the amplitude error for this scan. The subtraction images of the two magnitude images collected with opposite gradients clearly show an asymmetric amplitude modulation that depends on the gradient polarity used. The modulation only varies in the read-out direction (vertical), as expected. The central lines of the magnitude signals are plotted (without subtraction). The two lines cross at the iso-center, then have opposite modulations at the upper and lower sides. Therefore, if this modulation is not corrected, as shown in Figure 2a third column images, incomplete water–fat separation will be resulted along the read-out direction with the exception of near iso-center.
Figure 3 demonstrates the effectiveness of the proposed method for oblique scans. The imaging slab was placed obliquely (approximately 45°) in the coronal plane. The imaging parameters include: matrix = 256 × 192, FOV = 30 × 30 cm, BW = ±125 kHz, TR = 7.5 ms, 18 locations, slice thickness = 6 mm, flip angle = 20°, TE = (2.0 ms, 3.6 ms, 5.2 ms), eight-channel cardiac coil, 50-s scan time. Water, fat, and the intermediate phase images are shown. Due to the anisotropic gradient behavior, the linear phase errors resulting from gradient delays are no longer solely in the read-out direction (vertical direction in this example). The estimated 2D phase maps (Fig. 3c) show substantial phase errors in the phase encoding direction (right-left). As a consequence, correcting only 1D phase error leads to nonuniform water–fat separation, primarily varying in the phase-encoding direction. The 2D correction takes into account the residual phase errors in the phase-encoding direction. As a result, water and fat were uniformly separated with the 2D phase and amplitude correction.
Figure 3.
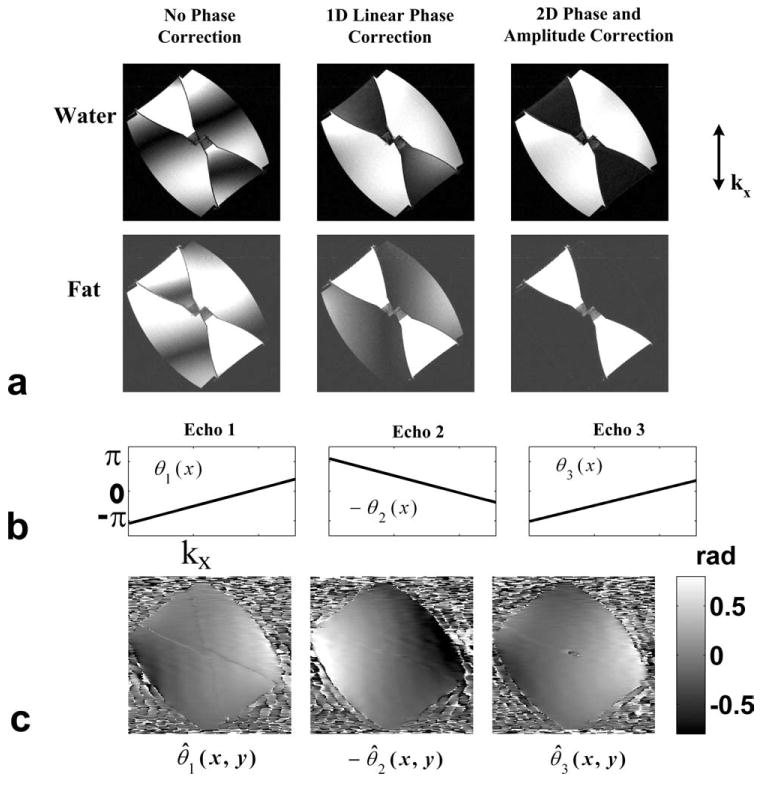
Results from a water–fat phantom scan with obliquely placed slab (approximately 45°) in the coronal plane. a: Separated water and fat images using the three-point bipolar data with no phase correction, 1D linear phase correction, 2D phase and amplitude correction (Nr = 16), respectively (from left to right). b: The estimated linear phase errors in the read-out direction at each echo. c: The high order 2D phase errors at each echo. Due to the anisotropic gradient delays, substantial phase errors appear in the phase encoding direction (horizontal) which cannot be resolved by the 1D phase correction.
Results from an in vivo abdominal scan at 1.5T are presented in Figure 4. Figure 4a shows the water and fat images from IDEAL water–fat separation after no phase correction, 1D linear phase correction and the proposed 2D phase and amplitude correction (Nr = 16), respectively. Although 1D phase correction leads to improved water–fat separation compared with the result with no phase correction, spatially variant residual fat signals can be seen in the water images (arrows). In contrast, uniform and clean water–fat separation is achieved with the 2D phase and amplitude correction. The low-resolution 2D phase errors (Fig. 4c) estimated from 16 phase encoding lines suggest the strong presence of high order effects. The imaging parameters include: matrix = 320 × 192, FOV = 33 × 33 cm, BW = ±125 kHz, TR = 7.6 ms, 18 locations, slice thickness = 10 mm, flip angle = 20°, TE = (2.0 ms, 3.6 ms, 5.2 ms), eight-channel body array. With 16 additional reference lines, the total scan time increases slightly from 27 s to 29 s. For comparison, the same scan parameters will result in 40 second scan time if the unipolar sequence were used due to the increase minimum repetition time.
Figure 4.
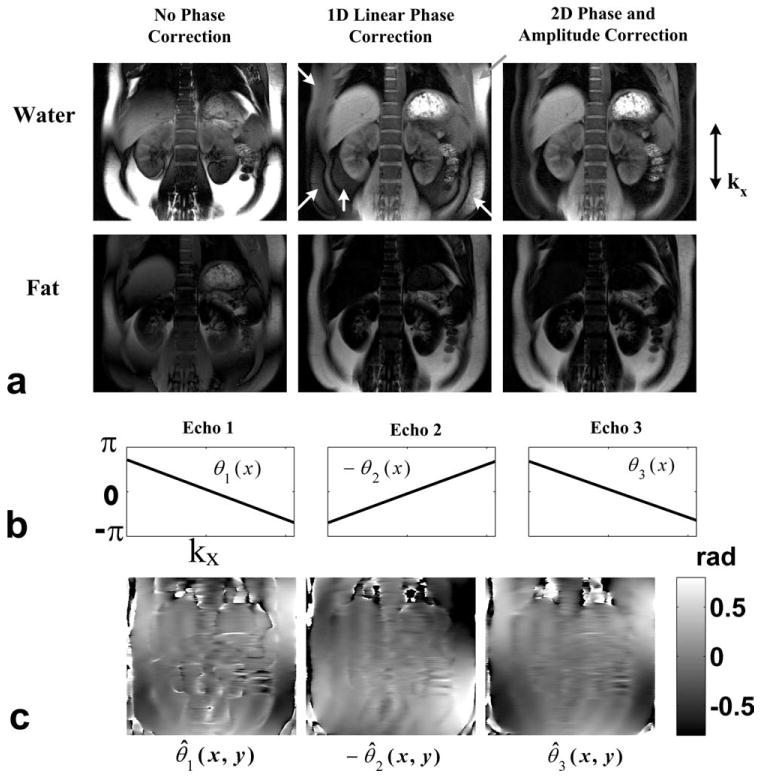
Results from an in vivo abdominal scan. a: Water and fat images from IDEAL water–fat separation after no phase correction, 1D linear phase correction, and the proposed 2D phase and amplitude correction (Nr = 16), respectively. b: The dominant linear phase error estimated at the 3 echoes. c: The low-resolution 2D phase errors suggest the strong presence of high order effects.
Figure 5 shows results from an experiment with offset FOV and oblique oriented acquisition in foot, where there is typically significant field inhomogeneity. Despite of these challenges, the proposed method with 2D phase correction accurately estimates all phase errors and uniform water–fat separation is obtained. In contrast, the 1D linear phase correction results in substantial amount of residual phase errors, disrupting the subsequent water–fat separation. The imaging parameters include: 1.5T, matrix = 256 × 192, FOV = 17 × 17 cm, BW = ±100 kHz, TR = 8.1 ms, 32 locations, slice thickness = 5 mm, flip angle = 20°, TE = (2.0 ms, 3.8 ms, 5.6 ms), single-channel ankle coil. With 16 additional reference lines, the total scan time was 54 s. The center of the image has an offset of 52 mm to the patient right and 55 mm in the anterior direction.
Figure 5.
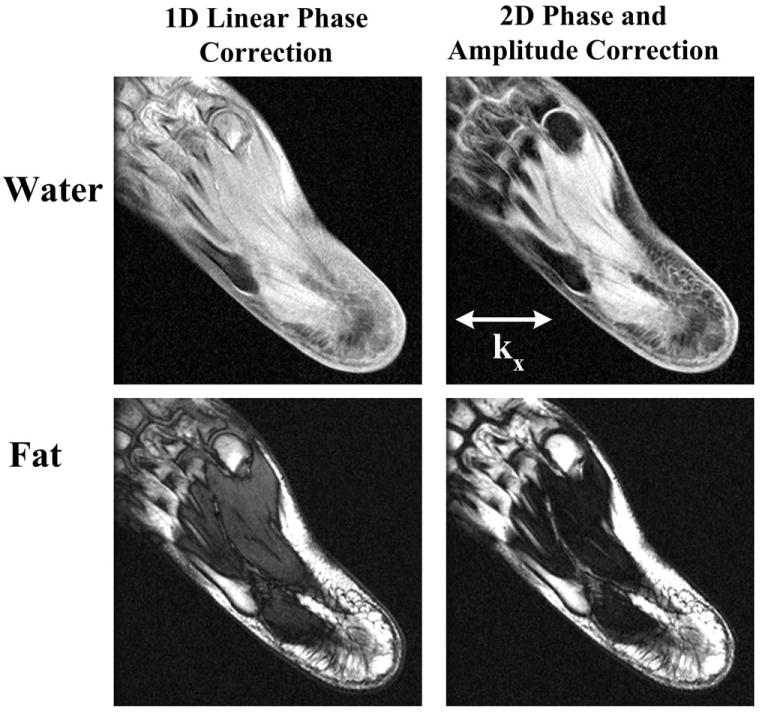
Results from an oblique and off-center FOV foot scan at 1.5T. Water and fat images following 1D linear phase correction and the proposed 2D phase and amplitude correction (Nr = 16) are shown. Imaging FOV was rotated roughly 45 degrees in the axial plane. The FOV center is 52 mm (right) and 55 mm (anterior) from the iso-center. It can be seen that the proposed method provides more robust phase correction than 1D linear phase correction, leading to uniform water–fat separation in this challenging case.
Discussion
Multi-echo sequences using bipolar gradients are attractive due to their efficient data acquisition scheme. However, inconsistent phase errors between the echoes must be corrected to enable reliable and uniform water–fat separation. In this work, we demonstrate that it is important to correct for the high order phase errors in addition to the read-out direction phase error, particularly for obliquely oriented scans. Furthermore, the bipolar data may be subject to asymmetric amplitude modulation due to the receiver filter response. To correct for these phase and amplitude errors, we collect a small number of phase-encoded lines with reversed gradient polarities. These additional data are combined with the regular data to further improve the SNR of the final images, which however results in colored noise (20). The high order phase and amplitude errors are typically slowly varying in space, and can be adequately corrected with 16 low phase encoded reference lines for all our phantom and in vivo experiments. The optimal number of reference lines may be highly dependent on factors that vary from scan to scan, such as field-of-view, resolution, scan orientation, system hardware, etc. In applications where the scan time is not a limiting factor (e.g., when two signal averages are used in the original protocol), full resolution reference data can be acquired. This allows correction of full resolution high order errors and provides two effective signal averages. In addition, it is possible to re-group the data such that conventional three-point IDEAL reconstruction can be performed based on two groups of the three-echo data collected with the same gradient polarity. The water and fat images from the two reconstructions can be each corrected for the chemical shift and then averaged to obtain the final images. Regardless of the resolution of the reference data, the proposed technique can be combined with parallel imaging techniques, with phase correction operated on the parallel imaging reconstructed data.
While we used the IDEAL water–fat separation method to demonstrate the effectiveness of the phase and amplitude correction, this correction approach can be applied to any multi-echo water–fat separation method. There are two exceptions that may not need to correct for the phase errors. First, for two-point water–fat separation techniques (21), any phase difference between the two echoes is estimated regardless of the source (eddy currents or Bo field inhomogeneity). Nonetheless, Ma et al recently showed that it is beneficial to correct for the dominant linear phase error before the two-point water–fat separation (22). Second, water–fat separation methods that are based on the magnitude source images are insensitive to phase errors (23). However, because the phase information is lost, such methods may not be able to distinguish between fat and water signals due to an intrinsic water–fat ambiguity (23). The present work may be combined with k-space based water–fat separation methods (5,10) to correct for chemical shift induced artifact in bipolar acquisitions. The combination of the opposite polarity data requires modification of the k-space formula as each k-space sample consists of fat that have two components: both positive and negative time shifts relative to the k-space center echo time. We have not seen significant chemical shift induced artifact despite using an image-based IDEAL method due to high bandwidth used in these multi-echo sequences.
We have separated the phase errors into the read-out direction dominant phase error and the remaining 2D phase error. This allows correction of a phase error bigger than π across the FOV without incurring error-prone phase unwrapping. It assumes that after the dominant phase error is removed, the remaining phase difference between the two images (2·θ̂i(x,y)) does not exceed 2π, which in theory can be violated in large FOV oblique acquisitions. We found this condition holds true for all of our experiments, including oblique scans. In practice, this phase correction is applied on a slice-by-slice basis for multi-slice or 3D acquisitions. Therefore, the proposed method is capable of correcting for slice-direction phase variation, which may be important for scans with an oblique slice direction.
In conclusion, we have demonstrated that high order phase and amplitude errors must be corrected for multi-echo water–fat separation methods with bipolar acquisitions. We have introduced a reliable and efficient phase and amplitude correction method that collects phase encoded reference data with reversed gradient polarities. As a result, it is possible to achieve high quality water–fat separation with more efficient bipolar acquisitions.
Acknowledgments
W.L. is supported by Start-up grant and AcRF Tier 1 grant from Nanyang Technological University.
Contract grant sponsor: Nanyang Technological University; Contract grant number: RG 25/08.
References
- 1.Dixon WT. Simple proton spectroscopic imaging. Radiology. 1984;153:189–194. doi: 10.1148/radiology.153.1.6089263. [DOI] [PubMed] [Google Scholar]
- 2.Glover GH. Multipoint Dixon technique for water and fat proton and susceptibility imaging. J Magn Reson Imaging. 1991;1:521–530. doi: 10.1002/jmri.1880010504. [DOI] [PubMed] [Google Scholar]
- 3.Glover GH, Schneider E. Three-point Dixon technique for true water/fat decomposition with B0 inhomogeneity correction. Magn Reson Med. 1991;18:371–383. doi: 10.1002/mrm.1910180211. [DOI] [PubMed] [Google Scholar]
- 4.Li Z, Gmitro AF, Bilgin A, Altbach MI. Fast decomposition of water and lipid using a GRASE technique with the IDEAL algorithm. Magn Reson Med. 2007;57:1047–1057. doi: 10.1002/mrm.21232. [DOI] [PubMed] [Google Scholar]
- 5.Lu W, Yu H, Shimakawa A, Alley M, Reeder SB, Hargreaves BA. Water-fat separation with bipolar multiecho sequences. Magn Reson Med. 2008;60:198–209. doi: 10.1002/mrm.21583. [DOI] [PubMed] [Google Scholar]
- 6.Ma J, Son JB, Zhou Y, Le-Petross H, Choi H. Fast spin-echo triple-echo dixon (fTED) technique for efficient T2-weighted water and fat imaging. Magn Reson Med. 2007;58:103–109. doi: 10.1002/mrm.21268. [DOI] [PubMed] [Google Scholar]
- 7.Reeder S, Hargreaves B, Vu A, et al. Rapid 3D-SPGR imaging of the liver with multi-echo IDEAL. Proceedings of the 14th Scientific Meeting of ISMRM; Miami Beach. 2005. abstract 2444. [Google Scholar]
- 8.Yu H, Reeder SB, Shimakawa A, Brittain JH, Pelc NJ. Field map estimation with a region growing scheme for iterative 3-point water-fat decomposition. Magn Reson Med. 2005;54:1032–1039. doi: 10.1002/mrm.20654. [DOI] [PubMed] [Google Scholar]
- 9.Yu H, Shimakawa A, McKenzie CA, Vu AT, Brau ACS, Beatty PJ, Reeder SB, Brittain JH. A multi-echo acquisition method with reduced echo spacing for robust IDEAL water-fat decomposition at 3T. Proceedings of the 16th Scientific Meeting of ISMRM; Berlin. 2007. abstract 3353. [Google Scholar]
- 10.Brodsky EK, Holmes JH, Yu H, Reeder SB. Generalized k-space decomposition with chemical shift correction for non-Cartesian water-fat imaging. Magn Reson Med. 2008;59:1151–1164. doi: 10.1002/mrm.21580. [DOI] [PubMed] [Google Scholar]
- 11.Buonocore MH, Gao L. Ghost artifact reduction for echo planar imaging using image phase correction. Magn Reson Med. 1997;38:89–100. doi: 10.1002/mrm.1910380114. [DOI] [PubMed] [Google Scholar]
- 12.Hennel F. Two-dimensional deghosting for EPI. MAGMA. 1999;9:134–137. doi: 10.1007/BF02594610. [DOI] [PubMed] [Google Scholar]
- 13.Chen NK, Wyrwicz AM. Removal of EPI Nyquist ghost artifacts with two-dimensional phase correction. Magn Reson Med. 2004;51:1247–1253. doi: 10.1002/mrm.20097. [DOI] [PubMed] [Google Scholar]
- 14.Alecci M, Jezzard P. Characterization and reduction of gradient-induced eddy currents in the RF shield of a TEM resonator. Magn Reson Med. 2002;48:404–407. doi: 10.1002/mrm.10226. [DOI] [PubMed] [Google Scholar]
- 15.Reeder SB, Atalar E, Faranesh AZ, McVeigh ER. Referenceless interleaved echo-planar imaging. Magn Reson Med. 1999;41:87–94. doi: 10.1002/(sici)1522-2594(199901)41:1<87::aid-mrm13>3.0.co;2-x. [DOI] [PMC free article] [PubMed] [Google Scholar]
- 16.Eggers H, Koken P, Boernert P. Phase and amplitude correction in bipolar multi-gradient-echo water-fat imaging. Proceedings of the 17th Scientific Meeting of ISMRM; Toronto. 2008. abstract 1364. [Google Scholar]
- 17.Delakis I, Petala K, De Wilde JP. MRI receiver frequency response as a contributor to Nyquist ghosting in echo planar imaging. J Magn Reson Imaging. 2005;22:324–328. doi: 10.1002/jmri.20365. [DOI] [PubMed] [Google Scholar]
- 18.King K, Crawford C, Maier J. Correction for filter-induced ghosts in echo planar imaging. Proceedings of the 3rd Annual Meeting of SMR, Nice; France. 1995. abstract 105. [Google Scholar]
- 19.Reeder SB, Wen Z, Yu H, Pineda AR, Gold GE, Markl M, Pelc NJ. Multicoil Dixon chemical species separation with an iterative least-squares estimation method. Magn Reson Med. 2004;51:35–45. doi: 10.1002/mrm.10675. [DOI] [PubMed] [Google Scholar]
- 20.Mugler JP., III Potential degradation in image quality due to selective averaging of phase-encoding lines in Fourier transform MRI. Magn Reson Med. 1991;19:170–174. doi: 10.1002/mrm.1910190115. [DOI] [PubMed] [Google Scholar]
- 21.Ma J, Vu AT, Son JB, Choi H, Hazle JD. Fat-suppressed three-dimensional dual echo Dixon technique for contrast agent enhanced MRI. J Magn Reson Imaging. 2006;23:36–41. doi: 10.1002/jmri.20470. [DOI] [PubMed] [Google Scholar]
- 22.Ma J, Slavens Z, Sun W, Bayram E, Estowski L, Hwang KP, Akao J, Vu AT. Linear phase-error correction for improved water and fat separation in dual-echo dixon techniques. Magn Reson Med. 2008;60:1250–1255. doi: 10.1002/mrm.21747. [DOI] [PubMed] [Google Scholar]
- 23.Bydder M, Yokoo T, Hamilton G, Middleton MS, Chavez AD, Schwimmer JB, Lavine JE, Sirlin CB. Relaxation effects in the quantification of fat using gradient echo imaging. Magn Reson Imaging. 2008;26:347–359. doi: 10.1016/j.mri.2007.08.012. [DOI] [PMC free article] [PubMed] [Google Scholar]