Abstract
In this paper, cross-relaxation imaging (CRI) is applied to human ex vivo knee cartilage, and correlations of the CRI parameters with macromolecular content in articular cartilage are reported. We show that, unlike the more commonly used magnetization transfer ratio (MTR), the bound pool fraction (BPF), the cross-relaxation rate (k) and the longitudinal relaxation time (T1) vary with depth and can therefore provide insight into the differences between the top and bottom layers of articular cartilage. Our CRI model is more sensitive to macromolecular content in the top layers of cartilage, with BPF showing moderate correlations with proteoglycan content, and k and T1 exhibiting moderate correlations with collagen.
Keywords: cross-relaxation imaging, bound pool fraction, quantitative magnetization transfer, cartilage, collagen, proteoglycan, relaxometry, qMRI
1 Introduction
Cartilage consists of an extracellular matrix of collagen, proteoglycan and water embedded with chondrocytes (cells). Cartilage damage in osteoarthritis is associated with loss of proteoglycans (PG) and degeneration of the collagen matrix (1). Therefore, biomarkers specific to collagen or proteoglycan content may serve as an early indicator of osteoarthritis.
Because collagen and proteoglycans in cartilage are both associated with water (2), magnetic resonance imaging (MRI) tuned to the resonant frequency of hydrogen is an appealing technique for measuring their content. However, collagen and proteoglycans are large macromolecules with a very short T2 relaxation time (3), so it is difficult to image them directly using MRI. Instead, several MR techniques have been developed which sensitize the measurement of water proton signal to the macromolecular content.
Some techniques such as delayed Gadolinium Enhanced MRI of Cartilage (dGEMRIC) (4) and T1ρ (5) are sensitive to the proteoglycan content. The dGEMRIC method uses a negatively charged contrast agent (Gd-DTPA2−) which distributes itself in regions not already occupied by negatively charged glycosaminoglycan sidechains of proteoglycans. After equilibration of the contrast agent, T1 relaxation time is proportional to proteoglycan content (6). T1ρ is inversely sensitive to the exchange of hydroxyl (-OH) and amide (-NH) protons on the proteoglycan sidechain with free water protons (7) and was reported to correlate with proteoglycan content (8,9). T1ρ relaxation time is also reported to be sensitive to hydration and collagen (10).
Other MRI techniques such as T2 mapping are sensitive to the collagen content and orientation in cartilage. Dardzinski et al. report T2 relaxation time increases from subchondral bone to the articular surface, which may be a result of the change in collagen structure and orientation through the depth (11). The T2 relaxation time is sensitive to collagen integrity (12), but the relationship between T2 and chemically induced proteoglycan changes is unclear (7,10,12–14). T2 relaxation time maps calculated from images with the cartilage surface perpendicular to the main magnetic field, B0, showed regions of T2 relaxation time homogeneity with location and thickness similar to regions of varied collagen orientation identified with polarized light microscopy. (15–17).
The compartmentalization of water in cartilage will result in multicomponent T2 behavior (18–20). Recently, multicomponent T2 mapping techniques have been applied to bovine articular cartilage (21). Reiter et al. detected three T2 compartments, and assigned one to water bound to collagen, one to water tightly bound to proteoglycans, and one to water loosely bound to proteoglycan.
Finally, there are techniques such as magnetization transfer (MT) (22) and chemical exchange-dependent saturation transfer (CEST) (23,24), which are sensitive to the exchange of magnetization between protons in macromolecules (bound pool) and protons in free water (free pool). Protons in the bound pool, such as those on collagen and proteoglycan, have a very short T2, so it is difficult to image them directly. However, when a selective off-resonance radio frequency (RF) pulse is applied, the free pool remains unperturbed, while protons in the bound pool are saturated (25). Once excited, the bound pool will interact with the free pool, effectively reducing its net magnetization. This process can be a result of chemical exchange of protons or dipole-dipole interaction.
Magnetization transfer in cartilage is primarily due to collagen (26), but changes in the MT contrast can also be due to physiological or pathophysiological changes in proteoglycan concentration and tissue structure (27). Lattanzio et al. looked at the different exchange coupling subsystems in cartilage, and concluded that collagen-water is the largest subsystem, but that there is also significant exchange between proteoglycans and collagen. Thus, both collagen and proteoglycans contribute to the MT signal (28). The common metric for measuring magnetization transfer is the magnetization transfer ratio (MTR) (29).
Measurements of MTR in proteoglycan solutions and collagen suspensions have shown that glycosaminoglycans (GAG) and collagen exhibit concentration dependent effects on MTR (27). Henkelman et al. have shown that in a cartilage sample with GAG depletion and cartilage damage, MTR is not sufficient to differentially determine the amount of cartilage degradation in the sample, and that a more in-depth MT analysis might be used to probe the molecular state in cartilage (30).
MTR is not an intrinsic MR property of tissue; it depends on the pulse sequence used, as well as the MT pulse frequency and power. It also depends on the longitudinal relaxation time (T1) of the free and the bound pool, the bound pool fraction (BPF), defined as the fraction of exchanging protons that are bound to macromolecules, and the cross-relaxation rate (k), which quantifies the rate of exchange between the free and the bound pool (25,31). A technique called quantitative magnetization transfer (qMT) decouples the contribution of each of these parameters to the MTR, removing the sequence-dependent ambiguity of MTR, and providing greater sensitivity to the macromolecular concentrations in tissue. Several qMT methods have been proposed (32–35). While the methodology and terminology used in the above methods differ significantly, their goal is similar: to determine the proportion of protons that are bound to macromolecules and to quantify the rate of exchange of magnetization between the bound and free protons. Despite the differences in the models used, Cercignani et al. have shown that the pulsed qMT parameters are in good agreement across models (36).
Recently, several groups have introduced quantitative magnetization transfer methods for imaging cartilage (37–39). Li et al. have shown that the bound pool fraction and the cross-relaxation rate are highly correlated with the increase of GAG content in tissue engineered constructs over a three week growing period (38). One benefit for using MT for imaging cartilage is its relative insensitivity to the magic angle effect (40). Another method which is sensitive to the GAG concentrations in cartilage is gagCEST, which utilizes the asymmetry in the z-spectrum to derive a metric sensitive to GAG (37).
In this work, we use the model developed by Yarnykh and Yuan (41) to investigate the correlations of the qMT parameters with macromolecular content in articular cartilage. To be consistent with the terminology used by Yarnykh and Yuan, we use the term cross-relaxation imaging (CRI) when quantifying the magnetization transfer between mobile water and macromolecular protons in tissue. In particular, we look at how the bound pool fraction (BPF) and the cross-relaxation rate k relate to collagen and proteoglycan concentrations in ex vivo human cartilage specimens. We also compute the correlations of collagen and proteoglycan with the more commonly used quantitative MRI parameters, MTR and T1, and compare them to the CRI correlations.
2 Methods
2.1 Specimen Preparation
Human cadaver fresh-frozen knee joints (mid-femur to mid-tibia) were obtained from NDRI (National Disease Research Interchange, Philadelphia, PA), AGR (Anatomy Gifts Registry, Glen Burnie, MD) and UCSF (University of California San Francisco Willed Body Program, San Francisco, CA). Four specimens were used: three males and one female aged 65, 66, 69 and 86 years old. The three patellae (two male and one female) and one tibia (male) were dissected from the knee joint and part of the bone was removed to create a flat subchondral-bone surface. The tibia was cut into medial and lateral halves, and only the lateral side was used for this study. The flat, subchondral bone surface was fixed on an acrylic plate using ethyl-2-cyanoacrylate adhesive (KrazyGlue, New York, NY). The plate was 5 cm square with two intersecting channels drilled into it. The specimens were stored on the plates surrounded by gauze soaked in phosphate-buffered saline (PBS) and protease inhibitors at −20°C until MRI studies and biochemistry were completed. Specimens were brought to room temperature prior to MRI studies and biochemistry.
For the MRI studies the plate was placed in a sealed secondary container which was at least partially filled with PBS containing protease inhibitors. The channels filled with the PBS were bright due to their long T2 and served as reference markers.
2.2 Cross-relaxation Imaging
In order to evaluate the macromolecular content in cartilage, we performed cross-relaxation imaging, as proposed by Yarnykh and Yuan (41). According to their CRI model, the evolution of the free and the bound pool magnetization is represented by a linear system with several tissue dependent and pulse sequence dependent parameters.
where A represents the magnetization transfer between the two pools, B is the direct effect of the MT pulse, and C is the longitudinal recovery in the absence of external pulses (41). The prediction model makes a priori assumptions about all unknown parameters except for the cross-relaxation rate k and the BPF. For the T2 of the bound pool, we used , as it gave the best quality of fit, and it agrees with previous methods (3). We also fixed the ratio of the free pool ( ), based on measurements of T1 and T2 in our specimens which showed variation of the ratio from 0.044 to 0.056.
All scans were done on a GE Signa 1.5 T scanner with maximum gradient amplitude 40 mT/m and maximum slew rate 150 mT/m/ms (GE Healthcare, Milwaukee, WI, USA). The model requires knowledge of the T1 relaxation time; we assumed a constant T1 for the bound pool ( ), and we performed variable flip angle 3D SPGR T1 mapping to estimate the T1 of the free pool (42) (TE = 4 ms, TR = 20ms, α = 4°, 10°, 20°, 30°). The T1 scans are followed by 3D SPGR MT scans (Fermi MT pulse, 8ms duration, 670° flip angle, TE = 4 ms, TR = 32 ms, α = 10°.) The z-spectrum was sampled at 3, 9, 15, and 21 kHz. In addition, for each specimen we acquired one reference image, S0, with the same acquisition parameters as the MT scans, but without any MT pulses. This image substitutes for the synthetic image S0 proposed by Yarnykh and Yuan (41), and it makes the measurements less sensitive to drifts in the mean signal intensity that can happen after several consecutive MT scans. The resolution for all scans was 0.8 × 0.8 × 3mm. We fit the signal to an MT model based on a Superlorentzian lineshape and obtained maps of the bound pool fraction (BPF) and the cross-relaxation rate (k).
A non-linear least-squares Levenberg-Marquardt algorithm was used to find the k and BPF values that minimize the prediction error. To test the validity of the model, we imaged a tibia specimen using 27 MT pulses applied from 1.5 to 40.5 kHz off-resonance. We fitted a z-spectrum model to the data points obtained from ROIs in the tibia cartilage specimen.
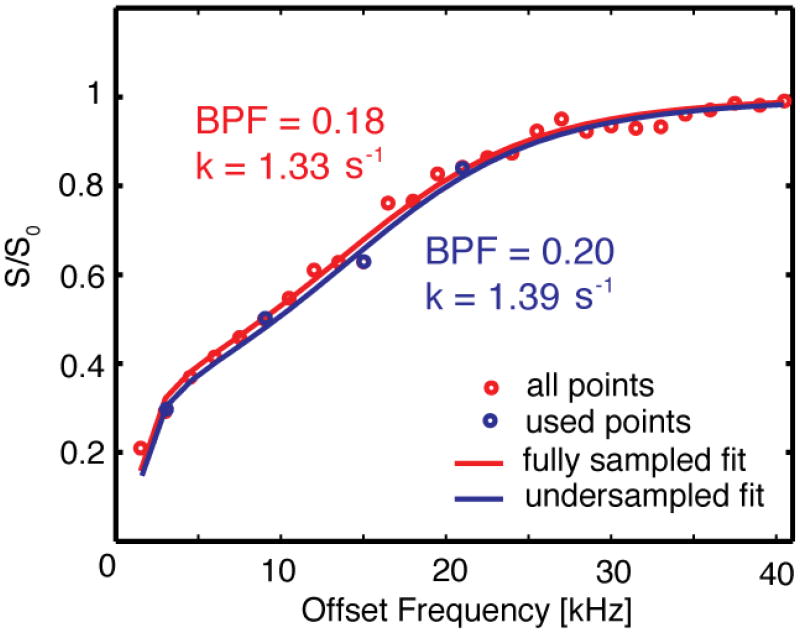
The model agreed well with the acquired data, as shown in Fig. 1. The figure shows the fit for a single ROI when all 27 points are used, as well as how the fit is affected when only 4 points are considered. The BPF value changed from 0.18 to 0.20 when the number of samples was dropped, while the corresponding k value changed from 1.33 to 1.39 s−1. This variation is typical for the other plug locations.
Figure 1.
27 points sampling the z-spectrum of cartilage of a single ROI from 1.5 to 40.5 kHz. The red line represents the line fitted to all the points by the CRI model. The blue line represents the line fitted when only four points were used.
2.3 Biochemistry
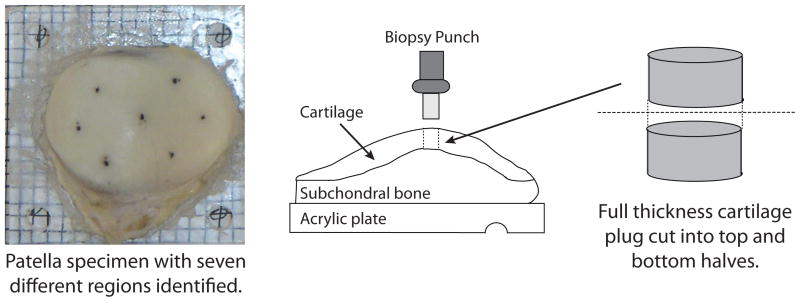
For biochemical analyses, the specimen mounted on the acrylic plate was placed on a 3 mm × 3 mm grid. 3 mm diameter full thickness plugs of cartilage were removed from seven locations across the surface of the patella: center, lateral center, lateral inferior, lateral superior, medial center, medial inferior and medial superior. These are the same regions used by Lammentausta et al. with the addition of the central region (43). Five plugs were removed from across the surface of the lateral tibia specimen. If any subchondral bone was attached to the plug, care was taken to remove it to avoid any inaccuracies in the measurement. The plugs were then cut in half to create top and bottom half samples in each region. The top and bottom samples do not correspond exactly to the superficial, intermediate and deep zones of cartilage. Figure 2 shows a specimen and illustrates the plug removal procedure.
Figure 2.
(Left) Top view of a patella specimen mounted on an acrylic plate. (Right) Side view of the patella: schematic of the plug removal process.
Each sample was weighed, dried at 50°C for 12 hours and weighed again to obtain wet and dry weights. Each sample was digested in 1 ml papain solution overnight at 63°C and stored at 4°C. Total sulfated glycosaminoglycan content, a measure of proteoglycan content, was quantified using the dimethylmethylene blue assay (44). The assay measures sulfated glycosaminoglycans (sGAG) using chondroitin sulfate as a standard. Collagen content was determined from hydroxyproline content (45). The papain-digested samples were acid hydrolyzed, and hydroxyproline was measured using the chloramine-T/Ehrlich’s reagent assay (46,47). Sulfated glycosaminoglycan and hydroxyproline amounts were normalized by wet weight (WW) and are reported as a percentage of wet weight.
2.4 Data Analysis
Next, we computed the BPF, k, T1 and MTR parameters in the ROIs that corresponded to the plug locations. We did this by averaging the magnitude data from the voxels in each ROI to reduce noise in the computed CRI parameters. For computing MTR, we used the equation , where S is the steady state z-magnetization measured after a number of off-resonance RF pulses. S was obtained with an MT pulse at 3 kHz off-resonance (the 3 kHz MT SPGR scan used in the CRI protocol), whereas S0 is the reference image acquired as part of the CRI protocol. For each plug location, we computed different CRI parameters for the top and for the bottom half of the plug. As mentioned earlier, the top and the bottom ROIs do not correspond exactly to the superficial, intermediate, and deep zones of cartilage structure. We computed the correlation of the MT parameters with the collagen and proteoglycan measurements.
3 Results
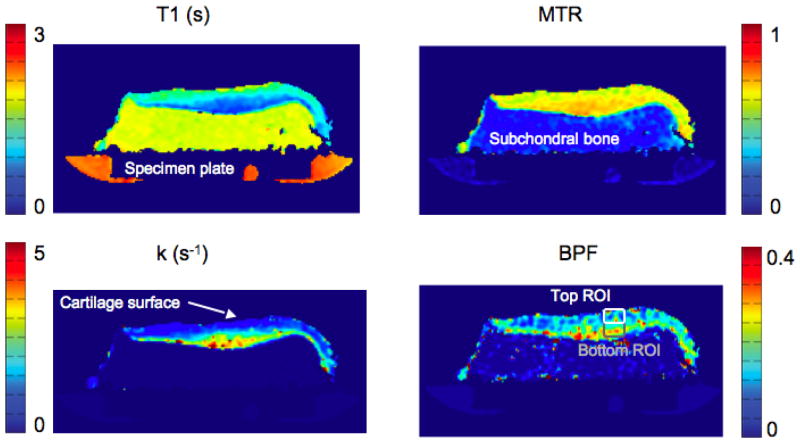
The MTR, BPF, k and T1 map for a single slice of the tibia specimen are shown in Fig. 3. Perpendicular to the cartilage surface, the T1 and the k map in cartilage vary smoothly and in opposite directions. The MTR is relatively flat in comparison, and the BPF map shows a heterogeneous structure which cannot be seen in any of the other qMT maps.
Figure 3.
A single slice from a tibia specimen, imaged using the CRI protocol. The in-plane resolution is 0.8 × 0.8 mm, and the slice thickness is 3 mm. Shown are a T1 map (top left), MTR map (top right), k map (bottom left) and BPF map (bottom right).
The correlations of all computed parameters with sGAG/WW and hydroxyproline/WW for the individual specimens are reported in Table 1.
Table 1.
Correlation of the qMT parameters with sGAG/WW and hydroxyproline/WW in articular cartilage for each of the specimens, reported as Pearson’s correlation coefficients. The statistical significance of each correlation is shown in parenthesis, and all correlations with p < .05 are shown in bold.
| qMT | Patella 1 | Patella 2 | Patella 3 | Tibia | ||||
|---|---|---|---|---|---|---|---|---|
| sGAG/WW | hyp/WW | sGAG/WW | hyp/WW | sGAG/WW | hyp/WW | sGAG/WW | hyp/WW | |
| MTR | −.11 (.72) | −.4 (.16) | .25 (.39) | −.11(.71) | −.17 (.55) | .55(< .05) | .12 (.97) | .12 (.75) |
| BPF | .85(< .05) | .73(< .05) | .84(< .05) | .63(< .05) | .58(< .05) | −.34 (.24) | .7(< .05) | .01 (.99) |
| k(s−1) | .72(< .05) | .39(< .05) | .92(< .05) | .41(< .05) | .65(< .05) | .14 (.63) | .64(< .05) | .15 (.68) |
| T1(s) | −.86(< .05) | −.55(< .05) | −.71(< .05) | −.54(< .05) | −.76(< .05) | .11 (.7) | −.86(< .05) | .12 (.75) |
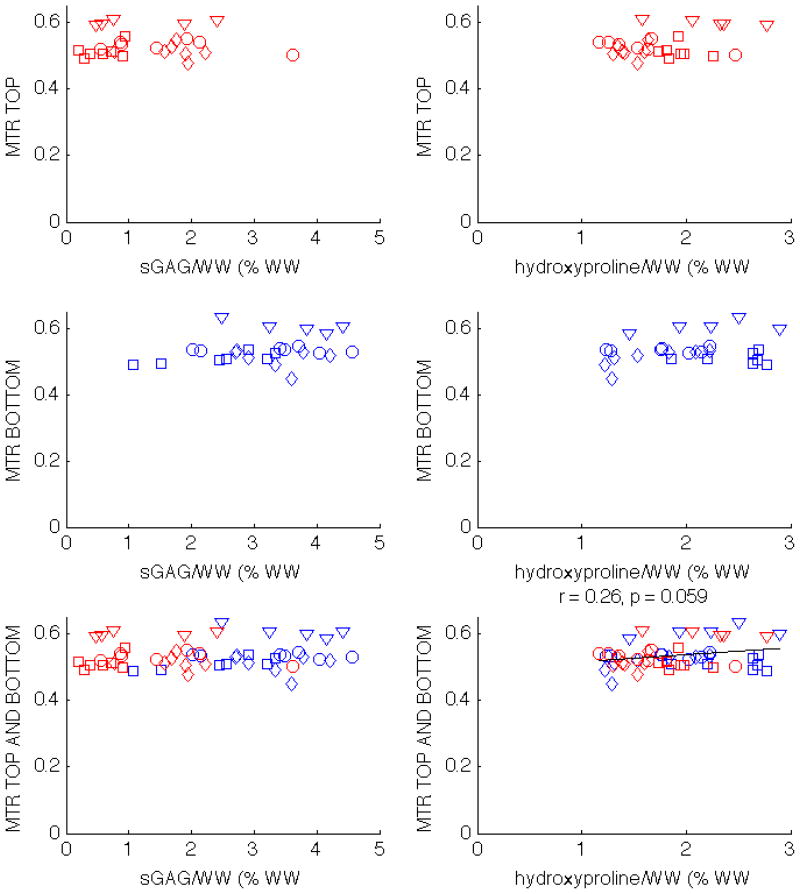
There was no statistically significant correlation between MTR and sGAG/WW, and there was only a minor correlation between MTR and hydroxyproline/WW when the top and bottom half plugs were considered together (Tab. 1, Fig. 4). When the plugs were split into top and bottom groups, all correlations of MTR with macromolecular content disappeared.
Figure 4.
Scatter plots showing the correlations of MTR with sGAG/WW and hydroxyproline/WW in patella 1 (circles), patella 2 (squares), patella 3 (diamonds), and tibia (triangles). MTR does not correlate with sGAG/WW. There is a minor correlation between MTR and collagen, but only when the top and bottom half plugs are analyzed together.
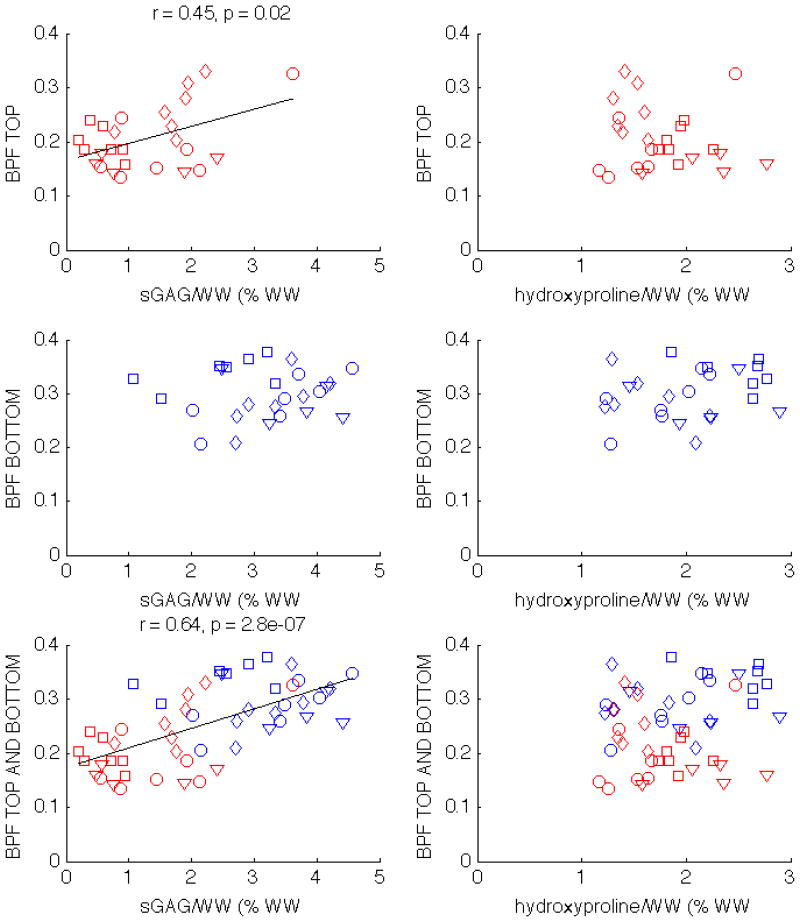
Unlike MTR, BPF is correlated with sGAG/WW for all individual specimens, and there is also a statistically signifcant correlation with hydroxyproline/WW in two of the specimens, as can be seen in Tab. 1. When both top and bottom plugs are considered together, BPF is moderately correlated with sGAG/WW (r = 0.64, p < 0.01), but not with hydroxyproline/WW, as can be seen in the bottom row of Fig. 5. The correlation changes when the top and bottom halves are reported separately. For the top half plugs, the correlation between BPF and sGAG/WW decreases but remains statistically significant (r = 0.45, p = 0.02); the correlation is not significant for the bottom half plugs. The BPF correlation with hydroxyproline/WW does not exist when the plugs are separated into top and bottom halves.
Figure 5.
Scatter plots showing the correlations of BPF with sGAG/WW and hydroxyproline/WW in patella 1 (circles), patella 2 (squares), patella 3 (diamonds), and tibia (triangles). The correlations with statistical significance are displayed above the corresponding subplot. BPF correlates with sGAG/WW when only the top half plugs are considered, as well as when both top and bottom halves are analyzed together.
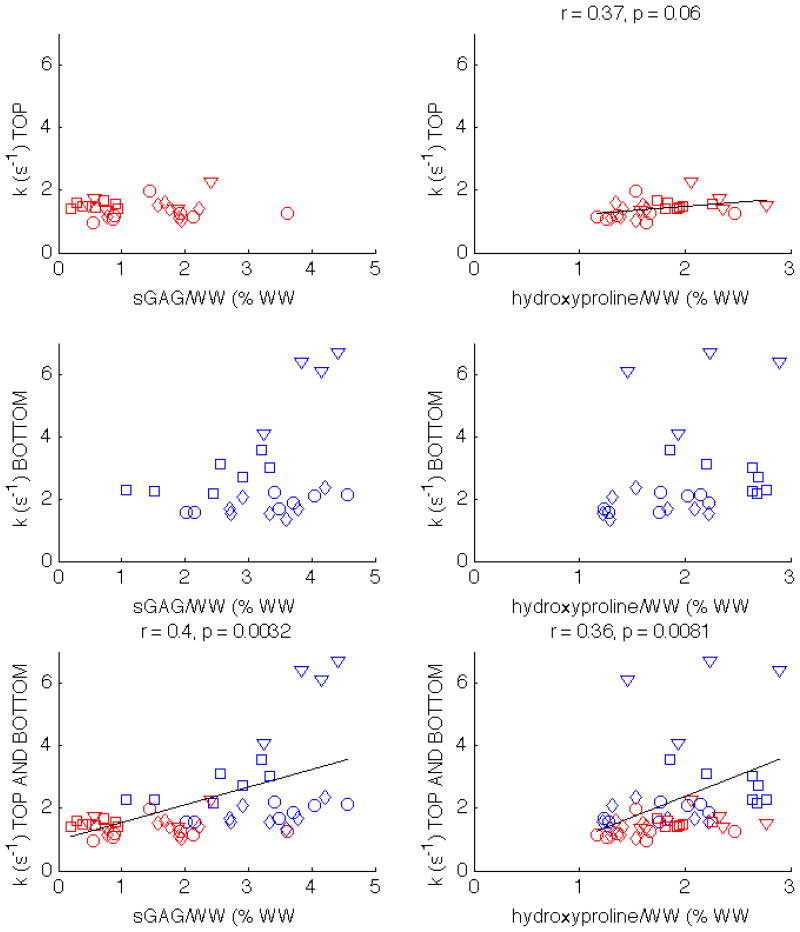
The correlations for k are similar to those for BPF, as shown in Tab. 1 and the bottom row of Fig. 6. However, while BPF was correlated with sGAG/WW in the top half plugs (Fig. 5), k is correlated with hydroxyproline/WW in the top half plugs (r = 0.37, p = 0.06). When top and bottom half plugs are analyzed together, k remains moderately correlated with both sGAG/WW and hydroxyproline/WW.
Figure 6.
Scatter plots showing the correlations of k with sGAG/WW and hydroxyproline/WW in patella 1 (circles), patella 2 (squares), patella 3 (diamonds), and tibia (triangles). The correlations with statistical significance are displayed above the corresponding subplot. k correlates with hydroxyproline/WW when only the top half plugs are considered, as well as when both top and bottom halves are analyzed together.
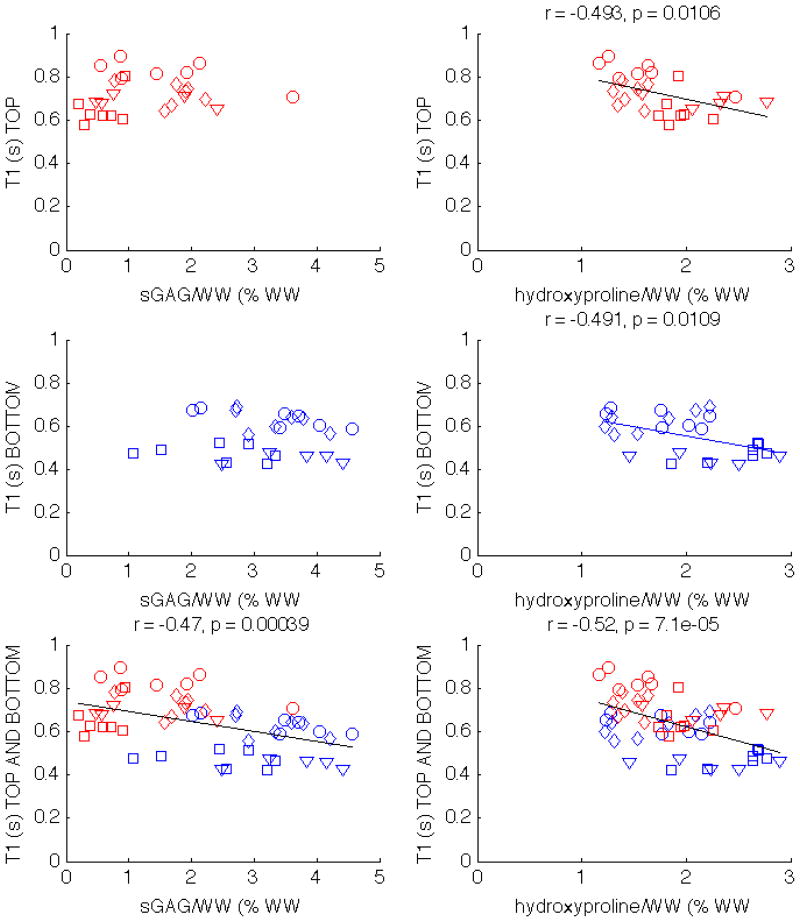
T1 is negatively correlated with sGAG/WW for all four specimens, and two of the specimens show a moderate negative correlation with hydroxyproline/WW (Tab. 1). The correlation exists when the top and bottom plugs from all specimens are combined (bottom row of Fig. 7). The correlations with hydroxyproline are preserved when the plugs are split in top (r = −.493, p = .0106) and bottom groups (r = −.491, p = .0109), as can be seen in the right column of Fig. 7. Unlike hydroxyproline/WW, the correlations between T1 and sGAG/WW are only present when both top and bottom half plugs are considered together, but do not exist when the plugs are split between top and bottom.
Figure 7.
Scatter plots showing the correlations of T1 with sGAG and hydroxyproline in patella 1 (circles), patella 2 (squares), patella 3 (diamonds), and tibia (triangles). The correlations with statistical significance are displayed above the corresponding subplot. T1 correlates with hydroxyproline/WW regardless of whether the top and bottom half plugs are considered together or separately.
4 Discussion and Conclusions
Figure 4 confirms that the proteoglycan contribution to MTR is very small (27,30). Gray et al. showed that MTR increases as collagen concentration goes up, but at high concentrations, such as those found in tissue, the dependence of S/S0 on collagen is small (27). This is consistent with the small correlation observed when top and bottom samples are considered together. The correlation disappears when the samples are considered separately.
The relative insensitivity of MTR with respect to collagen and proteoglycan may be explained by our other results. MTR is proportional to T1, BPF and k (25, 31). While BPF and k increase from the cartilage surface to the bone, T1 varies in the opposite direction (Fig. 3). The opposing trend between T1 and the cross-relaxation maps (k and BPF) results in a small dynamic range for MTR, which could be the reason for the flatness of the MTR maps, compared to the maps of the individual CRI parameters. This motivates the investigation of other CRI parameters and how they relate to macromolecular content. In addition to decoupling the MTR into several components, the CRI parameters make it possible to compute the MTR at different offset frequencies and for different MT pulse powers, thus removing any dependence of the measurement on the MT pulse sequence.
As can be seen from Table 1, the four individual specimens show a statistically significant correlation between sGAG/WW concentration and the CRI parameters. The correlations between sGAG/WW and BPF and k are in agreement with the findings of Li et al. (40).
One concern with our study is whether or not the presented correlations were simply a result of the natural variation between top and bottom layers of cartilage. When the top and bottom halves of the plugs are examined separately, the BPF correlations with sGAG/WW in the bottom group of plugs does not exist, but there is a statistically significant correlation in the top group (left column of Fig. 5). This shows that the correlations are not just driven by gross differences between the top and bottom layers of cartilage.
The correlations of qMT with hydroxyproline/WW within an individual specimen are not as strong as the correlations with sGAG/WW (Table 1). There is no statistical significance for the third patella and the tibia, so it is difficult to make a conclusive statement about the ability of qMT to measure collagen concentration. Hydroxyproline/WW is positively correlated with k (bottom row of Fig. 6) and negatively correlated with T1 (bottom row of Fig. 7). There are no correlations between hydroxyproline/WW and BPF, nor between hydroxyproline/WW and the k values for the bottom layer. However, there is a statistically significant correlation between k and hydroxyproline/WW for the top layer (right column, top row of Fig. 6). This is in accordance with the findings of Henkelman et al., who showed that MT exchange decreases with collagen damage (30). Therefore, BPF may be an indicator of proteoglycan content, and k may measure collagen concentrations.
The T1 relaxation time is negatively correlated both with sGAG/WW and with hydroxyproline/WW for all cartilage samples (bottom row of Fig. 7). When examining the top and bottom half plugs independently, the T1 relaxation time does not correlate with sGAG/WW. Bashir et al. (4) measured the T1 parameter across specimens and also found no significant correlation with proteoglycan content. The correlation of T1 with sGAG/WW that we observed when top and bottom plugs were analyzed together is most likely a result of the gross differences between the two groups of plugs. Hydroxyproline/WW and T1 relaxation time are statistically significantly correlated even when the top and bottom plugs are analyzed separately (right column of Fig. 7).
Cross-relaxation imaging is not the only MT method sensitive to macromolecular concentration in tissue. Ling et al. have developed a method (gagCEST) whose specificity to GAG has been validated with sodium MRI (37). Both cross-relaxation imaging and gagCEST rely on sampling the z-spectrum of cartilage. Cross-relaxation samples a much wider range of frequencies than gagCEST, which can explain why the cross-relaxation metrics are influenced by other macromolecules such as collagen.
Our two-pool model does not assign separate pools to collagen and proteoglycan. For better specificity to the different macromolecular pools, a three-pool model, such as the one proposed by (48) would be better suited. However, including more pools in the model increases the acquisition and processing complexity, so it is worth exploring to what extent the BPF and k in our model are decoupled, and why these two parameters are correlated with different macromolecules.
Cartilage structure may contribute to the MT effect in cartilage, and biochemical analysis of cartilage macromolecules provides only concentration and not structural information. Comparison of MT maps to a quantitative histology method for GAG, such as normalized carbohydrate region absorption (49), and collagen, such as polarized light microscopy (16), could overcome this limitation.
Another limitation of our method is that the fixed a priori parameters and might be dependent on the cartilage region considered, and the temperature at which the cartilage is imaged. The fact that our correlations are better for the top halves of plugs indicates that our model might be better suited to explaining the variations near the cartilage surface. The foci of high k and BPF near the subchondral bone may also be artifacts of partial voluming, which can lead to errors in the parameter fits. However, even after we removed from our ROI analysis the voxels closest to the bone, some bottom plugs from the tibia had very high k values (middle row of Fig. 6), which could indicate differences between tibial and patellar cartilage.
In order to decrease the scan time, we acquired only four MT points; undersampling the z-spectrum may miss non-linear behavior between the sampled points and may reduce the accuracy of the measurement. Increasing the number of z-spectrum samples to 27 points (Fig. 1) resulted in a robust fit, but the scan time increased to almost two hours. One way to improve the robustness of the measurements would be to consider taking an ROI of the entire top region and the entire bottom region separately, effectively reducing each cartilage sample to two data points. While this would result in less noise in the maps, it would remove information about the regional variations within a single specimen, so in this study we focused on a local ROI analysis. With the current imaging parameters the method has a scan time of 15 minutes, suitable for in vivo imaging.
In conclusion, cross-relaxation imaging shows that qMT parameters can be used as biomarkers for evaluating proteoglycan and collagen content in cartilage. Our model is more sensitive to macromolecular content in the top layers of cartilage, with BPF correlating better with sGAG/WW and k and T1 correlating better with hydroxyproline/WW. The method remains to be explored in vivo, but it is a promising new way of imaging cartilage that could be useful in early diagnosis of osteoarthritis.
Acknowledgments
The authors would like to thank Jöelle Barral, Kim Desmond and Greg Stanisz for useful discussions and help with the manuscript.
This work was supported by the NIH (EB002524, EB005790, EB006471), GE Healthcare, and the Bio-X Student Fellowship
References
- 1.LeRoux MA, Arokoski J, Vail TP, Guilak F, Hyttinen MM, Kiviranta I, Setton LA. Simultaneous changes in the mechanical properties, quantitative collagen organization, and proteoglycan concentration of articular cartilage following canine meniscectomy. J Orthop Res. 2000;18:383–392. doi: 10.1002/jor.1100180309. [DOI] [PubMed] [Google Scholar]
- 2.Maroudas A, Thomas H. A simple physicochemical micromethod for determining fixed anionic groups in connective tissue. Biochim Biophys Acta. 1970;215:214–6. [PubMed] [Google Scholar]
- 3.Stanisz GJ, Odrobina EE, Pun J, Escaravage M, Graham SJ, Bronskill MJ, Henkelman RM. T1, T2 relaxation and magnetization transfer in tissue at 3T. Magn Reson Med. 2005;54:507–512. doi: 10.1002/mrm.20605. [DOI] [PubMed] [Google Scholar]
- 4.Bashir A, Gray ML, Hartke J, Burstein D. Nondestructive imaging of human cartilage glycosaminoglycan concentration by MRI. Magn Reson Med. 1999;41:857–865. doi: 10.1002/(sici)1522-2594(199905)41:5<857::aid-mrm1>3.0.co;2-e. [DOI] [PubMed] [Google Scholar]
- 5.Duvvuri U, Reddy R, Patel SD, Kaufman JH, Kneeland JB, Leigh JS. T1ρ-relaxation in articular cartilage: effects of enzymatic degradation. Magn Reson Med. 1997;38:863–7. doi: 10.1002/mrm.1910380602. [DOI] [PubMed] [Google Scholar]
- 6.Bashir A, Gray ML, Boutin RD, Burstein D. Glycosaminoglycan in articular cartilage: in vivo assessment with delayed Gd(DTPA)(2−)-enhanced MR imaging. Radiology. 1997;205:551–8. doi: 10.1148/radiology.205.2.9356644. [DOI] [PubMed] [Google Scholar]
- 7.Regatte RR, Akella SVS, Borthakur A, Reddy R. Proton spin-lock ratio imaging for quantitation of glycosaminoglycans in articular cartilage. J Magn Reson Imaging. 2003;17:114–121. doi: 10.1002/jmri.10228. [DOI] [PubMed] [Google Scholar]
- 8.Akella SV, Regatte RR, Gougoutas AJ, Borthakur A, Shapiro EM, Kneeland JB, Leigh JS, Reddy R. Proteoglycan-induced changes in T1ρ-relaxation of articular cartilage at 4T. Magn Reson Med. 2001;46:419–23. doi: 10.1002/mrm.1208. [DOI] [PubMed] [Google Scholar]
- 9.Wheaton AJ, Dodge GR, Elliott DM, Nicoll SB, Reddy R. Quantification of cartilage biomechanical and biochemical properties via T1ρ magnetic resonance imaging. Magn Reson Med. 2005;54:1087–93. doi: 10.1002/mrm.20678. [DOI] [PubMed] [Google Scholar]
- 10.Menezes NM, Gray ML, Hartke JR, Burstein D. T2 and T1rho MRI in articular cartilage systems. Magn Reson Med. 2004;51:503–509. doi: 10.1002/mrm.10710. [DOI] [PubMed] [Google Scholar]
- 11.Dardzinski BJ, Mosher TJ, Li S, VanSlyke MA, Smith MB. Spatial variation of T2 in human articular cartilage. Radiology. 1997;205:546–50. doi: 10.1148/radiology.205.2.9356643. [DOI] [PubMed] [Google Scholar]
- 12.Nieminen MT, Töyräs J, Laasanen MS, Silvennoinen J, Helminen HJ, Jurvelin JS. Prediction of biomechanical properties of articular cartilage with quantitative magnetic resonance imaging. J Biomech. 2004;37:321–8. doi: 10.1016/s0021-9290(03)00291-4. [DOI] [PubMed] [Google Scholar]
- 13.Borthakur A, Shapiro EM, Beers J, Kudchodkar S, Kneeland JB, Reddy R. Sensitivity of MRI to proteoglycan depletion in cartilage: comparison of sodium and proton MRI. Osteoarthritis Cartilage. 2000;8:288–293. doi: 10.1053/joca.1999.0303. [DOI] [PubMed] [Google Scholar]
- 14.Wayne JS, Kraft KA, Shields KJ, Yin C, Owen JR, Disler DG. MR imaging of normal and matrix-depleted cartilage: correlation with biomechanical function and biochemical composition. Radiology. 2003;228:493–499. doi: 10.1148/radiol.2282012012. [DOI] [PubMed] [Google Scholar]
- 15.Xia Y, Moody JB, Burton-Wurster N, Lust G. Quantitative in situ correlation between microscopic MRI and polarized light microscopy studies of articular cartilage. Osteoarthritis Cartilage. 2001;9:393–406. doi: 10.1053/joca.2000.0405. [DOI] [PubMed] [Google Scholar]
- 16.Nieminen MT, Rieppo J, Toyras J, Hakumaki JM, Silvennoinen J, Hyttinen MM, Helminen HJ, Jurvelin JS. T2 relaxation reveals spatial collagen architecture in articular cartilage: a comparative quantitative MRI and polarized light microscopic study. Magn Reson Med. 2001;46:487–493. doi: 10.1002/mrm.1218. [DOI] [PubMed] [Google Scholar]
- 17.Nissi MJ, Rieppo J, Toyras J, Laasanen MS, Kiviranta I, Jurvelin JS, Nieminen MT. T(2) relaxation time mapping reveals age- and species-related diversity of collagen network architecture in articular cartilage. Osteoarthritis Cartilage. 2006;14:1265–1271. doi: 10.1016/j.joca.2006.06.002. [DOI] [PubMed] [Google Scholar]
- 18.Henkelman RM, Stanisz GJ, Kim JK, Bronskill MJ. Anisotropy of NMR properties of tissues. Magn Reson Med. 1994;32:592–601. doi: 10.1002/mrm.1910320508. [DOI] [PubMed] [Google Scholar]
- 19.Ghiassi-Nejad M, Torzilli PA, Peemoeller H, Pintar MM. Proton spin-spin relaxation study of molecular dynamics and proteoglycan hydration in articular cartilage. Biomaterials. 2000;21:2089–2095. doi: 10.1016/s0142-9612(00)00140-x. [DOI] [PubMed] [Google Scholar]
- 20.Mlynarik V, Szomolanyi P, Toffanin R, Vittur F, Trattnig S. Transverse relaxation mechanisms in articular cartilage. J Magn Reson. 2004;169:300–307. doi: 10.1016/j.jmr.2004.05.003. [DOI] [PubMed] [Google Scholar]
- 21.Reiter DA, Lin PC, Fishbein KW, Spencer RG. Multicomponent T2 relaxation analysis in cartilage. Magn Reson Med. 2009;61:803–809. doi: 10.1002/mrm.21926. [DOI] [PMC free article] [PubMed] [Google Scholar]
- 22.Wolff SD, Balaban RS. Magnetization transfer contrast (MTC) and tissue water proton relaxation in vivo. Magn Reson Med. 1989;10:135–144. doi: 10.1002/mrm.1910100113. [DOI] [PubMed] [Google Scholar]
- 23.Guivel-Scharen V, Sinnwell T, Wolff SD, Balaban RS. Detection of proton chemical exchange between metabolites and water in biological tissues. J Magn Reson. 1998;133:36–45. doi: 10.1006/jmre.1998.1440. [DOI] [PubMed] [Google Scholar]
- 24.Ward KM, Aletras AH, Balaban RS. A new class of contrast agents for MRI based on proton chemical exchange dependent saturation transfer (CEST) J Magn Reson. 2000;143:79–87. doi: 10.1006/jmre.1999.1956. [DOI] [PubMed] [Google Scholar]
- 25.Henkelman RM, Stanisz GJ, Graham SJ. Magnetization transfer in MRI: a review. NMR Biomed. 2001;14:57–64. doi: 10.1002/nbm.683. [DOI] [PubMed] [Google Scholar]
- 26.Kim DK, Ceckler TL, Hascall VC, Calabro A, Balaban RS. Analysis of water-macromolecule proton magnetization transfer in articular cartilage. Magn Reson Med. 1993;29:211–215. doi: 10.1002/mrm.1910290209. [DOI] [PubMed] [Google Scholar]
- 27.Gray ML, Burstein D, Lesperance LM, Gehrke L. Magnetization transfer in cartilage and its constituent macromolecules. Magn Reson Med. 1995;34:319–325. doi: 10.1002/mrm.1910340307. [DOI] [PubMed] [Google Scholar]
- 28.Lattanzio PJ, Marshall KW, Damyanovich AZ, Peemoeller H. Macromolecule and water magnetization exchange modeling in articular cartilage. Magn Reson Med. 2000;44:840–851. doi: 10.1002/1522-2594(200012)44:6<840::aid-mrm4>3.0.co;2-k. [DOI] [PubMed] [Google Scholar]
- 29.Dousset V, Grossman RI, Ramer KN, Schnall MD, Young LH, Gonzalez-Scarano F, Lavi E, Cohen JA. Experimental allergic encephalomyelitis and multiple sclerosis: lesion characterization with magnetization transfer imaging. Radiology. 1992;182:483–491. doi: 10.1148/radiology.182.2.1732968. [DOI] [PubMed] [Google Scholar]
- 30.Henkelman RM, Stanisz GJ, Menezes N, Burstein D. Can MTR be used to assess cartilage in the presence of Gd-DTPA2-? Magn Reson Med. 2002;48:1081–1084. doi: 10.1002/mrm.10322. [DOI] [PubMed] [Google Scholar]
- 31.Tofts P. Quantitative MRI of the brain: measuring changes caused by disease. Wiley: Chichester, West Sussex; 2003. [Google Scholar]
- 32.Sled JG, Pike GB. Quantitative imaging of magnetization transfer exchange and relaxation properties in vivo using MRI. Magn Reson Med. 2001;46:923–931. doi: 10.1002/mrm.1278. [DOI] [PubMed] [Google Scholar]
- 33.Ramani A, Dalton C, Miller DH, Tofts PS, Barker GJ. Precise estimate of fundamental in vivo MT parameters in human brain in clinically feasible times. Magn Reson Imaging. 2002;20:721–731. doi: 10.1016/s0730-725x(02)00598-2. [DOI] [PubMed] [Google Scholar]
- 34.Yarnykh VL. Pulsed Z-spectroscopic imaging of cross-relaxation parameters in tissues for human MRI: theory and clinical applications. Magn Reson Med. 2002;47:929–939. doi: 10.1002/mrm.10120. [DOI] [PubMed] [Google Scholar]
- 35.Gloor M, Scheffler K, Bieri O. Quantitative magnetization transfer imaging using balanced SSFP. Magn Reson Med. 2008;60:691–700. doi: 10.1002/mrm.21705. [DOI] [PubMed] [Google Scholar]
- 36.Cercignani M, Barker GJ. A comparison between equations describing in vivo MT: the effects of noise and sequence parameters. J Magn Reson. 2008;191:171–83. doi: 10.1016/j.jmr.2007.12.012. [DOI] [PMC free article] [PubMed] [Google Scholar]
- 37.Ling W, Regatte RR, Navon G, Jerschow A. Assessment of glycosaminoglycan concentration in vivo by chemical exchange-dependent saturation transfer (gagCEST) Proc Natl Acad Sci USA. 2008;105:2266–2270. doi: 10.1073/pnas.0707666105. [DOI] [PMC free article] [PubMed] [Google Scholar]
- 38.Li W, Li J, Muehleman C, Magin R. Reduction of the magic angle effect on contrast in magnetization transfer imaging of human cartilage. Proc Intl Soc Magn Reson Med. 2009;17:3963. [Google Scholar]
- 39.Gloor M, Bieri O, Mamisch G, Welsch S, Trattnig K, Scheffler K. Quantitative magnetization transfer SSFP cartilage imaging. ISMRM Workshop on Advances in Musculoskeletal Magnetic Resonance Imaging. 2009;1:1009. [Google Scholar]
- 40.Li W, Hong L, Zhang G, Magin R. Quantitative magnetization transfer imaging for evaluating the tissue-engineered cartilage. Proc Intl Soc Magn Reson Med. 2008;16:1716. [Google Scholar]
- 41.Yarnykh VL, Yuan C. Cross-relaxation imaging reveals detailed anatomy of white matter fiber tracts in the human brain. Neuroimage. 2004;23:409–424. doi: 10.1016/j.neuroimage.2004.04.029. [DOI] [PubMed] [Google Scholar]
- 42.Fram EK, Herfkens RJ, Johnson GA, Glover GH, Karis JP, Shimakawa A, Perkins TG, Pelc NJ. Rapid calculation of T1 using variable flip angle gradient refocused imaging. Magn Reson Imaging. 1987;5:201–208. doi: 10.1016/0730-725x(87)90021-x. [DOI] [PubMed] [Google Scholar]
- 43.Lammentausta E, Kiviranta P, Nissi MJ, Laasanen MS, Kiviranta I, Nieminen MT, Jurvelin JS. T2 relaxation time and delayed gadolinium-enhanced MRI of cartilage (dGEMRIC) of human patellar cartilage at 1.5 T and 9.4 T: Relationships with tissue mechanical properties. J Orthop Res. 2006;24:366–374. doi: 10.1002/jor.20041. [DOI] [PubMed] [Google Scholar]
- 44.Farndale RW, Sayers CA, Barrett AJ. A direct spectrophotometric microassay for sulfated glycosaminoglycans in cartilage cultures. Connect Tissue Res. 1982;9:247–248. doi: 10.3109/03008208209160269. [DOI] [PubMed] [Google Scholar]
- 45.Bergman I, Loxley R. The determination of hydroxyproline in urine hydrolysates. Clin Chim Acta. 1970;27:347–349. doi: 10.1016/0009-8981(70)90355-4. [DOI] [PubMed] [Google Scholar]
- 46.Smith RL, Thomas KD, Schurman DJ, Carter DR, Wong M, van der Meulen MC. Rabbit knee immobilization: bone remodeling precedes cartilage degradation. J Orthop Res. 1992;10:88–95. doi: 10.1002/jor.1100100111. [DOI] [PubMed] [Google Scholar]
- 47.Woessner M. The methodology of connective tissue research. Chapter 23. Oxford: Joynson-Bruvvers Limited; 1976. Determination of hydroxyproline content in connective tissues. [Google Scholar]
- 48.Tessier JJ, Dillon N, Carpenter TA, Hall LD. Interpretation of magnetization transfer and proton cross-relaxation spectra of biological tissues. J Magn Reson B. 1995;107:138–144. doi: 10.1006/jmrb.1995.1069. [DOI] [PubMed] [Google Scholar]
- 49.Saarakkala S, Julkunen P, Kiviranta P, Makitalo J, Jurvelin JS, Korhonen RK. Depth-wise progression of osteoarthritis in human articular cartilage: investigation of composition, structure and biomechanics. Osteoarthritis Cartilage. 2010;18:73–81. doi: 10.1016/j.joca.2009.08.003. [DOI] [PubMed] [Google Scholar]


