

Abstract
Oligodeoxyfluorosides (ODFs) are short DNA-like oligomers in which DNA bases are replaced with fluorophores. A preliminary study reported that some sequences of ODFs were able to respond to a few organic small molecules in the vapor phase, giving a change in fluorescence. Here we follow up on this finding by investigating a larger range of volatile organic analytes, and a considerably larger set of sensors. A library of tetramer ODFs of 2401 different sequences was prepared using combinatorial methods, and was screened in air for fluorescence responses to a set of ten different volatile organics, including multiple aromatic and aliphatic compounds, acids and bases, varied functional groups and closely related structures. Nineteen responding sensors were selected and characterized; these were cross-screened against all ten analytes, and responses were measured qualitatively (by changes in color and intensity) and quantitatively (by measuring Δ(R,G,B) values averaged over 5–6 sensor beads). The results show that sensor responses were diverse, with a single sensor responding differently to as many as eight of the ten analytes; multiple classes of responses were seen, including quenching, lighting up, and varied shifts in wavelength. Responses were strong, with raw Δ(R,G,B) values of as high as >200 on a 256-unit scale and unamplified changes in many cases apparent to the naked eye. Sensors were identified that could distinguish clearly between even very closely related compounds such as acrolein and acrylonitrile. Statistical methods were applied to select a small set of four sensors that, as a pattern response, could distinguish between all ten analytes with high confidence. Sequence analysis of the full set of sensors suggested that sequence/order of the monomer components, and not merely composition, was highly important in the responses.
Keywords: Fluorescence, Oligonucleotides, Sensors, Organic compounds, Vapors
Introduction
Optical vapor sensors have been under intense study over the last decade with the development of novel materials such as conjugated polymers and cross-reactive chemical sensor arrays.[1–3] Detecting small molecules in the vapor phase is not only of scientific interest, but is also finding practical applications in natural signalling, environmental monitoring, industrial quality control, in medicine, and in security.[4–6] The literature describes many examples of sensor design strategies using one or a few types of sensor molecules yielding color or fluorescence changes.[7–14] Some advanced designs include polymers films functionalized with dyes, dye-labeled biopolymers, and optical-fiber arrays.[15–17] Sensors built from conjugated polymers such as polyphenyleneethynylenes with integrated pentiptycene moieties have shown high sensitivity in detecting vapors of nitroaromatic compounds by efficient quenching.[3, 18–20] New approaches based on conductance properties have employed single-walled carbon nanotubes loaded with polythiophene to target chemical warfare agent precursors.[21, 22]
In order to address limited diversity of sensing, colorimetric cross-reactive chemical arrays made from chemically responsive dyes have also been developed. One such approach involves arrays of nanoporous pigments, which provide patterns of color changes modulated by analyte-dye interaction.[12, 23] Although such absorbance-based methods for vapor detection have shown good success, fluorescence-based methods may offer higher sensitivity, due to the high dynamic range of photon emission from fluorophores. Moreover, in some current approaches, the difficulty of synthesis of a varied set of sensor molecules and the lack of flexibility in conjugating them to supports can restrict their general utility. Additionally, hybrid materials such as polymers doped with dyes may undergo leaching, resulting in lower durability of the system.[24] Finally, many of the current approaches to sensor development and discovery are limited by a relatively small set of sensor materials.
In order to address some of these limitations, we have recently undertaken the study of a new class of sensor molecules built by assembling multiple fluorophores on a DNA backbone.[25] In a preliminary report, we found that oligomeric DNA-like polyfluorophores (ODFs) on PEG-polystyrene beads could behave as vapor sensors with varied responses beyond simple quenching to a set of four organic analytes. Based on the early results, we were motivated to apply this sensor strategy to a broader range of analytes to test the generality of sensor response to a wider variety of chemical structures. Second, we wished to determine whether sensors could distinguish between more closely related organic analytes. Third, we wished to analyze a larger diversity of sensor sequences to begin to tease out the mechanisms of sensor response.
Here we report the screening of an ODF library of 2401 compounds on PEG-PS beads for an expanded range of ten small-molecule analytes, included acids, bases, aromatics and aliphatics, electron-rich and -poor species, and containing varied functional groups, including a number of toxic compounds. We selected nineteen responding sensors and characterized their responses to all analytes, providing 190 cross-reactive responses. We have used both qualitative and quantitative measures of sensor response, and have applied statistical methods to group sensors and responses, allowing us to select a small number of sensors that can distinguish clearly between all ten analytes. Based on the larger sequence set, we were also able to begin to obtain useful information regarding mechanism and sensitivity of sensing. We find that ODFs have diverse and strong sensing responses for chemically varied vapor analytes, even with closely related molecules. Moreover, ODFs can be synthesized directly on the solid support rapidly and easily from a small number of building blocks, and they can be rapidly screened for identification of efficient sensors.
Results and Discussion
Library Synthesis
The tetramer ODF library was constructed on 130 μm amine-functionalized PEG-polystyrene beads using standard split-and-mix methods as previously reported.[26] Monomers included in the library included four fluorophores (Y, E, B, K (Fig. 1), an abasic spacer (S), a spacer/hydrogen bonding element (dihydrothymidine, H), and a nitroindole quencher (I). This yielded 2401 ODF sequences in all combinations, in which each bead contained one specific tetramer structure. The monomers incorporated were encoded by binary chemical encoding methodology,[28] so that a sequence could ultimately be decoded from each individual bead that was selected during the screening.
Figure 1.

A) Fluorescent and non-fluorescent monomers employed as components of the library; B) and C) Examples of sensors (5'-Y-E-H-H-3') and (5'-Y-Y-E-K-3'), attached by an amide linkage to PEG-PS beads. Note that ODF sequences are listed in 5' to 3' direction in analogy to DNA.
Analytes
For this study we included ten small volatile small molecules in the screening and analysis. Four of these were tested in a preliminary study and found to induce sequence-based responses (acrolein, mesitylene, nitrobenzene, and propionic acid).[25] To provide a broader test of chemical range and of selectivity in the sensors, we included six new compounds along with this previous set. To test selectivity we included closely related unsaturated compounds, acrylonitrile and acrolein, and similarly-sized aliphatics with polar functional groups (propionic acid and ethylisocyanate). We included two small-molecule aliphatic methyl donors (methyl iodide and dimethylmethylphosphonate (DMMP). To supplement the previous two aromatics (nitrobenzene and mesitylene) we added a second electron-rich aromatic compound (aniline) to compare with mesitylene, and an electron-poor example (2,6-lutidine) to compare with nitrobenzene.
Screening Results
To evaluate sensing capabilities in ODF library members, a closed chamber was designed using a quartz fluorescence cell in which beads from the library were placed onto a small microscope slide. The beads were exposed to one drop (4 μL) of analyte adjacent to the slide and inside the cell, which was then capped. Concentrations of analytes were estimated based on their saturated vapor pressure in the closed chamber at 23 °C (see SI, Table S2 for concentrations), and ranged from 200 to 500,000 ppm. Fluorescence was monitored under an epifluorescence microscope using excitation 340–380 nm and observing all visible emission (long-pass filter, > 400 nm). Images were taken before and after 2 min, 7 min, and 30 min of exposure to the vapor in the chamber at ambient temperature. Although responses were already observed after 2 min in many cases, we carried out further analyses at the 30 min time point to allow for equilibration.
We used a simple image-processing method to analyze changes in emission in response to analytes. Commercial image-processing software was used to invert color/intensity of the image before exposure (making a photo-negative). This was merged with the image taken after 30 min of exposure using 50/50 blending of the two (see SI for details). A representative image of the library members before and after exposure, including the image process is shown in Figure 3. This difference image enables an easy visualization of the effect of the small-molecule vapor on the library of tetramers.
Figure 3.

Images of ODF library taken during screening. A. Representative fluorescence image of library. B. Difference image after 30 min exposure to dimethylaniline (DMA), showing the fluorescence changes in response to the vapor. Any part of the difference image that is 50% gray (including background and beads) indicates no change, while beads that are darker than this gray background reveal quenching, brighter beads show emission enhancement, and colors reflect a combination of the original ODF emission color and any wavelength shifts that occur on sensing.
Screening and evaluation of sensing properties of ODFs
Fluorescence responses of many of ODF sequences were observed during screening upon exposure to the 10 analytes. Widely varied responses were evident, including quenching, lighting up, and color shifts (see Fig. 3 and SI for images from screening). For each analyte, at least two strongly responding beads were picked and decoded by gas chromatography. They were then resynthesized via automated oligonucleotide synthesis in a column containing both PEG-polystyrene beads and on controlled pore glass (CPG) packed in the same column. Sequences on CPG were deprotected and characterized by MALDIMS and measured for absorption and emission spectra (see SI).
Sequences resynthesized on PEG-PS beads were retested for sensing responses, and results showed that they correctly reproduced the same sensing response as seen during screening. Although the sensor sequences demonstrated the ability to detect their selected analyte, we wondered whether they could differentiate other analytes, and thus be useful in pattern-based responses (see below). Thus we performed a full cross-screening study of the 19 ODF sequences against all 10 analytes including chemically similar organic molecules. The 190 qualitative results (as shown by difference bead images) are shown in Table 1; quantitative results are discussed later. For reference, raw before/after bead images are given in Table S3.
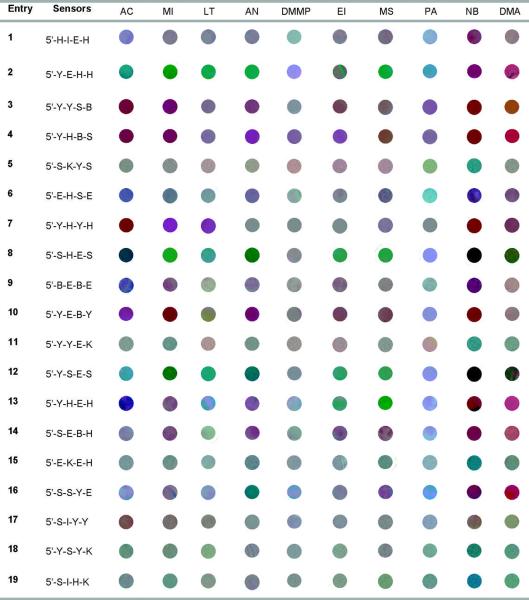
Table 1.
Summary of cross-screening results, listing ODF sequences and their qualitative responses to analyte vapors (as shown by actual blended difference images of beads containing sensor molecules).[a]
|
Analyte abbreviations: AC (acrolein); MI (methyl iodide); LU (2,6-lutidine); AN (acrylonitrile); DMMP (dimethyl-methylphosphonate); EI (ethylisocyanate); MS (mesitylene); PA (propionic acid); NB (nitrobenzene); DMA (dimethylaniline).
Examination of the color-based responses (Table 1) reveals that many sensor sequences showed strong responses to many of the analytes, but with surprisingly varied responses to the different analytes. Strongest-responding tetramers included sequence 2, 4, 8, 12, and 13, which gave marked, non-gray changes with all or nearly all of the analytes. Many of these responses were different; for example, sequence 13 yielded a visibly different color/intensity change for nearly every analyte. In contrast, a few sequences showed strong changes for only two or three analytes; examples included 15, 17, 18, and 19. However, some of these changes were distinct (17 for example) and thus remain useful in pattern responses (see below).
Comparison of responses by analyte showed that some small molecules yielded very strong responses while others produced less pronounced changes. Nitrobenzene, acrolein, dimethylaniline, and methyl iodide induced the strongest fluorescence changes, while DMMP yielded the smallest changes on average; however, even this analyte induced strong changes in 4–5 of the sensors. Importantly, for a given analyte, color/intensity changes were widely varied, indicating a diversity of electronic interactions with the different sensors. Several of the analytes induced at least 6–7 visibly different responses in different sensors.
Quantitative measurement of sensor responses
The sensor responses to the vapor-phase analytes were further investigated quantitatively using RGB color change profiles. The RGB channels were collected for 5 to 6 beads per analyte for each sensor and averaged. A fourth variable, the luminosity (L or Luma)[29], was also added (see SI) to judge lighting up versus quenching responses. We subtracted R,G,B,L values of starting sensors from the values after sensing (30 min) and calculated error limits based on variance of data from the 5–6 sensor beads tested in each case. Color change profiles for all nineteen selected sensors with all ten analytes are given in the SI; four examples are shown in Figure 4. Importantly, the changes in R,G,B values are numerically large; on the ±256 unit scale, many responses approached or exceeded 200 on the quenching side and up to 100 on the lighting-up side.
Figure 4.

A–D; Quantitative color change profiles of sensor sequences 8, 4, 5, 16, showing spectral fluorescence emission changes in response to ten vapors of analytes. Error bars show variance in data averaged over 5–6 sensor beads.
In comparison with qualitative blended difference images in Table 1, the color change profiles more clearly show the spectral changes in the sensors. For example, the color change profile for the sensor 5'-SHES (8) demonstrated selective quenching responses for many analytes, with one channel being quenched while others were less changed. This corresponds to a simultaneous quenching and color change. For example, methyl iodide induced no change in the green wavelengths while causing quenching in the blue and red (Fig. 4A). In contrast, nitrobenzene induced simple quenching across the spectrum, rendering the sensor almost completely dark. Interestingly, the RGB profiles of 5'-YHBS (4) also showed spectrally selective quenching, but different from sensor 8: for some analytes, 4 gave quenching in the blue and green but not red, while other analytes caused quenching only in the green channel. In contrast to these cases, sensors 5'-SKYS (5) and 5'-SSYE (16) yielded markedly different outcomes. Sequence 5 displayed several light-up responses, while sensor 16 yielded a number of color changes without changes in luminosity (for example, quenching of blue with concomitant lighting up in the red).
Sequence analysis gives insight into mechanisms of response
Examination of the molecular components of these 19 sequences yields some useful observations that were not possible with a previous small set of sensors.[25] Overall monomer composition is as follows: B(6), E(15), H(14), I(3), K(5), S(15), Y(18). Thus the fluorophores Y and E are overrepresented in this set and are apparently widely useful in sensing, while fluorophores B and K are underrepresented. The electron-deficient monomer I (nitroindole) is relatively rare; examination of bead images in SI and in Table 1 confirm that sequences containing it were often dark and weakly responding (although still useful in pattern responses; see below). Finally, spacers S and H were quite common in the selected sensors, indicating the separation and/or omission of chromophores can be beneficial to sensing. In addition (for H), the inclusion of a hydrogen-bonding element may also be helpful for detection of some analytes. While a few sensors contained four optically active (i.e., non-spacer) elements, many contained only three or two, and one sequence (5'-SHES (8), a strong responder) contained only a single perylene dye.
Examination of closely related sensor sequences is also useful in analyzing mechanisms of responses. In the set of nineteen sequences there were two sets of anagrams, in which the components are the same but ordering is different. One anagram pair is 5'-YEHH (2) vs 5'-YHEH (13); comparison of color change response profiles (see SI) shows that the two yielded divergent spectral responses, particularly with acrolein, methyl iodide, lutidine and acrylonitrile, where strong quenching in the red was seen only for sensor 2. The second pair is 5'-YSES (12) versus 5'-SSYE (16); these yielded very different spectral changes with methyl iodide, lutidine, mesitylene and ethyl isocyanate. These anagram cases show clearly that the ordering of dyes in the ODFs, and thus the nearest-neighbor chromophore interactions, have strong influences on electronic responses in sensing. We note that in both pairs, one example places perylene and pyrene together (which can result in strong exciplex interactions in the excited state)[30], whereas in the second, a spacer separates them.
Finally, comparison of sensors 5'-YSES (12) and 5'-YHEH (13) yields some insight into the varied roles of the spacers S and H between the chromophores Y and E. Both were strong responders to many analytes; while some analytes produced similar responses in the sensors, some yielded markedly different results (see responses for acrolein, acrylonitrile and methyl iodide). The two sensors have different initial colors (12=white and 13=green; see SI), suggesting that the two spacers separate the dyes with different efficiency; a previous study using H as an “insulator” showed that it more effectively separated electronically interacting species than did S.[31]
Deletion experiments yield insights into the mechanism of sensor 5'-YEHH
As a second approach to investigating the mechanisms of analyte response, we chose tetrameric sensor 2 (5'-YEHH, a particularly strong responder) and synthesized deletion mutants, removing each of the components one at a time, yielding three different trimers. We then tested the sensing responses for these three compounds, which were then compared with those of the parent sensor. Quantitative color change profiles for the four are shown in Figure 5.
Figure 5.

Evaluation of sensing properties for sensor sequence 2 (A) and three deletion variants of the sensor (B,C,D). Quantitative color change profiles show spectral fluorescence emission changes in response to ten vapors of analytes. Error bars show variance in data averaged over 5–6 sensor beads.
Results show that the first of these, 5'-EHH, has many similar responses as the parent sensor. However, three important differences are seen, for analytes lutidine, DMMP, and dimethylaniline. The first two of these induce little or no response in 5'-EHH, which suggests that the pyrene (Y) in sensor 2 is a central contributor to the sensing of these two analytes. For DMA, the deletion mutant shows only quenching, while 2 gives a light-up response in the red channel, again implicating a role for pyrene. The second deletion variant, YHH, is more revealing: every response is different from that of the parent sensor except for that of nitrobenzene. In addition, YHH shows little or no response for 5–6 analytes, whereas YEHH gives moderate to strong responses to all (Figure 5). Thus the results show a crucial role for E (perylene) in the responses of sensor 2. Finally, examination of responses for the third deletion variant (YEH) show that they are quite similar to those of the parent, suggesting that YEH is the active core of the sensor. However, the responses are somewhat smaller in magnitude on average, which suggests that the second H residue plays a role in increasing sensitivity, even for a non-hydrogen-bonding analyte such as mesitylene.
Preliminary test of sensitivity of an ODF sensor
The screening studies were carried out at saturated concentrations of analytes. To begin to test the sensitivity of an ODF at lower analyte concentrations, we selected nitrobenzene and the sensor 5'-SHES (8) from the study. Varied dilutions of analyte vapor/air concentrations were prepared and injected into the chamber, thus testing response at 200, 30, and 3 ppm. As described in the experimental section, images were taken before and after 30 min of exposure and images were then processed to determine color change profiles ΔR, ΔG, ΔB and ΔL. Figure 6 depicts responses of the sensor 8 upon exposure to these varied concentrations in air. The blank refers to the sensor only in presence of air without nitrobenzene vapors, while the saturated response with excess analyte is also shown for comparison.
Figure 6.
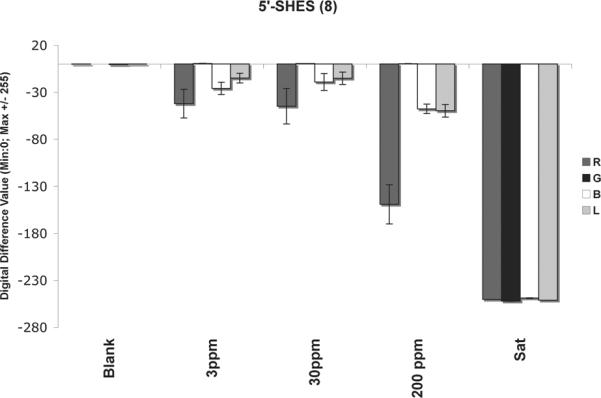
Responses of sensor 8 upon exposure to various concentrations of nitrobenzene in atmospheric air. Reproducibility was obtained by two independent experiments. Error bars show variance in data averaged over 5–6 sensor beads for two experiments.
The concentration-dependent experiments reveal that 200 ppm of nitrobenzene vapors give a marked red and blue quenching in the sensor, with smaller responses than the fully saturated experiment with excess liquid in the chamber. This would suggest that placing 4 μL of nitrobenzene in the chamber maintains oversaturated vapors inside the chamber, which leads to a strongly enhanced quenching, possibly as a result of absorption of additional analyte by the polymer bead. Smaller concentrations of 30 ppm and 3 ppm still show a substantial quenching of the red and blue channels in their color change profiles, clearly distinct from the blank. Thus the preliminary experiment suggests that this sensor can respond to nitrobenzene at concentrations as low as 3 ppm.
Statistical analysis and selection of sets for pattern-based sensing
Although a few of these individual sensors can distinguish most of the analytes alone, the combination of more than one as a group is expected to aid in analyte discrimination by their pattern of responses. To better understand the relationships in the sensor responses, principal component analysis (PCA) and agglomerative hierarchical clustering (AHC) were performed on the full cross-screening data set. PCA allows the scattering of the data to be quantitatively analyzed by plotting the responses on new (non-Euclidean) axes that represent the most orthogonal components. AHC provides an analysis of how the responses of sensors and analytes are similar and different to one another, grouping them into families depending on how dissimilar they are.
First, PCA was employed with all the Δ(R,G,B) values to evaluate the best ODFs capable to discriminate as much analytes as possible. As shown in Figure 7A, the first component F1 accounts for 43.1 % of variance and the second component, F2, accounts for 18.4 % (sum 61.5 %). Three main clusters of sensor behavior are revealed; one is centered along the first component, close to the origin. The second cluster includes the sensors 3, 4, 10 and the third cluster consists of the sensors 2, 8, and 12. Thus, the well-separated responses of those clusters aids in selecting a small set of efficient sensor units.
Figure 7.

A) Principal component analysis plot of 19 ODF sensor responses upon exposure to 10 analytes. B) Agglomerative hierarchical clustering analysis of sensor responses based on the color change profile data.
The hierarchical clustering (AHC) analysis was performed, providing groupings of response and relationships between them by the unweighted pair-group average method. The clustering scheme is based on the squared Euclidean distance between the centroids of the clusters of sensor response. The data generated a dendrogram in which classes of tetramers can be identified based on their pattern responses (Figure 7B). Four most dissimilar classes of sensor responses came out. The first class (highlighted in green) contains four sensors that contain Y and B moieties. The second cluster (in brown) brings together a large group of sensors containing mainly E and Y moieties as well as K and I. The third group (shown in orange) consists of two sequences (sensors 12 and 8), and the last cluster is represented by a single sensor, 2, which revealed good separations in an early study,[25] and which stands alone in its unique response even in this large data set.
Based on these preliminary PCA and AHC analyses, we selected four potential sets of sensors for pattern-based responses from the above most well-separated clusters, and applied chemometric analysis to determine how well each sensor set separated the analytes in the non-Euclidean space: Set A (8, 4, 5, 16), Set B (21, 22, 23), Set C (3, 8, 11), and Set D (3, 8, 2, 17).
The PCA and AHC analysis of these small sensor sets (see Figure 8 and SI) demonstrated well-separated pattern responses. In agreement with the qualitative observations, PCA showed the largest separation of component values for nitrobenzene, which was also consistently seen in the clustering. Acrolein was also well separated in its pattern responses in all sets. On the other hand, mesitylene, acrylonitrile, methyl iodide and and ethyl isocyanate were more closely related to one another in their responses (depending on the sensor set). Interestingly, the subset D (combining sensors 3, 8, 2, and 17) showed the largest component values for the ten analytes, and revealed well-separated responses in the PCA plot (Figure 8A). The AHC dendrogram (Figure 8B) revealed six distinct clusters (one analyte each) and two clusters with two analytes. Importantly, using qualitative and quantitative methods, a combination of four sensors was shown to discriminate among the ten analytes with high confidence.
Figure 8.

Quantitative analysis of pattern response in sensors of set D (3 + 8 + 2 + 17). (A) Principal Component Analysis plot showing scattering of responses to the ten analytes (note that this is a 2-D projection of multidimensional data); (B) Dendrogram of responses showing agglomerative hierarchical separation/clustering of the data for the analytes.
The current data show that a small set of fluorescent ODF sensor molecules on PEG-PS beads can be used to clearly distinguish between ten different small-molecule analytes in the vapor phase. Measurement of quantitative sensor changes in color and brightness has shown that multiple classes of responses are common, including quenching, lighting up, and color changes. The Δ(R,G,B) values are large, indicating that the emission responses are strong, and this is confirmed by visually observable changes in response to vapors in many cases (see examples in Fig. 9). The fluorescence responses are highly varied, with single sensors able to distinguish between several analytes. The current data show that the use of a pattern response in a small set of sensors enables a user to distinguish between more closely related organic species; examples include distinguishing between four small aromatic species (mesitylene, dimethylaniline, lutidine, nitrobenzene) and between multiple small aliphatic molecules, including closely related electrophilic species such as acrylonitrile, acrolein, and ethyl isocyanate. Statistical analysis allowed us to identify a set of four sensors that can clearly differentiate between the ten analytes with high confidence.
Figure 9.
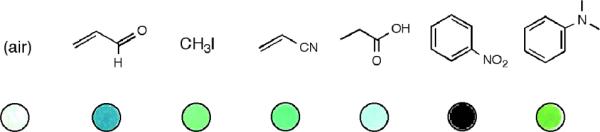
Raw images of sensor 8 responses to the analytes shown, illustrating how changes can be visible to the naked eye without image processing.
A number of properties of the ODF sensors identified here are noteworthy. First is the widely varied response of a single given sensor to multiple analytes. Most of the sensor sequences exhibit multicolor responses that are visibly distinguishable in the color difference images (Table 1). Indeed, three or four of the sequences yield different responses for 5 or 6 different analytes (See Figure 9 for one example). Using the quantitative Δ(R,G,B) data and PCA scattering plots, even further diversity of response is seen, with three sequences (SBEH, YSES, YEH) yielding quantitatively different responses for at least eight of the ten analytes. Such diversity is unusual in previous fluorescent vapor sensors, which often involve the use of only one type of fluorophore[32, 33] and are restricted to few analytes or to one family of analytes.[34–36] For example, sensors with a single type of dye associated with DNA have shown responses to four different gases, but all the sensors have virtually the same emission spectrum, and all the responses are quenching responses and thus not readily distinguishable.[15] A similar result is seen in vapor sensors built from conjugated polymers as well. In nonfluorescent (colorimetric) sensor arrays, more than one color shift has been observed in a sensor with different analytes, but nonfluorescent responses preclude the possibility of lighting-up responses and limit the range of shifts in color intensity; as a result, color changes are typically visible only after graphical processing of the changes for display.[23, 37, 38] In the current sensor molecules we attribute the diversity of response to the diversity of chromophores included in each sensor molecule, and to the diverse electronic interactions that can occur between the (presumably) stacked chromophores in each molecule. This diversity allows the use of a very small number of sensors for a larger number of analytes. The fact that the current sensors are multispectral with a single excitation aids in observing the diversity of response; sensing would be more difficult with varied conventional dyes, as changes in excitation/emission filter sets would be required for analysis.
Also noteworthy in the present sensor molecular strategy is the combinatorial approach for discovery, which allows one to prepare large sets of potential sensors rapidly, and to screen among them to find examples that respond the most strongly to an analyte of interest. ODF libraries of up to >14000 members have been reported[27], and yet larger libraries could be constructed readily if desired. The outcomes in sensing do appear to benefit from screening, as images taken during screening show that a significant fraction of the library members are weak responders to any given analyte (see SI). Avoiding the synthesis and analysis of these examples saves considerable amounts of time. A further benefit of the combinatorial design is ease and speed of synthesis: many different sensor sequences can be rapidly made from a small set of precursors, using a commercial DNA synthesizer. For example, with the final set of four sensors in the current study, only three different chromophores are components (Y, E, B), and these are combined with commercially available monomers in varied sequences. Moreover, no steps are required for conjugation of the sensor to a solid substrate, since the sequences are prepared directly on the PEG-PS beads.
An issue worth further consideration is what is the mechanism of binding of the vapor molecules to the sensor compounds on the beads. Some possible mechanisms of binding may be straightforward: for example, it seems reasonable that aromatics and other flat molecules with π-systems may stack with the chromophores in the DNA-like sensors, in an intercalation mechanism utilizing van der Waals interactions. A second plausible mechanism, which was part of the original design, is hydrogen bonding between some of the analytes and hydrogen bonding elements (such as dihydrothymidine, H) in the sensor (note, however, that H is present in only ~half of the sensors). Interestingly, we note that at least one of the analytes tested here, methyl iodide, is unlikely to be bound strongly by either mechanism. While its mode of binding is unclear at present, the fact that it can be detected is promising with regard to other possible future analytes that have little polarity or flat surface area. A third mode of recognition is also worthy of consideration for the current study: namely, covalent bonding. We note that observed responses for most of the analytes (nitrobenzene, for example) were often reversible upon opening the chamber to air, whereas responses for acrolein were not fully reversible, which is suggestive of possible adducts with ODF nucleophilic atoms (such as in dihydrothymine) or the phosphate backbone. Finally, for a few analytes it is also possible that the PEG-PS bead itself helps absorb and concentrate the vapor near the sensors; in this regard, some bead swelling was noted with lutidine, DMMP, and propionic acid. Future testing of ODF sensors on other substrate materials will help to clarify this.
Experimental Section
Monomer synthesis
Syntheses of the deoxyriboside monomers Y, B, E, and K (Figure 1) were carried out as previously reported.[26, 27] The spacer phosphoramidite (S), the 5,6-dihydro-dT-CE phosphoramidite (H), and the 5-nitroindole-CE phosphoramidite (I) were purchased from Glen Research.
ODF library construction and screening
The synthesis of the tetramer library was carried out with previously described methods [26] using a split-and-pool synthetic strategy on 130 μm amine-functionalized PEG-polystyrene beads (NovaSyn TG amino resin (Novabiochem); average loading: 210 μmole/g). The assembly of the oligodeoxyfluorosides was performed on an ABI 394 DNA/RNA synthesizer using standard phosphoramidite chemistry, but with extended coupling step times of 15 min. The fluorophore sequences of each library member were recorded by a binary encoding strategy with molecular tags. The tag synthesis, tagging, and decoding procedures were done according to the published procedure of Still.[28] The sequences were decoded by electron capture gas chromatographic analysis of tags liberated from each individual bead that was selected in the screening (see SI). For vapor phase screening of potential sensors, beads were laid down on a small microscope slide (1 mm thick × 3 mm wide × 4 mm long). They were spaced sparsely to allow for easier identification and picking. One drop (~ 4 μL) of the selected small molecule was placed beside the microscope slide and both were enclosed in a sealed 3.5 mL quartz fluorescence QS 111 cell (Hellma Küvetten für Fluoreszenzmessungen). Fluorescence images were taken before, after 2 min, 7 min, and 30 min of exposure in air at room temperature. Screening of the library was carried out using an epifluorescence microscope (Nikon Eclipse E800 equipped with a 4X objective, excitation 340 −380 nm; emission >400 nm). Fluorescence images were taken using a Spot RT digital camera and Spot Advanced Imaging software. Beads whose responses were among the strongest were picked up with a flame-pulled pipet and transferred into a capillary tube for decoding by electron-capture gas chromatography (see SI).
Image processing methods for screening
Fluorescence images taken during screening were analyzed using Adobe Photoshop (version 10.01, Adobe Inc, San Jose, CA). Raw color images (jpeg format) were taken under identical camera exposures before analyte exposure and (without moving the sample) after 30 min of exposure to the analyte vapor. We used the “invert” function in Photoshop to invert the RGB values of the image before exposure. This was copied and overlaid onto the raw image after exposure, and adjusted to 50% transparency, giving a 50% blend of the two images. Since inverting the original black background yields white, the final blended image yields 50% gray for the background, and 50% gray for any beads that showed no change with the analyte. For screening (see SI), the final blended difference image highlights beads that changed by variations in brightness/darkness (where darker than 50% gray shows quenching and lighter, fluorescence enhancement) and in color (where the color of the final image reflects both the original color and color shifts that occurred upon exposure). Color changes could result from quenching of selected parts of the combined emission bands or from true shifts of emission peaks. For representation in Table 1 the difference images were cropped slightly to show circular images and avoid edge effects.
Oligodeoxyfluoroside Synthesis
The selected ODF tetramers were re-synthesized via automated oligonucleotide synthesis by standard phosphoramidite synthetic procedures on an ABI 394 DNA/RNA synthesizer. The synthesis was carried out on a 1μmole scale in a normal column containing both PEG-polystyrene beads and 3'-Phosphate CPG (Glen Research) packed in the same column. In this way we used the same synthesis to prepare new samples of the ODF sensors on beads, and to simultaneously confirm full-length synthesis and identity of tetramers by MS and spectra (see SI Table S1 and Figs. S5,6). Cleavage from the 3'-Phosphate CPG support and final deprotection were done by treatment with 0.05 M potassium carbonate in methanol for 24 h at room temperature. Beads were washed with a solution of 10 mM EDTA.
Statistical and Chemometric Analysis
A quantitative color change profile for each sensor was determined by subtracting the RGB and L (Luma) values of the image before exposure from the RGBL values of the image after exposure (see Figure 4). First, the RGBL values of each bead were averaged in a 16x16-pixel box in the center of each bead (256 pixels square from RGB 8 bits picture), for images before and after exposure. Next, the color change profile ΔR, ΔG, ΔB, ΔL was calculated for each bead (5 to 6 beads per analyte for a given sensor) and averaged. Standard deviations and standard errors of each system were determined to evaluate the accuracy and reproducibility of the responses (see error bars in Fig. 4 and SI). The statistical data analysis, agglomerative hierarchical clustering (AHC) and principal component analysis (PCA), were then performed with the Addinsoft XLSTAT software, using the ΔR, ΔG, ΔB values as input. An unweighted pair-group average linkage method and a clustering scheme based on the squared Euclidean distance between the centroids of the clusters were carried out. The data generated dendrograms in which classes of tetramers could be identified.
Optical Methods
For further characterization of the sensors, absorbance spectra of resynthesized ODF tetramers were obtained on a Cary 100 Bio UV-vis spectrometer at ambient temperature. Solutions of tetramers (1 μM) were prepared in 1X PBS (phosphate-buffered saline) (pH=7.4). Data are shown in Figure S4. Fluorescence emission spectra (Figure S5) were performed at the same conentration and in the same buffer on a Jobin Yvon-Spex Fluorolog 3 spectrometer at ambient temperature (Excitation: 345 nm).
Figure 2.

Structures of analytes used in screening of fluorescence sensors.
Acknowledgements
We thank the U.S. National Institutes of Health (GM067201) for support. F.S. acknowledges a fellowship from the Swiss National Science Foundation.
Footnotes
Supporting information for this article is available on the WWW under http://www.chemeurj.org/ or from the author.
References
- [1].Albert KJ, Lewis NS, Schauer CL, Sotzing GA, Stitzel SE, Vaid TP, Walt DR. Chem. Rev. 2000;100:2595–2626. doi: 10.1021/cr980102w. [DOI] [PubMed] [Google Scholar]
- [2].Hulanicki A, Glab S, Ingman F. Pure. Appl. Chem. 1991;63:1247–1250. [Google Scholar]
- [3].McQuade DT, Pullen AE, Swager TM. Chem. Rev. 2000;100:2537–2574. doi: 10.1021/cr9801014. [DOI] [PubMed] [Google Scholar]
- [4].Simon P, Kvanik F. In: Optical Sensors: Industrial, Environmental and Diagnostic Applications. Narayanaswamy R, Wolfbeis OS, editors. Springer; Heidelberg: 2003. [Google Scholar]
- [5].U. E. Spichiger-Keller . Chemical Sensors and Biosensors for Medical and Biological Applications. Willey-VCH; Weinheim: 1998. [Google Scholar]
- [6].Walt DR. ACS Nano. 2009;3:2876–2880. doi: 10.1021/nn901295n. [DOI] [PubMed] [Google Scholar]
- [7].Meaney MS, McGuffin VL. Anal. Bioanal. Chem. 2008;391:2557–2576. doi: 10.1007/s00216-008-2194-6. [DOI] [PubMed] [Google Scholar]
- [8].Lewis NS. Acc. Chem. Res. 2004;37:663–672. doi: 10.1021/ar030120m. [DOI] [PubMed] [Google Scholar]
- [9].Hewage HS, Wallace KJ, Anslyn EV. Chem. Commun. 2007:3909–3911. doi: 10.1039/b706624d. [DOI] [PubMed] [Google Scholar]
- [10].Goodey A, Lavigne JJ, Savoy SM, Rodriguez MD, Curey T, Tsao A, Simmons G, Wright J, Yoo SJ, Sohn Y, Anslyn EV, Shear JB, Neikirk DP, McDevitt JT. J. Am. Chem. Soc. 2001;123:2559–2570. doi: 10.1021/ja003341l. [DOI] [PubMed] [Google Scholar]
- [11].Epstein JR, Walt DR. Chem. Soc. Rev. 2003;32:203–214. doi: 10.1039/b300617d. [DOI] [PubMed] [Google Scholar]
- [12].Rakow NA, Suslick KS. Nature. 2000;406:710–713. doi: 10.1038/35021028. [DOI] [PubMed] [Google Scholar]
- [13].Dale TJ, Rebek J., Jr. Angew Chem. 2009;121:7990. doi: 10.1002/anie.200902820. [DOI] [PubMed] [Google Scholar]; Angew. Chem. Int. Ed. 2009;48:7850–7852. doi: 10.1002/anie.200902820. [DOI] [PubMed] [Google Scholar]
- [14].Lu G, Hupp JT. J. Am. Chem. Soc. 2010;132(23):7832–7833. doi: 10.1021/ja101415b. [DOI] [PubMed] [Google Scholar]
- [15].White J, Truesdell K, Williams LB, Atkisson MS, Kauer JS. PLoS Biol. 2008;6:e9. doi: 10.1371/journal.pbio.0060009. [DOI] [PMC free article] [PubMed] [Google Scholar]
- [16].Walt DR. Chem. Soc. Rev. 2010;39:38–50. doi: 10.1039/b809339n. [DOI] [PubMed] [Google Scholar]
- [17].Aernecke MJ, Walt DR. Sens. Actuators B. 2009;142:464–469. [Google Scholar]
- [18].Yang JS, Swager TM. J. Am. Chem. Soc. 1998;120:5321–5322. [Google Scholar]
- [19].Zyryanov GV, Palacios MA, Anzenbacher P., Jr. Org. Lett. 2008;10:3681–3684. doi: 10.1021/ol801030u. [DOI] [PubMed] [Google Scholar]
- [20].Narayanan A, Varnavski OP, Swager TM, III TG. J. Phys. Chem. C. 2008;112:881–884. [Google Scholar]
- [21].Wang F, Gu H, Swager TM. J. Am. Chem. Soc. 2008;130:5392–5393. doi: 10.1021/ja710795k. [DOI] [PubMed] [Google Scholar]
- [22].Snow ES, Perkins FK, Houser EJ, Badescu SC, Reinecke TL. Science. 2005;307:1942–1945. doi: 10.1126/science.1109128. [DOI] [PubMed] [Google Scholar]
- [23].Lim SH, Feng L, Kemling JW, Musto CJ, Suslick KS. Nat. Chem. 2009;1:562–567. doi: 10.1038/nchem.360. [DOI] [PMC free article] [PubMed] [Google Scholar]
- [24].Ziessel R, Ulrich G, Harriman A, Alamiry MA, Stewart B, Retailleau P. Chem. Eur. J. 2009;15:1359–1369. doi: 10.1002/chem.200801911. [DOI] [PubMed] [Google Scholar]
- [25].Samain F, Ghosh S, Teo YN, Kool ET. Angew. Chem. Int. Ed. 2010;49:7025–7029. doi: 10.1002/anie.201002701. [DOI] [PMC free article] [PubMed] [Google Scholar]
- [26].Teo YN, Wilson JN, Kool ET. J. Am. Chem. Soc. 2009;131:3923–3933. doi: 10.1021/ja805502k. [DOI] [PMC free article] [PubMed] [Google Scholar]
- [27].Gao J, Watanabe S, Kool ET. J. Am. Chem. Soc. 2004;126:12748–12749. doi: 10.1021/ja046910o. [DOI] [PubMed] [Google Scholar]
- [28].Ohlmeyer MH, Swanson RN, Dillard LW, Reader JC, Asouline G, Kobayashi R, Wigler M, Still WC. Proc. Natl. Acad. Sci. USA. 1993;90:10922–10926. doi: 10.1073/pnas.90.23.10922. [DOI] [PMC free article] [PubMed] [Google Scholar]
- [29].Poynton CA. Digital Video and HDTV Algorithms and Interfaces. Morgan Kaufmann; San Francisco: 2002. [Google Scholar]
- [30].Wilson JN, Gao J, Kool ET. Tetrahedron. 2007;63:3427–3433. doi: 10.1016/j.tet.2006.07.113. [DOI] [PMC free article] [PubMed] [Google Scholar]
- [31].Wilson JN, Cho Y, Tan S, Cuppoletti A, Kool ET. ChemBioBChem. 2008;9:279–285. doi: 10.1002/cbic.200700381. [DOI] [PubMed] [Google Scholar]
- [32].Burattini S, Colquhoun HM, Greenland BW, Haye W, Wade M. Macromol. Rapid. Commun. 2009;30:459–463. doi: 10.1002/marc.200800630. [DOI] [PubMed] [Google Scholar]
- [33].Bai H, Li C, Shi G. Sens Actuators B. 2008;130:777–782. [Google Scholar]
- [34].Liu Y, Wang K-R, Guo D-S, Jiang B-P. Adv. Funct. Mater. 2009;19:2230–2235. [Google Scholar]
- [35].Liu W, Pink M, Lee D. J. Am. Chem. Soc. 2009;131:8703–8707. doi: 10.1021/ja902333p. [DOI] [PubMed] [Google Scholar]
- [36].Che Y, Zang L. Chem. Commun. 2009:5106–5108. doi: 10.1039/b913138h. [DOI] [PubMed] [Google Scholar]
- [37].Feng L, Musto CJ, Kemling JW, Lim SH, Suslick KS. Chem. Commun. 2010;46:2037–2039. doi: 10.1039/b926848k. [DOI] [PMC free article] [PubMed] [Google Scholar]
- [38].Lim SH, Kemling JW, Feng L, Suslick KS. Analyst. 2009;134:2453–2457. doi: 10.1039/b916571a. [DOI] [PMC free article] [PubMed] [Google Scholar]