

Abstract
BACKGROUND AND PURPOSE
The P2X receptor family consists of seven subunit types – P2X1–P2X7. All but P2X6 are able to assemble as homotrimers. In addition, various subunit permutations have been reported to form heterotrimers. Evidence for heterotrimer formation includes co-localization, co-immunoprecipitation and the generation of receptors with novel functional properties; however, direct structural evidence for heteromer formation, such as chemical cross-linking and single-molecule imaging, is available in only a few cases. Here we examined the nature of the interaction between two pairs of subunits – P2X2 and P2X4, and P2X4 and P2X7.
EXPERIMENTAL APPROACH
We used several experimental approaches, including in situ proximity ligation, co-immunoprecipitation, co-isolation on affinity beads, chemical cross-linking and atomic force microscopy (AFM) imaging.
KEY RESULTS
Both pairs of subunits co-localize upon co-transfection, interact intimately within cells, and can be co-immunoprecipitated and co-isolated from cell extracts. Despite this, chemical cross-linking failed to show evidence for heteromer formation. AFM imaging of isolated receptors showed that all three subunits had the propensity to form receptor dimers. This self-association is likely to account for the observed close interaction between the subunit pairs, in the absence of true heteromer formation.
CONCLUSIONS AND IMPLICATIONS
We conclude that both pairs of receptors interact in the form of distinct homomers. We urge caution in the interpretation of biochemical evidence indicating heteromer formation in other cases.
Keywords: P2X receptors, receptor assembly, subunit interactions, atomic force microscopy
Introduction
P2X receptors incorporate a cation-selective ion channel that opens in response to ATP binding (see North, 2002; Khakh and North, 2006; Murrell-Lagnado and Qureshi, 2008; Surprenant and North, 2008). Studies using various techniques, including chemical cross-linking (Nicke et al., 1998; Stoop et al., 1999; Jiang et al., 2003), blue native polyacrylamide gel electrophoresis (PAGE; Nicke et al., 1998; Aschrafi et al., 2004), atomic force microscopy (AFM; Barrera et al., 2005; Shinozaki et al., 2009), electron microscopy (Mio et al., 2005, 2009; Young et al., 2008) and most recently X-ray crystallography (Gonzales et al., 2009; Kawate et al., 2009), have indicated that the receptor assembles as a trimer. Seven P2X receptor subunits have been identified (nomenclature follows Alexander et al., 2009). Of these, all except P2X6 have been shown to form functional homomeric receptors, with varying properties and pharmacology (Torres et al., 1999). Evidence has also been presented that all are able to form heteromers in various combinations. The evidence for heteromer formation includes co-immunoprecipitation (Torres et al., 1999; Guo et al., 2007), chemical cross-linking (Jiang et al., 2003), blue native PAGE (Aschrafi et al., 2004) and functional studies, in which co-expression of two different subunits produces receptors with properties distinct from those formed after expression of either subunit alone (Lewis et al., 1995; King et al., 2000; Jiang et al., 2003; Egan and Khakh, 2004; Ma et al., 2006; Lalo et al., 2008; Casas-Pruneda et al., 2009). With the exception of the cross-linking studies of Jiang et al. (2003) and the blue native PAGE/cross-linking studies of Aschrafi et al. (2004), none of these techniques provides conclusive evidence for heteromer formation, since the possibility that two different homotrimers interact within the plane of the membrane cannot be ruled out.
Association between P2X receptor complexes is suggested by the analysis of the molecular mass of these receptors under non-denaturing conditions. Stable higher order structures corresponding in size to hexamers and nonamers have been resolved for P2X2 and other P2X subtypes (Nicke et al., 1998; Aschrafi et al., 2004). P2X2 receptor function has also been shown to depend upon the density of channels expressed, with an increase in sensitivity to ATP and decrease in the degree of channel rectification at high levels of expression (Clyne et al., 2003; Fujiwara and Kubo, 2004). The non-independent gating of P2X2 receptors was also shown within a patch of membrane (Ding and Sachs, 2002). Specifically, the frequency of current transitions, the mean open lifetimes and the open channel noise were all different in patches containing multiple rather than single channels. In addition, the channel kinetics indicated positive cooperativity with respect to channel opening. Significantly, there is also evidence that P2X receptors can interact with other ion channels, including the Cys-loop receptors (Khakh et al., 2000, 2005), to produce complexes with novel functional properties.
In the present study, we focused on two pairs of subunits – P2X2/P2X4 and P2X4/P2X7. P2X2 and P2X4 have been shown to be co-expressed in the cell bodies and dendrites of cerebellar Purkinje and hippocampal CA1 neurons (Rubio and Soto, 2001), and also in Leydig cells (Antonio et al., 2009); in both cases P2X6 subunits were also present. There is no evidence for functional heteromer formation between P2X2 and P2X4, although the effects of ivermectin in Leydig cells (an increase in peak current at a low ATP concentration, as expected for P2X4 homomers, but a decrease in peak current at a higher ATP concentration, unlike P2X4 homomers), together with the lack of effect of αβ-methylene ATP, which rules out the presence of P2X4/P2X6 heteromers, are consistent with the formation of endogenous P2X2/P2X4/P2X6 heteromers.
In contrast to the P2X2/P2X4 combination, co-immunoprecipitation data suggested that P2X4 and P2X7 exogenously expressed in human embryonic kidney (HEK)-293 cells do interact to form a heteromeric receptor (Guo et al., 2007). The first pharmacological evidence for heteromer formation between P2X4 and P2X7 was obtained in airway ciliated epithelial cells with the demonstration that ATP-evoked responses mediated by endogenous P2X receptors were inhibited by Brilliant Blue G or KN-62, similar to P2X7 receptor currents, but were also augmented by Zn2+ and ivermectin, similar to P2X4 receptor currents (Ma et al., 2006). Subsequently, ion substitution experiments carried out using isolated mouse parotid acinar cells, which endogenously express P2X receptors, showed that ATP-activated currents carried by tetraethylammonium (TEA+) differed in their time course from currents observed with P2X7 homomers exogenously expressed in HEK-293 cells (Casas-Pruneda et al., 2009). Surprisingly, P2X4 expressed alone was not able to mediate a TEA+ current. In addition, the ivermectin sensitivity of ATP-evoked currents in the acinar cells differed from that of either of the heterologously expressed homomeric receptor currents. Again, these results suggest the formation of a P2X4/P2X7 heteromer. Guo et al. (2007) used a heterologous expression system to investigate functional coupling between P2X7 and a point mutant of P2X4 which, when expressed alone, showed no functional response to ATP but also did not exert any dominant negative effect on the wild-type receptor currents, suggesting that it could be tolerated within a heteromeric receptor complex. Unlike currents measured in cells expressing P2X7 alone, the whole-cell ATP-evoked currents were potentiated by ivermectin and inhibited by TNP-ATP, properties normally associated with P2X4 homomers, once again pointing to the presence of P2X4/P2X7 heteromers. Despite this substantial evidence for heteromer formation, subsequent analysis of P2X4 and P2X7 endogenously co-expressed in various tissues indicated that the predominant assembly pathway for both subunits involved the production of homotrimers (Nicke, 2008; Boumechache et al., 2009).
We have previously used AFM imaging to determine the subunit arrangement within multi-subunit proteins such as ionotropic receptors (Barrera et al., 2005, 2007), and have used this method to provide definitive evidence that P2X2 and P2X6 subunits form heteromeric receptors whose subunit stoichiometry depends on the relative expression levels of the two proteins (Barrera et al., 2007). Here, we used a combination of biochemical analysis and AFM imaging to address the question of whether P2X2/P2X4 and P2X4/P2X7 subunits co-assemble to produce heteromeric receptors and to look for evidence of stable receptor clusters. We present evidence that in both cases, the pairs of subunits interact in the form of homotrimers but that, for all three subtypes, dimers of trimers can be resolved, which may correspond to a functionally important unit.
Methods
Cell culture
tsA 201 cells (a sub-clone of HEK-293 cells stably expressing the SV40 large T-antigen) and HEK-293 cells were grown in Dulbecco's modified Eagle's medium supplemented with 10% (v/v) fetal calf serum, 100 units mL−1 penicillin and 100 µg·mL−1 streptomycin, in an atmosphere of 5% CO2/air.
Constructs
The following constructs were used: rat P2X2 receptor in the pcDNA3.1/His vector (Invitrogen, Paisley, UK), which produces a protein tagged at its N-terminus with the His6 epitope; P2X2 in the pEGFP-N1 vector (Clontech, Saint-Germain-en-Laye, France), which adds an enhanced green fluorescent protein (GFP) tag to the C-terminus; P2X2 in the pEGFP vector without the GFP tag; rat P2X4 with a C-terminal haemagglutinin (HA) tag in the pEGFP vector without the GFP tag; rat P2X7 with an N-terminal His10 tag in the pEGFP vector without the GFP tag; and untagged P2X7 in the same vector.
Transient transfection of tsA 201 cells
Transient transfections of tsA 201 cells with DNA were carried out using the CalPhos™ mammalian transfection kit (Clontech), according to the manufacturer's instructions. Amounts of DNA used were as detailed below. After transfection, cells were incubated for 24–48 h at 37°C to allow protein expression.
Immunofluorescence analysis of protein expression
Cells growing on glass coverslips in 3.5 cm diameter culture wells were co-transfected with 1.5 µg each of DNA encoding either P2X2-GFP+P2X4-HA or P2X4-HA+His10-P2X7. Cells were fixed, permeabilized and incubated with appropriate primary antibodies [mouse monoclonal anti-HA (Covance, Maidenhead, UK), rabbit polyclonal anti-P2X7 (Alomone, Jerusalem, Israel) and rabbit polyclonal anti-His6 (Research Diagnostics Inc., Concord, MA, USA)], followed by either Cy3- or fluorescein isothiocyanate-conjugated goat secondary antibodies (Sigma, Poole, UK). Cells were imaged by confocal laser scanning microscopy.
In situ proximity ligation assay
HEK-293 cells growing in 3.5 cm diameter culture wells were co-transfected with 1 µg each of DNA encoding either P2X2+P2X4-HA or P2X4-HA+P2X7. All transfections also included pEGFP (0.3 µg DNA), to identify transfected cells. In control experiments, cells were singly transfected with 1 µg of DNA encoding P2X4-HA. Cells were replated onto glass coverslips and incubated for 24 h. Cells were fixed with 3% paraformaldehyde and incubated in 5% fetal bovine serum plus 1% saponin for 1 h at room temperature. Cells were then incubated in the same solution containing primary antibodies (mouse monoclonal anti-HA, rabbit polyclonal anti-P2X7 or rabbit polyclonal anti-P2X2, all diluted 1:100) for a further 1 h. Cells were washed with phosphate-buffered saline and then incubated for 2 h with anti-mouse (+) and anti-rabbit (−) proximity ligation secondary antibodies, diluted 1:5. These antibodies were obtained as part of a kit from Olink Bioscience, which also included hybridization, ligation and amplification buffers, and a fluorescent detection probe. Cells were washed with Tris-buffered saline-Tween (TBS-T; 140 mM NaCl, 20 mM Tris-HCl, pH 7.5, 0.1% Tween) and incubated in hybridization buffer for 15 min, followed by another wash with TBS-T and a 15-min incubation with T4 DNA ligase diluted 1:40 in ligation buffer. Cells were again washed with TBS-T, and DNA amplification was performed by incubation with 1:80 DNA polymerase in amplification buffer for 90 min. Cells were washed again, and incubated with fluorescent detection probe (excitation 554 nm, emission 576 nm) for 1 h. Cells were washed sequentially with 2 × SSC buffer, 1 × SSC, 0.2 × SSC, 0.02 × SSC and 70% ethanol. (SSC buffer is 17.5% NaCl, 8.8% sodium citrate dihydrate, pH 7.0.) Washed cells were then imaged by confocal laser scanning microscopy.
Co-immunoprecipitation of P2X subunits
Cells growing in 162 cm2 flasks were co-transfected with 25 µg each of DNA encoding either P2X2-GFP+P2X4-HA or P2X4-HA+His10-P2X7. Crude membrane fractions prepared from the cells were solubilized in 1% (w/v) 3-[(3-cholamidopropyl)dimethylammonio]-1-propanesulphonate (CHAPS). P2X2-GFP was immunoprecipitated using a rabbit polyclonal anti-P2X2 antibody; P2X4-HA was immunoprecipitated using a rabbit polyclonal anti-P2X4 antibody; and P2X7 was immunoprecipitated using a rabbit polyclonal anti-P2X7 antibody. Rabbit polyclonal anti-His6 and rabbit polyclonal anti-P2X2 antibodies were used as negative controls, as appropriate. Immune complexes were captured using Protein G-Sepharose (GE Healthcare, Chalfont St. Giles, UK), and immunoprecipitates were analysed by SDS-PAGE followed by immunoblotting with either a mouse monoclonal anti-GFP antibody (Invitrogen; P2X2-GFP), a mouse monoclonal anti-HA antibody (P2X4-HA) or a rabbit polyclonal anti-P2X7 antibody. Immunoreactive bands were visualized using enhanced chemiluminescence.
Cross-linking of P2X subunits
Cells growing in 3.5 cm diameter culture wells were transfected with a total of 3 µg of DNA encoding P2X2-GFP, P2X4-HA or His10-P2X7 either alone or in combination. When cells were doubly transfected, 1.5 µg of DNA for each construct was used. Crude membrane fractions prepared from the cells were solubilized in 1% (w/v) Triton X-100. The detergent extract was treated with either 0.2 mM or 4 mM disuccinimidyl suberate (DSS), as appropriate, or DMSO vehicle alone, for 30 min at room temperature. DSS was quenched with 50 mM Tris-HCl, pH 7.6, and samples (unboiled) were analysed by SDS-PAGE followed by immunoblotting with appropriate antibodies (see above).
Solubilization and purification of P2X receptors
A total of 250 µg of DNA was used to transfect cells in 5 × 162 cm2 culture flasks. When cells were doubly transfected, 200 µg of DNA for P2X4-HA and 50 µg for either His6-P2X2 or His10-P2X7 was used. These amounts were chosen to take account of the relatively low expression of P2X4-HA, compared with His6-P2X2 and His10-P2X7. Crude membrane fractions prepared from the cells were solubilized in 1% CHAPS as described previously (Barrera et al., 2005). For His6-tagged proteins, the solubilized material was incubated with Ni2+-agarose beads (Probond, Invitrogen); the beads were washed extensively, and bound proteins were eluted with increasing concentrations of imidazole. For HA-tagged P2X4, the solubilized material was incubated with anti-HA-agarose beads (Sigma); the beads were washed, and bound protein was eluted with HA peptide. Samples were analysed by SDS-PAGE, and proteins were detected by immunoblotting with appropriate antibodies (see above).
AFM imaging
Isolated proteins were diluted to a final concentration of 0.04 nM, and 45 µL of the sample was allowed to adsorb to freshly cleaved, poly-L-lysine-coated mica disks. After a 5-min incubation, the sample was washed with BPC-grade water (Sigma) and dried under nitrogen. Imaging was performed with a Veeco Digital Instruments Multimode AFM controlled by a Nanoscope IIIa controller. Samples were imaged in air, using tapping mode. The silicon cantilevers used had a drive frequency of ∼300 kHz and a specified spring constant of 40 N/m (Olympus, Southend-on-Sea, UK). The applied imaging force was kept as low as possible (As/A0∼0.85).
The molecular volumes of the protein particles were determined from particle dimensions based on AFM images. After adsorption of the proteins onto the mica support, the particles adopted the shape of a spherical cap. As described previously (Schneider et al., 1998), the heights and radii were measured from multiple cross-sections of the same particle, and the molecular volume was calculated using the following equation
| (1) |
where h is the particle height and r is the radius. Molecular volume based on molecular mass was calculated using the equation
| (2) |
where M0 is the molecular mass, N0 is Avogadro's number, V1 and V2 are the partial specific volumes of particle (0.74 cm3·g−1) and water (1 cm3·g−1), respectively, and d is the extent of protein hydration (taken as 0.4 g water·g protein−1; Barrera et al., 2005).
Results
In initial experiments, tsA 201 cells were transiently co-transfected with DNA encoding P2X2-GFP+P2X4-HA, or with P2X4-HA+His10-P2X7. Protein expression and localization was confirmed by immunofluorescence, using appropriate antibodies. After P2X2-GFP+P2X4-HA co-transfection, the cells staining for GFP (P2X2) and HA (P2X4) completely coincided, indicating all of the transfected cells (n = 55) expressed both subunits (Figure 1A). An anti-His6 antibody, used as a negative control, produced only a background immunofluorescence signal (data not shown). After P2X4-HA+His10-P2X7 co-transfection, the staining signals for HA (P2X4-HA) and P2X7 again indicated that the vast majority (94%, n = 48) of the transfected cells expressed both subunits (Figure 1B). Singly transfected cells were seen occasionally, indicating that cross-talk between the fluorescent signals was minimal.
Figure 1.
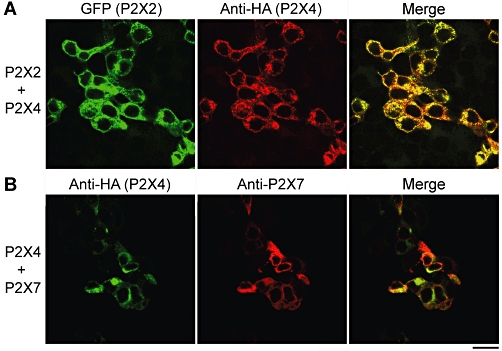
Co-expression of P2X receptors in tsA 201 cells. (A) Cells were co-transfected with DNA encoding P2X2-GFP and P2X4-HA. Cells were fixed, permeabilized and incubated with a mouse monoclonal anti-HA antibody, followed by Cy3-conjugated goat anti-mouse secondary antibody. Cells were imaged by confocal laser scanning microscopy. The left-hand panel shows the GFP signal, the centre panel the Cy3 signal and the right-hand panel the merged signals. Cells expressing GFP and Cy3 completely coincide, indicating that all of the transfected cells express both P2X2 and P2X4. (B) Cells were co-transfected with DNA encoding P2X4-HA and His10-P2X7. Cells were fixed, permeabilized and incubated with mouse monoclonal anti-HA and rabbit polyclonal anti-P2X7 antibodies, followed by either FITC-conjugated goat anti-mouse or Cy3-conjugated goat anti-rabbit secondary antibodies. The left-hand panel shows the FITC signal, the centre panel the Cy3 signal, and the right-hand panel the merged signals. Cells expressing FITC and Cy3 extensively coincide, indicating that the vast majority of transfected cells express both P2X4 and P2X7 receptors. Scale bar, 25 µm. FITC, fluorescein isothiocyanate; GFP, green fluorescent protein; HA, haemagglutinin.
To establish whether the pairs of subunits co-expressed in the cells interact with each other, in situ proximity ligation assays were carried out (Söderberg et al., 2006). The assay uses two secondary antibodies, each bearing a short DNA strand. When the secondary antibodies are brought into close proximity (<40 nm) by binding to their relevant primary antibodies, the DNA strands hybridize with an additional circle-forming oligodeoxynucleotide. Ligation then creates a complete circularized oligodeoxynucleotide, and rolling circle amplification increases the amount of circular DNA several hundred-fold. The DNA is then visualized using a fluorescent probe. Cells were co-transfected with either P2X2+P2X4-HA or P2X4-HA+P2X7, and pEGFP was used to reveal the transfected cells. Primary antibodies used to tag the subunits were anti-P2X2, anti-HA (P2X4) and anti-P2X7. As shown in Figure 2, strong proximity signals were given by both P2X2+P2X4 (Figure 2A) and P2X4+P2X7 (Figure 2B). Of the cells expressing EGFP, the percentages giving proximity signals were 95% (n = 100) for P2X2+P2X4 and 93% (n = 100) for P2X4+P2X7. In contrast, when cells were transfected with P2X4 alone (plus pEGFP) no signal was generated with either anti-P2X2+anti-HA primary antibodies (Figure 2C) or anti-HA+anti-P2X7 primary antibodies (Figure 2D). These results indicate that both P2X2 and P2X4, and P2X4 and P2X7, come into close proximity within the transfected cells.
Figure 2.
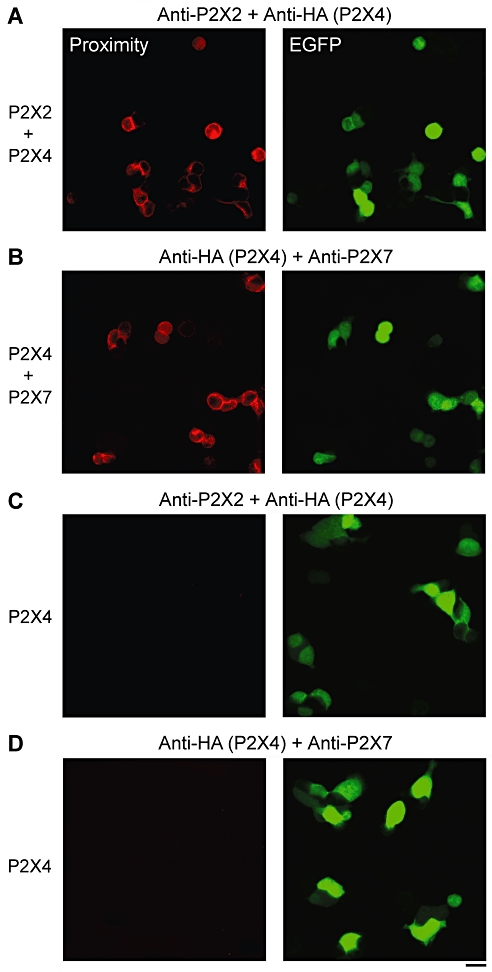
In situ proximity ligation assays for P2X subunit interactions. Cells were co-transfected with DNA encoding either P2X2 plus P2X4-HA (A) or P2X4-HA plus P2X7 (B). Transfections also included pEGFP, to identify transfected cells. Cells were permeabilized and incubated with primary antibodies (rabbit polyclonal anti-P2X2, mouse monoclonal anti-HA (for P2X4) or rabbit polyclonal anti-P2X7) followed by anti-mouse (+) and anti-rabbit (−) proximity ligation secondary antibodies. The proximity ligation assay was then carried out, and treated cells were imaged by confocal laser scanning microscopy. The left-hand panels show the proximity signals, and the right-hand panels the EGFP signals. (C, D) Control experiments in which cells expressing P2X4-HA only (plus EGFP) were probed with anti-P2X2 and anti-HA antibodies (C) or anti-HA and anti-P2X7 antibodies (D). Transfected cells are indicated by the EGFP signal (right-hand panels). There are no corresponding proximity ligation signals (left-hand panels). Scale bar, 20 µm. EGFP, enhanced green fluorescent protein; HA, haemagglutinin.
To provide further support for a direct interaction between the pairs of subunits, co-immunoprecipitation experiments were carried out. Detergent extracts of crude membrane fractions from the co-transfected cells were prepared; each subunit was immunoprecipitated and the immunoprecipitates were probed for both subunits. As shown in Figure 3A, after P2X2-GFP+P2X4-HA co-transfection an anti-P2X2 antibody precipitated both P2X2-GFP (molecular mass 95 kDa) and P2X4-HA (molecular mass 65 kDa), and an anti-P2X4 antibody precipitated both P2X4-HA and P2X2-GFP. An anti-His6 antibody, used as a negative control, did not precipitate either P2X2-GFP or P2X4-HA. In a similar experiment with P2X4-HA+His10-P2X7 co-transfected cells, P2X4-HA and His10-P2X7 (molecular mass 95 kDa) were co-immunoprecipitated (Figure 3B), whereas an anti-P2X2 antibody did not precipitate either protein. These results support the suggestion that P2X2 and P2X4 subunits, and P2X4 and P2X7 subunits, interact intimately in co-transfected cells.
Figure 3.
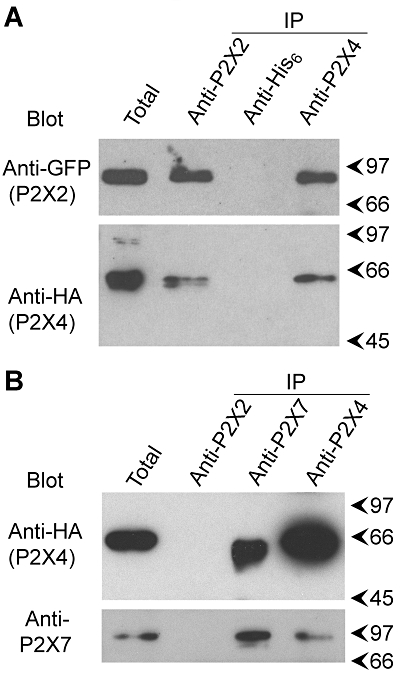
Co-immunoprecipitation of P2X subunits. (A) P2X2-GFP and P2X4-HA were co-expressed by transient transfection of tsA 201 cells. Crude membrane fractions prepared from the cells were solubilized in 1% CHAPS. P2X2-GFP was immunoprecipitated using a rabbit polyclonal anti-P2X2 antibody, and P2X4-HA was immunoprecipitated using a rabbit polyclonal anti-P2X4 antibody. A rabbit polyclonal anti-His6 antibody was used as a negative control. Immunoprecipitates were analysed by SDS-PAGE followed by immunoblotting with either mouse monoclonal anti-GFP (P2X2-GFP) or anti-HA (P2X4-HA) antibodies. Immunoreactive bands were visualized using enhanced chemiluminescence. Arrowheads indicate molecular mass markers (kDa). (B) P2X4-HA and His10-P2X7 were co-expressed by transient transfection of tsA 201 cells. P2X4-HA was immunoprecipitated from a detergent-solubilized membrane fraction using a rabbit polyclonal anti-P2X4 antibody, and His10-P2X7 was immunoprecipitated using a rabbit polyclonal anti-P2X7 antibody. A rabbit polyclonal anti-P2X2 antibody was used as a negative control. Immunoprecipitates were analysed by SDS-PAGE followed by immunoblotting with either a mouse monoclonal anti-HA antibody (P2X4-HA) or a rabbit polyclonal anti-P2X7 antibody. CHAPS, 3-[(3-cholamidopropyl)dimethylammonio]-1-propanesulphonate; GFP, green fluorescent protein; HA, haemagglutinin; PAGE, polyacrylamide gel electrophoresis.
Co-immunoprecipitation of pairs of subunits could be indicating the formation of heterotrimeric receptors, or alternatively an interaction between pairs of homotrimers. To distinguish between these two possibilities, we subjected detergent extracts of membranes from co-transfected cells to treatment with the chemical cross-linker DSS. As shown in Figure 4A, DSS treatment of an extract from cells expressing only P2X2-GFP revealed the presence of bands on an immunoblot of approximate molecular masses 95, 190 and 285 kDa, corresponding to monomers, dimers and trimers. When cells expressing both P2X2-GFP and P2X4-HA were treated similarly, the anti-P2X2 antibody revealed exactly the same pattern of bands. Significantly, there was no sign of the formation of the intermediate bands that would be expected for cross-linking of heterotrimers (given that P2X2-GFP and P2X4-HA have significantly different molecular masses). When the same experiment was carried out with cells expressing only P2X4-HA, again three bands were detected by an anti-HA antibody, at approximate molecular masses of 65, 130 and 195 kDa, corresponding to monomers, dimers and trimers (Figure 4B). These same bands were also seen on anti-HA immunoblots of cells expressing either P2X2-GFP+P2X4-HA or P2X4-HA+His10-P2X7. Finally, an anti-P2X7 antibody detected the same three bands, at molecular masses 95, 190 and 285 kDa, again corresponding to monomers, dimers and trimers, on immunoblots of samples from cells expressing either His10-P2X7 alone or P2X4-HA+His10-P2X7 (Figure 4C). Once again, no intermediate bands were seen. The results from these cross-linking experiments strongly indicate that no heteromeric receptors are formed upon co-expression of either P2X2+P2X4 or P2X4+P2X7.
Figure 4.
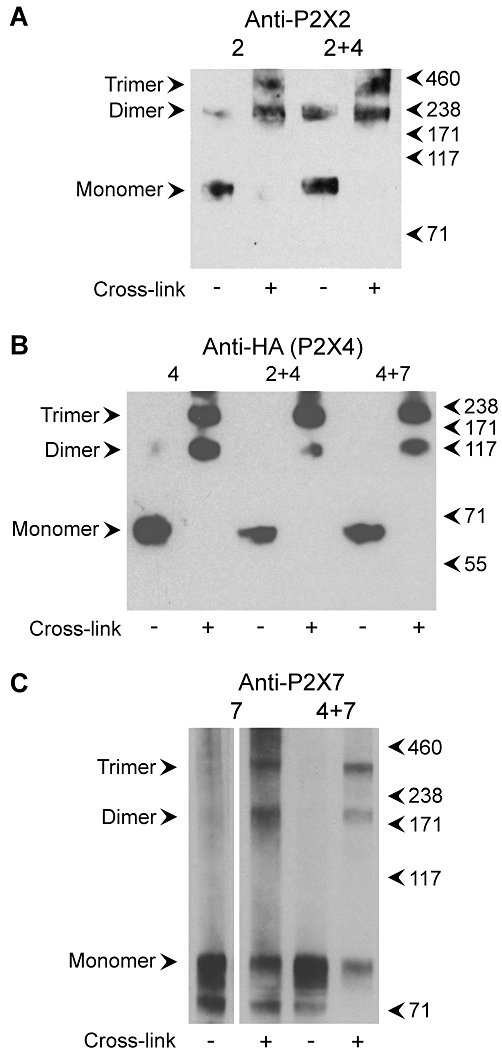
Cross-linking analysis of P2X subunits. (A) Detergent extracts of membrane fractions from cells transfected with either P2X2-GFP alone or P2X2-GFP+P2X4-HA were incubated with the chemical cross-linker DSS (0.2 mM, 30 min at room temperature), or with the DMSO vehicle alone, and then subjected to SDS-PAGE followed by immunoblotting with a rabbit polyclonal anti-P2X2 antibody. Immunoreactive bands were visualized using enhanced chemiluminescence. Arrowheads indicate molecular mass markers (kDa). (B) Detergent extracts of membrane fractions from cells transfected with either P2X4-HA alone, P2X2-GFP+P2X4-HA or P2X4-HA+His10-P2X7 were incubated with DSS (4 mM) and then subjected to SDS-PAGE followed by immunoblotting with a mouse monoclonal anti-HA (P2X4-HA) antibody. (C) Detergent extracts of membrane fractions from cells transfected with either His10-P2X7 alone or P2X4-HA+His10-P2X7 were incubated with DSS (0.2 mM) and then subjected to SDS-PAGE followed by immunoblotting with a rabbit polyclonal anti-P2X7 antibody. DSS, disuccinimidyl suberate; GFP, green fluorescent protein; HA, haemagglutinin; PAGE, polyacrylamide gel electrophoresis.
If the combinations P2X2+P2X4 and P2X4+P2X7 do not form heterotrimers, what is the nature of their interaction? To address this question, we took advantage of AFM to generate images of single receptors. We transfected cells with His6-P2X2, P2X4-HA and His10-P2X7, either alone or in combination. His6-P2X2 and His10-P2X7 were isolated from detergent extracts of transfected cells through binding of the tag to Ni2+-agarose, followed by elution with imidazole. P2X4-HA was isolated through binding of the tag to anti-HA-agarose, followed by elution with the HA peptide. As shown by immunoblotting (Figure 5A), all three proteins were successfully isolated after single transfection of the cells. In addition, His6-P2X2 was isolated from cells expressing His6-P2X2+P2X4-HA, and P2X4-HA was isolated along with it. Similarly, His10-P2X7 could be used to isolate both His10-P2X7 and P2X4-HA from co-transfected cells. These results provide further evidence for an intimate interaction between the pairs of subunits.
Figure 5.
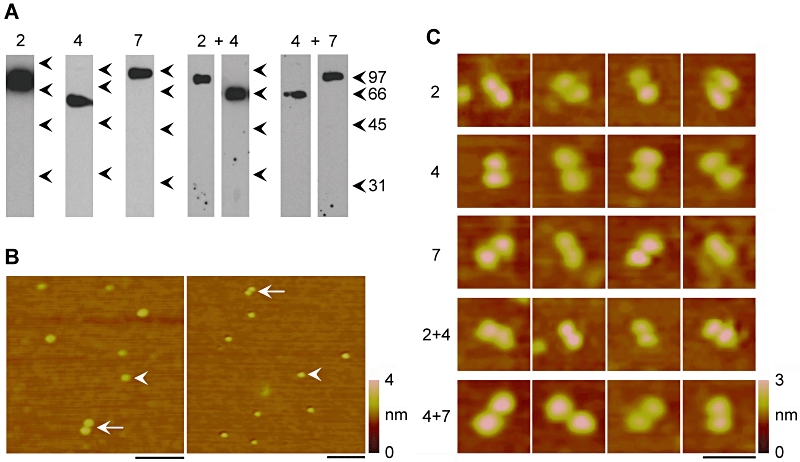
Atomic force microscopy (AFM) imaging of P2X receptors of various subunit compositions. (A) His6-P2X2 and His10-P2X7 were isolated from detergent extracts of cells through binding of their His tags to Ni2+-agarose beads, followed by elution with imidazole. P2X4-HA was isolated through binding of its HA tag to anti-HA immunoaffinity beads, followed by elution with HA peptide. P2X subunits were either expressed alone or in the combinations His6-P2X2+P2X4-HA (with pull-down of His6-P2X2) or P2X4-HA+His10-P2X7 (with pull-down of His10-P2X7). Eluted samples were subjected to SDS-PAGE followed by immunoblotting with either a rabbit polyclonal anti-P2X2 antibody, a mouse monoclonal anti-HA (P2X4-HA) antibody or a rabbit anti-P2X7 antibody. Immunoreactive bands were visualized using enhanced chemiluminescence. Arrowheads indicate molecular mass markers (kDa). (B) Low-magnification AFM images of a sample isolated from cells expressing P2X4-HA. The arrowheads indicate single receptors; arrows indicate double receptors. A colour-height scale is shown at the right. Scale bars, 100 nm. (C) Gallery of zoomed images of double receptors present in samples isolated from cells expressing all five subunit combinations. A colour-height scale is shown at the right. Scale bar, 50 nm. HA, haemagglutinin; PAGE, polyacrylamide gel electrophoresis.
Protein samples isolated from cells expressing various combinations of P2X receptors were imaged by AFM. As an example, two representative low-magnification AFM images of a sample from cells expressing P2X4-HA are shown in Figure 5B. The images show a population of single particles (arrowheads). Interestingly, pairs of particles are also apparent (arrows), which likely represent receptor dimers. All five of the samples characterized in Figure 5A were subjected to AFM imaging, and double particles were seen in each case. The percentage of double particles relative to the total particle population was small, ranging from 2–4% of the total (i.e. 4–8% of the particles were in pairs). However, the distribution of molecular volumes of the single particles, calculated using Equation 1, was broad, suggesting that some of the larger particles might also be closely apposed receptor dimers. The pairs of particles might then represent dimers that have partially separated on binding to the mica substrate. A gallery of zoomed images of representative double particles is shown in Figure 5C. The calculated molecular volumes for individual particles present in pairs isolated from the single transfections were 501 ± 19 (SE) nm3 (n = 116) for His6-P2X2, 417 ± 14 nm3 (n = 144) for P2X4-HA and 512 ± 21 nm3 (n = 116) for His10-P2X7. The predicted volumes for homotrimers of His6-P2X2, P2X4-HA and His10-P2X7 subunits, on the basis of their molecular masses (80, 65 and 95 kDa respectively), according to Equation 2, are 456, 370 nm3 and 541 nm3 respectively. Hence, the measured volumes are close to the predicted volumes, supporting the notion that the particles observed are P2X receptor trimers.
Discussion
In this study we have shown that two pairs of P2X subunits – P2X2 and P2X4, and P2X4 and P2X7 – interact intimately. Evidence in support of this assertion includes close proximity within cells, as judged by in situ proximity ligation, co-immunoprecipitation from detergent extracts and co-isolation on affinity beads. However, we found no evidence for the formation of heteromeric receptors from these subunit combinations. Specifically, chemical cross-linking revealed only the presence of homotrimers. AFM imaging of isolated P2X receptors revealed that individual receptors associate together in the form of receptor dimers. We were not able to distinguish between P2X2 and P2X4 receptors, and between P2X4 and P2X7 receptors, in the AFM images of samples from co-transfected cells. However, given the propensity of all three subunits to form receptor dimers following single transfection, it is reasonable to expect that heterodimer formation also occurs. We conclude that the association between P2X2 and P2X4, and between P2X4 and P2X7, occurs through pairing of homotrimers, rather than through the formation of heterotrimers. Whether P2X2 and P2X4 are able to interact with P2X6 to form a P2X2/P2X4/P2X6 heteromer, a possibility suggested by functional data (Antonio et al., 2009), remains to be determined.
Our results raise the important general point that it is unwise to conclude that receptor heteromers, involving the co-assembly of different subunits around a common pore, are being formed simply on the basis of co-localization, co-immunoprecipitation or functional assays. Rather, it is essential to provide direct structural evidence for heteromerization, by cross-linking or single-molecule imaging. To our knowledge, in the P2X receptor family this criterion has been achieved only for P2X1/P2X2 (Aschrafi et al., 2004), P2X2/P2X3 (Jiang et al., 2003) and P2X2/P2X6 (Barrera et al., 2007). A good illustration of how confusion can be generated by reliance on incomplete evidence is the interaction between P2X4 and P2X7. P2X7 was originally believed to be the only member of the P2X receptor family that did not form heteromers (Torres et al., 1999). However, the fact that P2X7 is widely co-expressed with P2X4 led to experiments to examine the nature of their interaction. Both co-immunoprecipitation and functional assays indicated an intimate association between the two subunits, and it was therefore concluded that heteromers were being formed (Guo et al., 2007; Casas-Pruneda et al., 2009). However, closer examination, using both cross-linking and blue native PAGE analysis, has led to the opposite conclusion; that is, that both P2X4 and P2X7 assemble predominantly as homotrimers, which presumably interact together (Nicke, 2008; Boumechache et al., 2009). The results of the present study add weight to this conclusion, and extend it to another pair of subunits – P2X2 and P2X4.
Of course, the problem referred to above also applies to other multi-subunit proteins. For instance in the family of transient receptor potential (TRP) channels, heteromer formation between TRPP2 and TRPC1, and between TRPP2 and TRPV4, has been assumed on the basis of co-immunoprecipation and functional assays (Tsiokas et al., 1999; Bai et al., 2008; Köttgen et al., 2008). In both cases, heteromer formation, with a defined subunit stoichiometry and arrangement, has been proven by AFM imaging of isolated channels (Kobori et al., 2009; Stewart et al., 2010). However, elsewhere, heteromer formation has been suggested without any direct structural evidence; for example, epithelial sodium channels (ENaCs) and acid-sensing ion channels (ASICs) are co-expressed in many cell lines and tissue types, raising the possibility that ENaC and ASIC subunits might co-assemble to form inter-family heteromeric ion channels. Evidence for such an interaction has been presented, including co-immunoprecipitation of the two subunits, fluorescence resonance energy transfer between them, and the demonstration that co-expression of ENaC and ASIC subunits produces channels with properties distinct from those formed after expression of either subunit alone (Meltzer et al., 2007; Kapoor et al., 2009). We suggest that caution should be exercised in cases such as this.
Acknowledgments
This work was supported by Biotechnology and Biological Sciences Research Council grant BB/F001320/1 (to RML and JME) and by Fundação de Amparo a Pesquisa do Estado de São Paulo grant 06/50954-7 (to WAV). LSA was supported by a Scholarship from the CAPES Foundation of the Ministry of Education of Brazil. APS is a member of the University of Cambridge MB/PhD Programme, and is supported by the Jean Shanks Foundation and the James Baird Fund. XJX is supported by an Overseas Research Studentship, the Cambridge Overseas Trust, King's College Cambridge and the Department of Pharmacology, University of Cambridge.
Glossary
Abbreviations
- AFM
atomic force microscopy
- ASIC
acid-sensing ion channel
- CHAPS
3-[(3-cholamidopropyl)dimethylammonio]-1-propanesulphonate
- DSS
disuccinimidyl suberate
- ENaC
epithelial sodium channel
- GFP
green fluorescent protein
- HA
haemagglutinin
- HEK
human embryonic kidney
- PAGE
polyacrylamide gel electrophoresis
- TEA+
tetraethylammonium
Conflict of interest
None.
Supporting Information
Teaching Materials; Figs 1–5 as PowerPoint slide.
References
- Alexander SPH, Mathie A, Peters JA. Guide to Receptors and Channels (GRAC), 4th edn. Br J Pharmacol. 2009;158(Suppl. 1):S1–S254. doi: 10.1111/j.1476-5381.2009.00499.x. [DOI] [PMC free article] [PubMed] [Google Scholar]
- Antonio LS, Costa RR, Gomes MD, Varanda WA. Mouse Leydig cells express multiple P2X receptor subunits. Purinergic Signal. 2009;5:277–287. doi: 10.1007/s11302-008-9128-9. [DOI] [PMC free article] [PubMed] [Google Scholar]
- Aschrafi A, Sadtler S, Niculescu C, Rettinger J, Schmalzing G. Trimeric architecture of homomeric P2X2 and heteromeric P2X1+2 receptor subtypes. J Mol Biol. 2004;342:333–343. doi: 10.1016/j.jmb.2004.06.092. [DOI] [PubMed] [Google Scholar]
- Bai C-X, Giamarchi A, Rodat-Despoix L, Padilla F, Downs T, Tsiokas L, et al. Formation of a new receptor-operated channel by heteromeric assembly of TRPP2 and TRPC1 subunits. EMBO Rep. 2008;9:472–479. doi: 10.1038/embor.2008.29. [DOI] [PMC free article] [PubMed] [Google Scholar]
- Barrera NP, Ormond SJ, Henderson RM, Murrell-Lagnado RD, Edwardson JM. AFM imaging demonstrates that P2X2 receptors are trimers, but that P2X6 receptor subunits do not oligomerize. J Biol Chem. 2005;280:10759–10765. doi: 10.1074/jbc.M412265200. [DOI] [PubMed] [Google Scholar]
- Barrera NP, Henderson RM, Murrell-Lagnado RD, Edwardson JM. The stoichiometry of P2X2/6 receptor heteromers depends on relative subunit expression levels. Biophys J. 2007;93:505–512. doi: 10.1529/biophysj.106.101048. [DOI] [PMC free article] [PubMed] [Google Scholar]
- Boumechache M, Masin M, Edwardson JM, Górecki D, Murrell-Lagnado RD. Analysis of assembly and trafficking of native P2X4 and P2X7 receptor complexes in rodent immune cells. J Biol Chem. 2009;284:13446–13454. doi: 10.1074/jbc.M901255200. [DOI] [PMC free article] [PubMed] [Google Scholar]
- Casas-Pruneda G, Reyes JP, Pérez-Flores G, Pérez-Cornejo P, Arreola J. Functional interactions between P2X4 and P2X7 receptors from mouse salivary epithelia. J Physiol. 2009;587:2887–2901. doi: 10.1113/jphysiol.2008.167395. [DOI] [PMC free article] [PubMed] [Google Scholar]
- Clyne JD, Brown TC, Hume RI. Expression level dependent changes in the properties of P2X2 receptors. Neuropharmacology. 2003;44:403–412. doi: 10.1016/s0028-3908(02)00406-9. [DOI] [PubMed] [Google Scholar]
- Ding S, Sachs F. Evidence for non-independent gating of P2X2 receptors expressed in Xenopus oocytes. BMC Neurosci. 2002;3:17. doi: 10.1186/1471-2202-3-17. [DOI] [PMC free article] [PubMed] [Google Scholar]
- Egan TM, Khakh BS. Contribution of calcium ions to P2X channel responses. J Neurosci. 2004;24:3413–3420. doi: 10.1523/JNEUROSCI.5429-03.2004. [DOI] [PMC free article] [PubMed] [Google Scholar]
- Fujiwara Y, Kubo Y. Density-dependent changes of the pore properties of the P2X2 receptor channel. J Physiol. 2004;558:31–43. doi: 10.1113/jphysiol.2004.064568. [DOI] [PMC free article] [PubMed] [Google Scholar]
- Gonzales EB, Kawate T, Gouaux E. Pore architecture and ion sites in acid-sensing ion channels and P2X receptors. Nature. 2009;460:599–604. doi: 10.1038/nature08218. [DOI] [PMC free article] [PubMed] [Google Scholar]
- Guo C, Masin M, Qureshi OS, Murrell-Lagnado RD. Evidence for functional P2X4/P2X7 heteromeric receptors. Mol Pharmacol. 2007;72:1447–1456. doi: 10.1124/mol.107.035980. [DOI] [PubMed] [Google Scholar]
- Jiang L-H, Kim M, Spelta V, Bo X, Surprenant A, North RA. Subunit arrangement in P2X receptors. J Neurosci. 2003;23:8903–8910. doi: 10.1523/JNEUROSCI.23-26-08903.2003. [DOI] [PMC free article] [PubMed] [Google Scholar]
- Kapoor N, Bartoszewski R, Qadri YJ, Bebok Z, Bubien JK, Fuller CM, et al. Knockdown of ASIC1 and epithelial sodium channel subunits inhibits glioblastoma whole cell current and cell migration. J Biol Chem. 2009;284:24526–24541. doi: 10.1074/jbc.M109.037390. [DOI] [PMC free article] [PubMed] [Google Scholar]
- Kawate T, Michel JC, Birdsong WT, Gouaux E. Crystal structure of the ATP-gated P2X4 ion channel in the closed state. Nature. 2009;460:592–599. doi: 10.1038/nature08198. [DOI] [PMC free article] [PubMed] [Google Scholar]
- Khakh BS, North RA. P2X receptors as cell-surface ATP sensors in health and disease. Nature. 2006;442:527–532. doi: 10.1038/nature04886. [DOI] [PubMed] [Google Scholar]
- Khakh BS, Zhou X, Sydes J, Galligan JJ, Lester HA. State-dependent cross-inhibition between transmitter-gated cation channels. Nature. 2000;406:405–410. doi: 10.1038/35019066. [DOI] [PubMed] [Google Scholar]
- Khakh BS, Fisher JA, Nashmi R, Bowser DN, Lester HA. An Angstrom scale interaction between plasma membrane ATP-gated P2X2 and α4β2 nicotinic channels measured with fluorescence resonance energy transfer and total internal reflection fluorescence microscopy. J Neurosci. 2005;25:6911–6920. doi: 10.1523/JNEUROSCI.0561-05.2005. [DOI] [PMC free article] [PubMed] [Google Scholar]
- King BF, Townsend-Nicholson A, Wildman SS, Thomas T, Spyer KM, Burnstock G. Coexpression of rat P2X2 and P2X6 subunits in Xenopus oocytes. J Neurosci. 2000;20:4871–4877. doi: 10.1523/JNEUROSCI.20-13-04871.2000. [DOI] [PMC free article] [PubMed] [Google Scholar]
- Kobori T, Smith GD, Sandford R, Edwardson JM. The transient receptor potential (TRP) channels TRPP2 and TRPC1 form a heterotetramer with a 2:2 stoichiometry and an alternating subunit arrangement. J Biol Chem. 2009;284:35507–35513. doi: 10.1074/jbc.M109.060228. [DOI] [PMC free article] [PubMed] [Google Scholar]
- Köttgen M, Buchholz B, Garcia-Gonzalez MA, Kotsis F, Fu X, Doerken M, et al. TRPP2 and TRPV4 form a polymodal sensory channel complex. J Cell Biol. 2008;182:437–447. doi: 10.1083/jcb.200805124. [DOI] [PMC free article] [PubMed] [Google Scholar]
- Lalo U, Pankratov Y, Wichert SP, Rossner MJ, North RA, Kirchhoff F, et al. P2X1 and P2X5 subunits form the functional P2X receptor in mouse cortical astrocytes. J Neurosci. 2008;28:5473–5480. doi: 10.1523/JNEUROSCI.1149-08.2008. [DOI] [PMC free article] [PubMed] [Google Scholar]
- Lewis C, Neidhart S, Holy C, North RA, Buell G, Surprenant A. Coexpression of P2X2 and P2X3 receptor subunits can account for ATP-gated currents in sensory neurons. Nature. 1995;377:432–435. doi: 10.1038/377432a0. [DOI] [PubMed] [Google Scholar]
- Ma W, Korngreen A, Weil S, Cohen EB, Priel A, Kuzin L, et al. Pore properties and pharmacological features of the P2X receptor channel in airway ciliated cells. J Physiol. 2006;571:503–517. doi: 10.1113/jphysiol.2005.103408. [DOI] [PMC free article] [PubMed] [Google Scholar]
- Meltzer RH, Kapoor N, Qadri YJ, Anderson SJ, Fuller CM, Benos DJ. Heteromeric assembly of acid-sensitive ion channel and epithelial sodium channel subunits. J Biol Chem. 2007;282:25548–25559. doi: 10.1074/jbc.M703825200. [DOI] [PubMed] [Google Scholar]
- Mio K, Kubo Y, Ogura T, Yamamoto T, Sato C. Visualization of the trimeric P2X2 receptor with a crown-capped extracellular domain. Biochem Biophys Res Commun. 2005;337:998–1005. doi: 10.1016/j.bbrc.2005.09.141. [DOI] [PubMed] [Google Scholar]
- Mio K, Ogura T, Yamamoto T, Hiroaki Y, Fujiyoshi Y, Kubo Y, et al. Reconstruction of the P2X2 receptor reveals a vase-shaped structure with lateral tunnels above the membrane. Structure. 2009;17:266–275. doi: 10.1016/j.str.2008.12.007. [DOI] [PubMed] [Google Scholar]
- Murrell-Lagnado RD, Qureshi OS. Assembly and trafficking of P2X purinergic receptors. Mol Membr Biol. 2008;25:321–331. doi: 10.1080/09687680802050385. [DOI] [PubMed] [Google Scholar]
- Nicke A. Homotrimeric complexes are the dominant assembly state of native P2X7 subunits. Biochem Biophys Res Commun. 2008;377:803–808. doi: 10.1016/j.bbrc.2008.10.042. [DOI] [PubMed] [Google Scholar]
- Nicke A, Baumert HG, Rettinger J, Eichele A, Lambrecht G, Mutschler E, et al. P2X1 and P2X3 receptors form stable trimers: a novel structural motif of ligand-gated ion channels. EMBO J. 1998;17:3016–3028. doi: 10.1093/emboj/17.11.3016. [DOI] [PMC free article] [PubMed] [Google Scholar]
- North RA. Molecular physiology of P2X receptors. Physiol Rev. 2002;82:1013–1067. doi: 10.1152/physrev.00015.2002. [DOI] [PubMed] [Google Scholar]
- Rubio ME, Soto F. Distinct localization of P2X receptors at excitatory postsynaptic specializations. J Neurosci. 2001;21:641–653. doi: 10.1523/JNEUROSCI.21-02-00641.2001. [DOI] [PMC free article] [PubMed] [Google Scholar]
- Schneider SW, Lärmer J, Henderson RM, Oberleithner H. Molecular weights of individual proteins correlate with molecular volumes measured by atomic force microscopy. Pflügers Arch. 1998;435:362–367. doi: 10.1007/s004240050524. [DOI] [PubMed] [Google Scholar]
- Shinozaki Y, Sumimoto K, Tsuda M, Koizumi S, Inoue K, Torimitsu K. Direct observation of ATP-induced conformational changes in single P2X4 receptors. Plos Biol. 2009;7:e103. doi: 10.1371/journal.pbio.1000103. [DOI] [PMC free article] [PubMed] [Google Scholar]
- Söderberg O, Gullberg M, Jarvius M, Ridderstråle K, Leuchowius K-J, Jarvius J, et al. Direct observation of individual endogenous protein complexes in situ by proximity ligation. Nat Meth. 2006;3:995–1000. doi: 10.1038/nmeth947. [DOI] [PubMed] [Google Scholar]
- Stewart AP, Smith GD, Sandford R, Edwardson JM. Atomic force microscopy reveals the alternating subunit arrangement of the TRPP2-TRPV4 heterotetramer. Biophys J. 2010;99:790–797. doi: 10.1016/j.bpj.2010.05.012. [DOI] [PMC free article] [PubMed] [Google Scholar]
- Stoop R, Thomas S, Rassendren F, Kawashima E, Buell G, Surprenant A, et al. Contribution of individual subunits to the multimeric P2X2 receptor: estimates based on methanethiosulfonate block at T336C. Mol Pharmacol. 1999;56:973–981. doi: 10.1124/mol.56.5.973. [DOI] [PubMed] [Google Scholar]
- Surprenant A, North RA. Signaling at purinergic P2X receptors. Annu Rev Physiol. 2008;71:333–359. doi: 10.1146/annurev.physiol.70.113006.100630. [DOI] [PubMed] [Google Scholar]
- Torres GE, Egan TM, Voight MM. Hetero-oligomeric assembly of P2X receptor subunits. Specificities exist with regard to possible partners. J Biol Chem. 1999;274:6653–6659. doi: 10.1074/jbc.274.10.6653. [DOI] [PubMed] [Google Scholar]
- Tsiokas L, Arnould T, Zhu C, Kim E, Walz G, Sukhatme VP. Specific association of the gene product of PKD2 with the TRPC1 channel. Proc Natl Acad Sci USA. 1999;96:3934–3939. doi: 10.1073/pnas.96.7.3934. [DOI] [PMC free article] [PubMed] [Google Scholar]
- Young MT, Fisher JA, Fountain SJ, Ford RC, North RA, Khakh BS. Molecular shape, architecture, and size of P2X4 receptors determined using fluorescence resonance energy transfer and electron microscopy. J Biol Chem. 2008;283:26241–26251. doi: 10.1074/jbc.M804458200. [DOI] [PMC free article] [PubMed] [Google Scholar]
Associated Data
This section collects any data citations, data availability statements, or supplementary materials included in this article.