

Abstract
Ribosomes exist as a heterogenous pool of macromolecular complexes composed of ribosomal RNA molecules, ribosomal proteins and numerous associated, “non-ribosomal” proteins. To identify non-ribosomal proteins that may modulate ribosome activity, we examined the composition of translationally active and inactive ribosomes using a proteomic multidimensional protein identification technology. Notably, the phosphorylated isoform of glycogen synthase, GYS1, was preferentially associated with elongating ribosomes. Depletion of GYS1 affected the translation of a subset of cellular mRNAs, some of which encode proteins that modulate protein biosynthesis. These findings argue that GYS1 abundance, and by virtue of its ribosomal association, provide a feedback loop between the energy state of the cells and the translation machinery.
Keywords: Translational control, energy metabolism, mass spectrometry, translational profiling, ribosome filter
Introduction
It has long been known that eukaryotic ribosomes are not homogenous, but that individual ribosomes differ in the composition and modification state of their constituent proteins and RNAs 1; 2; 3. Based upon the hypothesis that the heterogeneity of eukaryotic ribosomes may enable cells to execute rapid changes in protein expression, it has been speculated that subpopulations of ribosomes may control translation of specific mRNAs 4; 5. Support for this speculation has been provided from studies in S. cerevisiae, which contains many duplicated ribosomal protein-encoding genes. For example, cells that lack one copy of particular ribosomal protein genes developed altered effects on the translation of localized ASH1 mRNA, suggesting that the “duplicated” ribosomal protein has a distinct function 6. Non-ribosomal proteins have also been shown to contribute to ribosome heterogeneity. For example, proteins releated to the laminin binding protein precursor LBP/p40 are required for maturation of 20S ribosomal RNA and stability of the 40S subunit in S. cerevisiae 7; 8. In Drosophila melanogaster, Reaper protein, a regulator of apoptosis, has been shown to affect protein biosynthesis. Reaper binding to the 40S ribosomal subunit inhibited cap-dependent mRNA translation, but not internal ribosome entry-mediated mRNA translation 9. The receptor of activated protein kinase C (RACK1) is also a 40S-binding protein and has been shown to recruit activated protein kinase C to the ribosome, thereby linking the translation machinery to signal transduction pathways 10. Loss of RACK1 in Saccharomyces pombe caused only a small decrease in global cellular translation, but resulted in a large reduction of ribosomal protein L25 10. Because the abundance of rpL25 mRNA was unaffected upon depletion of RACK1, RACK1 has been suggested to control translation of the rpL25 mRNA.
To address whether distinct subsets of ribosomes in mammalian cells preferentially translate specific mRNAs, we have purified inactive and actively translating ribosomes from HeLa cells. Analysis of these ribosome populations by mass spectrometry revealed few differences in the association of non-ribosomal proteins with inactive and active ribosomes, with one striking exception, glycogen synthase 1 (GYS1), which we found to be specifically associated with polysomes.
GYS1 belongs to the family of glycosyltransferases and catalyzes the rate-limiting step during glycogen biosynthesis 11; 12. It uses the donor molecule UDP-glucose to lengthen glycogen chains by forming alpha-1,4-glycosidic linkages 11; 12. The activity of GYS1 is regulated by phosphorylation by glycogen synthase kinase 3 (GSK-3) and other kinases. Phosphorylation inhibits GYS1 activity, by converting GYS1 from a glucose-6-phosphate-independent (I-form) into a glucose-6-phosphate-dependent form (D-form) 12. Humans express two GYS isoforms encoded by the GYS1 and GYS2 genes 13; 14. The highest levels of GYS1 are in skeletal and cardiac muscle; in contrast, GYS2 is only found in the liver 15. Interestingly, most mice lacking GYS1 are not viable and die shortly after birth due to failure of their lungs to inflate 16. In addition, they display abnormal heart morphology, hemorrhagic livers and venous and pulmonary congestion. The phenotype of the surviving mice is similar to the glycogen storage disease type 0 in humans. This disease displays lack of muscle glycogen, an increase in oxidative muscle fibers and mitochondrial proliferation 16; 17. Even though the disease is rare in humans, it has been speculated that GYS1 deficiency could be a common cause of sudden cardiac arrest in infants and children 18. Here, we have identified GYS1 as a novel protein factor associated with actively translating ribosomes. Specifically, phosphorylation of serine 640 in GYS1 correlated with association of GYS1 with translating ribosomes. Depletion of GYS1 from HeLa cells resulted in a loss of polysomes, and microarray analysis revealed changes in abundances and translation of particular subsets of mRNAs.
Results
Preparation of translationally active and inactive ribosomes from cultured HeLa cells
To isolate distinct ribosome populations, translationally active and inactive ribosomes from human HeLa cells were separated by sucrose gradient sedimentation after treatment with cycloheximide to stabilize ribosome-mRNA complexes. Translationally inactive ribosomal subunits migrated as 40S and overlapping 60S/80S complexes in the top half of the gradient, while translating ribosomes migrated near the bottom of the gradient (Fig. 1A). Following addition of the magnesium-chelating reagent EDTA, or the translation elongation inhibitor puromycin 19, the rapidly sedimenting ribosomes disassembled and relocated towards the top half of the gradient (data not shown), confirming that the rapidly sedimenting species represented bona fide polysomes. To identify ribosomal proteins and associated non-ribosomal proteins, inactive and active ribosomal fractions (Fig. 1A) were pooled and processed (see Materials and Methods) for analyses by multidimensional protein identification technology (MudPIT). Analysis of the MudPIT data showed that ribosomal proteins could be identified in all pooled preparations. The average coverage was 49% for 40S ribosomal proteins and 32% for 60S ribosomal proteins (Suppl. Table 1).
Fig. 1.

Detection of glycogen synthase (GYS1) and phosphorylated GYS1 (pGYS1) in inactive and active ribosomal preparations. (A) Polysomal profiles of preparative gradients from HeLa cell extracts grown in suspension. Cytoplasmic lysates were treated with cycloheximide and separated by ultracentrifugation in 10–50% sucrose gradients. The absorbance profiles measured at 254 nm of collected gradient fractions are shown. The positions of 40S and 60S ribosomal subunits (inactive ribosomes) and polysomes (active ribosomes) are shown. Due to the large scale preparation, the peaks are broadened resulting in the fusion of the 80S with the 60S peak. (B) Inactive 40S/60S subunits fractions, actively translating polysomal samples and total HeLa lysate were separated by SDS-polyacrylamide gel electrophoresis. The presence of pGYS1, phosphorylated on Ser640, and total GYS1 protein in the polysomal fractions was examined by Western blot analysis. The ribosomal proteins S6 (small subunit) and L13a (large subunits) served as controls for the presence of ribosomal subunits. (C) Total HeLa cell lysate and polysomal ribosome samples were treated with calf intestinal phosphatase (CIP) and separated by SDS-polyacrylamide gel electrophoresis. Western blot analysis was used to detect pGYS1 and GYS1 forms.
Association of glycogen synthase 1 (GYS1) with translationally active ribosomes
MudPIT analysis of the 0.5M KCl-washed ribosomal preparations identified a few non-ribosomal associated proteins. For example, a few tRNA synthetases, the eukaryotic translation initiation factor eIF6 and the enhancer of mRNA decapping Ge-1 were associated with the inactive ribosome pool (data not shown). In contrast, the polyadenosine binding protein PABP was present in both active and inactive ribosome samples. These findings were not unexpected, because translation initiation factors and the PABP are known to be ribosome-associated 20. Surprisingly, the MudPIT analysis revealed the association of the metabolic enzyme glycogen synthase 1 (GYS1), a crucial regulatory protein in cellular energy storage 12, with actively translating ribosomes. This finding motivated us to investigate a role for GYS1 in translational regulation.
To verify the predicted association of GYS1 with elongating ribosomes, the inactive 40/60S and active polysomal samples (Fig. 1A) were subjected to immuno blot analysis using two different antibodies. One that detects total GYS1 and one that recognizes only a phosphorylated form of GYS1 (pGYS1) that carries a phosphate moiety on serine residue 640 (Cell Signaling Technology, Danvers, MA). 40S-associated protein S6 and 60S-associated protein L13a were, as expected, detected in both inactive and active ribosomal fractions (Fig. 1B). Both anti-GYS1 antibodies identified protein in the total lysate and in the polysomal fraction, but not in the 40S/60S fraction (Fig. 1B).
To determine the extent to which the polysome-associated GYS1 was phosphorylated, total HeLa cell lysate and the polysomal fraction were incubated with calf intestine phosphatase (CIP) and the immunoblot was repeated. Figure 1C shows that after treatment with CIP, the phospho-specific GYS1 antibody no longer detected pGYS1 in either the total HeLa lysate or in the polysomal sample, showing that phosphatase treatment was effective. The changes in intensity of the total GYS1 bands show that, while only a subset of GYS1 in the total lysate was phosphorylated, the majority of polysome-associated GYS1 was phosphorylated at Ser640.
To examine in more detail the association of GYS1 with translating ribosomes, cytoplasmic extracts were separated in linear 10–60% sucrose gradients and the sedimentation of GYS1 was examined across the gradient fractions. Figure 2A shows that pGYS1 was predominantely associated with fractions 8–11, while the distribution of total GYS1 was mostly found in fractions 7–11, slightly shifted to less rapidly sedimenting fractions. To distinguish whether the sedimentation of the phosphorylated and total GYS1 forms reflected their association with polysomes, as opposed to their presence in other fast sedimenting complexes, extracts were treated with puromycin prior to sucrose gradient sedimentation. Puromycin is an elongation inhibitor that, under certain conditions, can release ribosomes from mRNAs and disassemble ribosomes into 40S and 60S subunits 19. Figure 2B shows that as expected, puromycin treatment caused the relocation of ribosomal proteins S6 and L13a to lower sedimenting fractions in the gradient. Similarly, a fraction of pGYS1 relocated from fractions 8–11 to slower sedimenting fractions 4–10 in puromycin-treated gradients. However, not all of pGYS1 resediments following puromycin treatment, and the puromycin-insensitive fraction of pGYS1 likely represents heavy sedimenting complexes, possibly pGYS1 attached to glycogen. In contrast, the sedimentation of total GYS1 was not significantly affected (Fig. 2B). Figure 2C quantifies the relocation of pGYS1 towards the less dense fractions in the gradient after puromycin treatment, arguing that a portion of pGYS1 was associated with ribosomes.
Fig. 2.

Polysomal distribution of GYS1 and pGYS1. (A) HeLa cells were treated with 0.1 mg/ml cycloheximide, lysates prepared, separated in a 10–60% sucrose gradient as shown in Figure 1. Distribution of pGYS1, GYS1 and ribosomal proteins S6 and L13a was examined by Western blot analysis. (B) HeLa cells were treated with 2 mM puromycin for 15 min on ice and 10 min at 37°C, extracts prepared and processed as in (A). (C) Quantitation of the distribution of GYS1 and pGYS1 after cycloheximide and puromycin treatment. The set of Western blots shown in (A) and (B) were used for the shown quantitation and are representative for results from several experiments.
To examine whether pGYS1 was associated with 40S or 60S ribosomal subunits in actively translating ribosomes, cell lysates were separated in 5–25% linear sucrose gradients. Distribution of GYS1 in gradients from cycloheximide-treated (Fig. 3A) or from puromycin-treated (Fig. 3B) lysates showed that GYS1 predominately co-sedimented with 60S ribosomal subunits. Similarly, analysis of 40S and 60S ribosomal subunits, purified by a different procedure (see Materials and Methods) revealed that pGYS1 co-sedimented with 60S subunits (Fig. 3C). These findings argue that pGYS1 is associated with 60S subunits in cell lysates. These findings suggest that the phosphorylated form of GYS1 11, which is inactive in glycogen biosynthesis, is associated with elongating ribosomes, arguing for a function of pGYS1 in modulating translation.
Fig. 3.

Association of pGYS1 with 60S ribosomal subunits. HeLa cells were treated with cycloheximide (A) or puromycin (B) as described in the legend to Figure 2 and cell lysates were separated in 5–25% sucrose gradients. Absorbance at 254 nm was measured. Absorbance peaks that correspond to the 40S and 60S subunits are indicated. The distribution of GYS1, pGYS1, S6 and L13a was analyzed by Western blot. (C) Purified 40S and 60S subunit fractions were separated in SDS-polyacrylamide gels and analyzed in Western blots using antibodies directed against pGYS1, GYS1. S6 and L13a.
Depletion of GYS1 by siRNA-mediated gene knock down results in loss of polysomes
To examine potential roles for pGYS1 in translation, GYS1 mRNA abundance was diminished by siRNA-mediated gene knock down. Figure 4A shows that more than 80% of total GYS1 and pGYS1 protein could be depleted after GYS1 siRNA 1 treatment. Next, cycloheximide-treated extracts from control- or GYS1-siRNA treated cells were separated in sucrose gradients and polysomal profiles were analyzed. Figure 4B shows that depletion of GYS1 resulted in the loss of polysomes, especially, of mRNAs that contained more than two ribosomes. To exclude that the observed phenotype was due to an off-target effect caused by the transfected siRNA, cells were transfected with a different siRNA, GYS1 siRNA 2. Similar to depletion of GYS1 by GYS1 siRNA 1, depletion of GYS1 by GYS1 siRNA 2 resulted in the loss of polysomes (Supplemental Fig. 1). In contrast, ectopic overexpression of flag-tagged GYS1 increased polysome abundance compared to cells transfected with a control vector (Fig. 4C). To examine the possibility that ribosomes were lost during the preparation of lysates from GYS1 siRNA 1 -treated cells, extracts were treated with puromycin or EDTA and separated on sucrose gradients. Figures 4D and 4E show that the total abundances of 40S and 60S subunits were similar in control- and GYS1 siRNA 1 - treated extracts treated with puromycin or EDTA, respectively, arguing against an overall loss of ribosomes when GYS1 was depleted. Next, the effect of GYS1 depletion on global cellular translation was determined by metabolic labeling of cells with 35S-methionine. Although cells depleted of GYS1 showed a small decrease in 35S-methionine incorporation (Supplemental Fig. 2), these differences were statistically not significant, suggesting that GYS1 might control translation of only a subset of mRNAs.
Fig. 4.

Polysomal phenotype of siRNA-mediated gene knock down of GYS1. (A) Quantitation of siRNA-mediated gene depletion of GYS1 and pGYS1. Extracts from HeLa cells, transfected with 50 nM GYS1 or control siRNAs, were separated by SDS-polyacrylamide gel electrophoresis and pGYS1 and GYS1 abundances examined by Western blot analysis. Actin was used as an internal control. (B) Polysomal distribution in control siRNA- and GYS1 siRNA-treated extracts. Cell lysates, treated as described in (2A) were separated by ultracentrifugation in 10–60% sucrose gradients. Overlays of the 254nm absorbance profiles are shown. (C) Polysome distribution in HeLa cells transfected with empty 3xFLAG vector or 3xFLAG-GYS1 DNA. Overlay of the 254nm absorbance profiles following separation of cells lysates in 10–60% sucrose gradients are shown. (D, E) Quantitation of ribosomal subunits in control siRNA- and GYS1 siRNA-treated extracts. Ribosomal subunits were released from polysomes and dissociated into 40S and 60S subunits by either treatment with 2 mM puromycin (D) or 15 mM EDTA (E). Cell lysates were separated in 10–60% sucrose gradient and absorbance was measured at 254 nm.
Altered ribosomal occupation of subsets of mRNAs during depletion of GYS1
To examine effects of GYS1 depletion on translation of specific mRNAs, HeLa were treated with control- or GYS1-siRNAs and light (Fig. 4B, fractions 8–9), medium (Fig. 4B, fractions 10–11) and heavy (Fig. 4B, fractions 12–13) polysomal fractions were collected. Polyadenosine-containing mRNA was prepared from each fraction and hybridized in triplicate to DNA microarrays containing 50,000 genes (Phalanx Biotech; Palo Alto, CA). Approximately 275 genes were identified that showed reproducibly different hybridization signals (p-value of <0.1) between different samples. These genes could be divided into four classes (Fig. 5A): (1) mRNA whose abundance was diminished in GYS1-siRNA treated cells, in both input and all three polysomal samples. This class of mRNAs is likely to be regulated at the transcriptional step or turnover step during GYS1 depletion. (2) mRNA whose abundance was diminished in the input and light polysomal samples, but enhanced in heavy polysomal samples. This class of mRNA is likely translationally enhanced during GYS1 depletion. (3) mRNA whose abundance was enhanced in the input sample, but diminished in heavy polysomal fraction. These mRNAs are likely translationally inhibited, but are stabile or transcriptionally induced during GYS1 depletion. (4) mRNA whose abundance was enhanced in both input and polysomal samples. The transcription or stabilization of these mRNAs is likely enhanced during GYS1 depletion. Hybridization probes to selected mRNAs (Suppl. Table 2 and 3) from the four categories were prepared and the total abundances of the mRNAs examined in Northern blot analyses. Figure 5B shows that with very few exceptions, the quantitation of the Northern blots mimicked the results obtained in the microarray analyses. Furthermore, both GYS1-targeting siRNAs affected the abundance of the tested mRNAs similarly, indicating that the observed results are less likely to be off-target effects caused by the siRNAs (Supplemental Fig. 3). Taken together, these findings suggest that depletion of intracellular GYS1 affects the abundances and translational efficiencies of a subset of mRNAs (Suppl. Table 2).
Fig. 5.

Microarray profiling of polysomal fractions isolated from control siRNA- and GYS1 siRNA-treated cells. (A) HeLa cells were transfected with siRNAs and separated on gradients as shown in Figure 4B. Sucrose gradient fractions 8–9, 10–11, and 12–13 were pooled and are indicated as light, medium and heavy polysomes, respectively (see Figure 4B). PolyA-selected RNA was prepared from the gradient input fraction and the various polysomal fractions. Human whole genome oligonucleotide arrays were performed in triplicate on each sample and normalized and averaged on OneArray platforms, performed by Phalanx Biotech. (Palo Alto, CA). Samples from cells transfected with GYS1 siRNAs were compared to samples from cells transfected with control siRNAs. Cluster analysis of genes with a differential p-value of <0.1 was performed. The scale of the heat-map is presented as log2 fold-change. RNAs were categorized into four classes: (1) mRNA whose abundance was diminished in both input and polysomal samples, (2) mRNA whose abundance was diminished in the input sample, but enhanced in heavy polysomal samples, (3) mRNA whose abundance was enhanced in the input sample, but diminished in heavy polysomal fraction, (4) mRNA whose abundance was enhanced in both input and polysomal samples. Several mRNAs displaying significant changes within each of those four classes were chosen for further analysis. (B) Quantitation of selected mRNAs. Changes in total mRNA abundance of selected mRNAs by Northern blot analysis (red bars), compared to the microarray results (blue bars) of the input sample are shown.
To identify which mRNAs were specifically affected translationally during GYS1 depletion, the ratios of total polysomal fraction/input RNA in GYS1 siRNA-treated samples were calculated and compared to control siRNA-treated samples (Supplemental Fig. 4). The mRNAs previously identified as members of categories 2 and 3 (Fig. 5A and B) showed a similar pattern when the total polysomal distribution of the mRNAs was examined (Fig. 6A). Specifically, Figure 6A shows that even certain mRNAs with lower abundances during depletion of GYS1 (e.g. JUND, MRPS27, SRP14, BSG) associated with more ribosomes during GYS1 depletion. In contrast, certain mRNAs with higher abundances during depletion of GYS1 (e.g. PYROXD1, LMAN1, KLF13) associated with fewer ribosomes during depletion (Fig. 6A, B). Moreover, GYS1-siRNA 1 treatment dramatically reduced the abundance of GYS1 mRNA (Fig. 5A, B), and the low abundant GYS1 mRNA was associated with only few ribosomes (Fig. 6A, B). These findings argue that GYS1 abundance in cells controls the translation of a subset of mRNAs, including its own mRNA. Additionally, some of the polysomal redistributed mRNAs, such as the 4E-BP mRNAs, encode important translational regulators. Although total levels of 4E-BP1 and 4E-BP2 mRNAs are decreased in cells depleted of GYS1 (Fig. 5B and data not shown), the 4E-BP2 mRNA is shifted to the medium polysomal fraction during GYS1 depletion (Fig. 6B). To test whether the changes in mRNA abundance and the redistribution of mRNA within polysomes affected protein abundance, the abundances of 4E-BP1, 4E-BP2, GYS1 and actin were analyzed in cells that were depleted of GYS1 or were overexpressing GYS1. Immunoblot analysis revealed that 4E-BP protein abundances were moderately increased in cells depleted of GYS1, but were moderately reduced in cells overexpressing GYS1 (Fig. 6C, 6D).
Fig. 6.

Translational control of a subset of mRNAs by GYS1. (A) Cluster analysis on the subset of mRNAs, which were selected for further analyses in Northern blots. The heat-map displays the log2 fold-change. Three classes of mRNAs can be defined: (1) mRNAs with enhanced abundance in heavy polysomes, (2) mRNAs with enhanced abundance in light and medium polysomes, (3) mRNAs with diminished abundance mostly in heavy polysomes. (B) Quantitation of selected mRNAs. Changes in total mRNA abundance of selected mRNAs by Northern blot analysis (red bars), compared to the microarray results (blue bars) of the input sample are shown. (C) Western blot analysis of 4E-BP1, 4E-BP2, GYS1 and actin in cells depleted of or overexpressing GYS1. (D) Quantitation of Western blots for 4E-BP1, 4E-BP2 and GYS1 from independent experiments. The error bars represent the standard error (SE).
Discussion
Using mass spectrometry analysis, the composition of inactive and actively translating ribosomes was analyzed. We identified phosphorylated GYS1 as a novel polysome-associated factor in HeLa cells. The only function described for GYS1 so far has been its metabolic role in glycogen biosynthesis 12, but our results argue that the phosphorylated form of GYS1 may have an additional function in translational control. This notion is supported by a recent proteomic study on the endoplasmic reticulum from mouse liver, in which GYS2, the liver-specific isoform of GYS1, was identified to be highly enriched on the rough ER, but not on the smooth ER or in the cytosol 21.
The phosphorylated form of GYS1 was mostly associated with 60S ribosomal subunits. This finding suggests that pGYS1 is not associated with stress granules, which usually harbor translationally stalled 48S-mRNA complexes 22. Indeed, pGYS1 was not associated with stress granules upon treatment of HeLa cells with arsenite (Supplemental Fig. 5), indicating that pGYS1 is probably not part of the 48S initiation complex.
The regulation of GYS1 in glycogen synthesis is still enigmatic. It is the rate-limiting enzyme in glycogen biosynthesis and is highly regulated. The activity of GYS1 is modulated via feedback inhibition by glycogen and binding of allosteric ligands. Furthermore, GYS1 contains multiple phosphorylation sites in both the N-terminus and the C-terminus. Several different kinases, such as glycogen synthase kinase 3 (GSK-3), the casein kinases, and others have been shown to covalently phosphorylate GYS1 in vitro and in vivo at the different sites resulting in the inactivation of the enzyme. This inactivation of GYS1 can either be reversed by dephosphorylation by a phosphatase or overcome by binding of the allosteric ligand glucose-6-phosphate, independently of its phosphorylation status 12; 23. We show here that one particular phosphorylated form of GYS1 is specifically associated with polysomes. This fraction of GYS1 is at least phosphorylated at the amino acid Serine 640, the major phosphorylation site for GSK-3. To test if depletion of GSK-3, one upstream regulator of GYS1, also affects polysome abundance, we depleted cells of both isoforms of GSK-3, GSK-3 α and GSK-3 β, after treatment with siRNAs. Interestingly, depletion of GSK-3 α did not result in loss of polysomes, but depletion of GSK-3 β resulted in a polysomal profile that was very similar to the one observed after depletion of GYS1 (Supplemental Fig. 6). This finding suggests that the phosphorylation of GYS1 by GSK-3 β may be an important cellular signal for its function in translational control.
Direct evidence for a role of GYS1 in translation was obtained from siRNA-mediated GYS1 depletion experiments. Indeed, microarray analysis on polysomal RNAs identified two groups of mRNAs that were either translationally inhibited or translationally upregulated when GYS1 was depleted, but neither gene ontology nor pathway analysis revealed any shared aspects. Of the 92 mRNAs that displayed decreased abundance in their input, the polysomal association of 39 mRNAs did not change (Figure 7). Only 12 mRNA also displayed a decreased polysomal association, while the polysomal association of 41 mRNAs increased (Figure 7). The opposite was observed for the group of mRNAs that increased in mRNA abundance in the input. While the polysomal association of 103 mRNAs did not significantly change, polysomal association of 55 mRNAs was reduced, but only increased for 20 mRNAs (Figure 7). These findings suggest that pGYS may fine-tune protein expression by coordinating mRNA abundance and translation rates. Further bioinformatic analysis on the mRNAs within these groups has not revealed common structural motifs in RNAs within each group. However, several mRNAs that encode proteins involved in the translation process were affected by depletion of GYS1. These included mRNAs that encode mitochondrial ribosomal proteins MRPL17 and MRPS27, signal recognition particle component SRP14, leucyl-tRNA synthetase LARS, as well as the mRNAs encoding cap binding protein eIF4E. Interestingly, abundance of 4E-BP2 mRNA, encoding an inhibitor of eIF4E, was decreased after GYS1 depletion. However, its redistribution and association with more ribosomes resulted in slightly increased 4E-BP protein abundance. Interestingly, a role for translation regulation in energy flux was shown by the phenotype of 4E-BP2 −/− mice, which display an increased sensitivity to diet-induced obesity and develop insulin resistance as a result of reduced energy expenditure 24. Thus, it is likely that GYS1 provides a feedback loop between the energy state of the cells and the translation machinery.
Fig. 7.
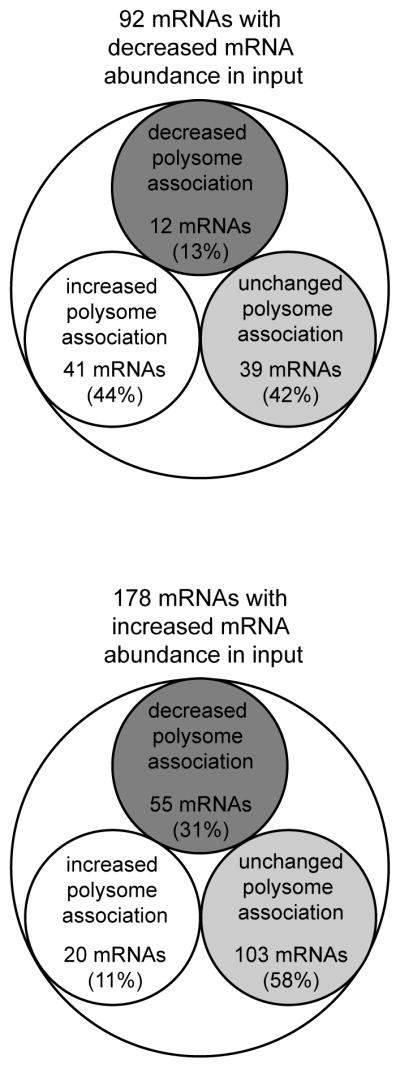
Correlation of mRNA abundance and polysomal association. The mRNAs from the heat map in Figure 5 were divided into two groups. Group 1 contains mRNAs with a decreased abundance (log2<0), and group 2 contains mRNAs with an increased abundance (log2>0) in cells depleted of GYS1. The microarray intensities of mRNAs in polysomes, expressed as a fraction mRNApolysomal fraction/mRNAtotal in siRNA GYS1-treated samples divided by mRNApolysomal fraction/mRNAtotal in siRNA control-treated samples, were divided into three groups. These include mRNAs found to be enriched (log2>0.5) in polysomes, mRNAs found to be depleted in polysomes (log2<−0.5), and mRNAs with an unchanged polysomal association (−0.5<log2<0.5).
Materials and methods
Ribosome preparation
Ribosomal subunits were purified from 107 suspension HeLa cells. The cells were washed three times with cold phosphate-buffered saline (PBS), lysed in 20 ml Triton X-100 lysis buffer (15 mM Tris–HCl (pH 7.5), 300 mM NaCl, 6 mM MgCl2,1% (v/v) Triton X-100, 1 mg/ml heparin). Extracts were homogenized by 5 strokes with a dounce homogenizer and incubated on ice for 10 min. Lysates were briefly cleared by low speed centrifugation (10000 rpm for 15 min at 4ºC) to remove debris and the supernatant was adjusted to 0.5M KCl and layered onto a 30 ml 10–50% sucrose gradient. The gradients were spun at 20,000 rpm for 9 hrs in an SW28 rotor at 4° C. The gradients were collected by pumping 75% sucrose into the bottom of the gradient and collecting from the top using an ISCO fraction collection system, with concomitant measurement of the absorbance at 254 nm. The fractions containing the 40S and 60S ribosomal subunits were pooled as “Inactive 80S”. The polysomes fractions were pooled as “Active 80S”.The pools were concentrated using Amicon Ultra Centrifugal Filters (100 kD MWCO) into buffer C (20 mM Tris–HCl (pH 7.5), 0.2 mM EDTA, 10 mM KCl, 1 mM MgCl2, 6.8% sucrose) and stored at −80ºC.
Mass spectrometry
Mass spectrometry was performed by the Proteomics/Mass Spectrometry Laboratory at UC Berkeley. The ribosome samples were adjusted to 8M urea, subjected to carboxyamidomethylation of cysteines, and digested with trypsin. The sample was then desalted using a C18 spec tip (Varian). A nano LC column was packed in a 100 μm inner diameter glass capillary with an emitter tip. The column consisted of 10 cm of Polaris c18 5 μm packing material (Varian), followed by 4 cm of Partisphere 5 SCX (Whatman). The column was loaded by use of a pressure bomb and washed extensively with buffer A (see below). The column was then directly coupled to an electrospray ionization source mounted on a Thermo-Fisher LCQ ion trap mass spectrometer. An Agilent 1100 HPLC equipped with a split line so as to deliver a flow rate of 30 nl/min was used for chromatography. Peptides were eluted using a 14-step MudPIT procedure 25. Buffer A was 5% acetonitrile/ 0.02% heptaflurobutyric acid (HFBA); buffer B was 80% acetonitrile/ 0.02% HFBA. Buffer C was 250 mM ammonium acetate/ 5% acetonitrile/ 0.02% HFBA; buffer D was same as buffer C, but with 500 mM ammonium acetate. The programs SEQUEST and DTASELECT were used to identify peptides and proteins from the human database 26; 27. Xcorr cutoffs of 1.8, 2.2 and 3.5 were used for inclusion of peptides with +1, +2 and +3 charge states, respectively. These cutoffs have been shown to yield peptide identifications with considerably less than a 1% false positive rate. Two peptides meeting these statistical criteria were required to consider a protein as positively identified. The same Xcorr cutoffs were applied to post-translationally modified peptides. Representative spectra were inspected manually to verify the probability of correctly identified modification sites.
Cell culture and siRNA transfection
Adherent HeLa cells were grown in Dulbecco modified Eagle’s medium (high glucose DMEM containing L-glutamine and 110 mg/L sodium pyruvate, Invitrogen) supplemented with 10% fetal bovine serum (FBS) and 2 mM L-glutamine.
For siRNA transfection, 50 nM siRNA were transiently transfected using DharmaFECT 1 (Dharmacon/Thermo Scientific) following the manufacturer’s directions. Cells were replated 24 hours after transfection and harvested 72 hours after transfection for polysome or Western blot analyses. The sequences and properties of control siRNA #3 have been described recently 28. The glycogen synthase siRNAs were designed using the siDESIGN Center by Dharmacon/Thermo Scientific. The corresponding sequences for glycogen synthase siRNAs are GYS1 siRNA 1 sense strand 5′-CCAACACGGUGAAGGAAAAUU-3′; and GYS1 siRNA 1 antisense strand, 5′-UUUUCCUUCACCGUGUUGGUU-3′ (purchased from Dharmacon/Thermo Scientific); GYS1 siRNA 2 sense strand 5′-CCUCCUUCCUCUACAGUUUUU-3′; and GYS1 siRNA 2 antisense strand, 5′-AAACUGUAGAGGAAGGAGGUU-3′ (purchased from Protein and Nucleic Acid Facility at Stanford University). The GSK-3A (SI00288554) and GSK-3B (SI00605479) siRNAs were experimentally verified FlexiTube siRNAs (Qiagen). The untagged full-lenth GYS1 cDNA was (Origene) cloned into the NotI and EcoRV sites of the p3xFLAG-CMV™-7 expression vector (Sigma) and transfected into HeLa cells using Lipofectamine 2000 (Invitrogen).
Western blot analysis
HeLa cells were lysed in Promega passive lysis buffer by repeated freeze-thawing. Lysates were cleared at 14000 rpm for 15 min at 4°C. For alkaline phosphatase treatment, samples were incubated with 20 units of calf intestinal alkaline phosphatase (CIP, New England Biolabs) in buffer containing 100 mM NaCl, 50 mM Tris-HCl pH 7.9, 10 mM MgCl2, 1mM DTT for 60 min at 37°C.
Proteins from sucrose gradients were precipitated with 4 volumes of 100% methanol in the presence of 1 mg/ml heparin, pelleted at 14000 rpm for 2 min and resuspended directly in 1x Laemmli buffer containing 100 mM DTT, 4 M urea and 50 mM Tris-HCl pH 8.5.
For preparation of total cell lysates, HeLa cells were washed and harvested in cold PBS, followed by lysis in RIPA buffer (150 mM NaCl, 1mM EDTA, 100 mM Tris-HCl, 1% Triton X-100, 1% sodium deoxycholate, 0.1% SDS) containing EDTA-free complete protease inhibitor cocktail (Roche). Following incubation on ice, the lysates were cleared by centrifugation. Following addition of Laemmli buffer, proteins were separated by 10% SDS-polyacrylamide gel electrophoresis (SDS-PAGE) prior to transfer to Immobilon-P PVDF membrane (Millipore).
Standard enhanced chemiluminescence (ECL, GE) Western blotting techniques were used for protein detection. Primary antibody incubations were carried out overnight at 4°C with the exception of anti-actin and FLAG-HRP (1hr at room temperature). Secondary antibody incubations were performed for 1hr at room temperature. Tris-buffered saline (TBS) containing 0.1% Tween 20 was used for washes. 5% milk-TBS/T was used for blocking and antibody incubations unless indicated otherwise. Antibodies used were phospho-glycogen synthase (Ser640/641 of muscle/liver isoform) antibody (#3891), 4E-BP2 antibody (#2845) and 4E-BP1 (#9452) (all Cell Signaling Technology) at 1:1000 in 5% BSA-TBS/T, and glycogen synthase antibody (#3893) at 1:1000, anti-S6 antibody (#2217) at 1:2000, and anti L-13a antibody (#2765) at 1:1000 (all Cell Signaling Technology), anti-actin antibody (#A2066, Sigma), and HRP-conjugated donkey anti-rabbit (#sc-2313, Santa Cruz Biotechnology). For the detection of the FLAG-epitope tag an antibody directly conjugated to HRP (A8592, Sigma) was used at 1:10,000 for 1h at RT. For the quantitation of Western blots, membranes were incubated for 1h at RT with AP-conjugated anti-rabbit or anti-mouse antibodies (Zymogen) at a dilution of 1:20000. Membranes were incubated with ECF™ reagent (GE Healthcare), scanned using a STORM 860 fluorescent scanner, and intensities were quantified using ImageQuant (Molecular Dynamics).
Sucrose gradient analysis
Cells were incubated with fresh medium 3 hrs prior to harvest. Cells were then treated with 100 μg/ml cycloheximide for 3 min at 37°C followed by two washes on ice with cold PBS containing 100 μg/ml cycloheximide. Lysates were prepared, and gradient separation and fractionation were performed as previously described 28.
EDTA-gradients
Cells were lysed in buffer containing 300 mM NaCl, 15 mM Tris-HCl, pH 7.5, 15 mM EDTA, 100 μg/ml cycloheximide, 1mg/ml heparin, 1% Triton-X100. Lysates were cleared by centrifugation and cleared lysates were layered onto 10 to 50% sucrose (300 mM NaCl; 15 mM Tris-HCl, pH 7.5; 15 mM EDTA, 100 μg/ml cycloheximide; 1mg/ml heparin) with a 60% sucrose cushion. Gradients were centrifuged at 35,000 rpm at 4°C in an SW41 rotor for 2 hrs 45 min and then fractionated with an Isco Retriever II/UA-6 detector system.
Puromycin gradients
Cells were lysed in buffer containing: 500 mM KCl; 15 mM Tris-HCl, pH 7.5; 2 mM MgCl2; 2 mM puromycin; 1mg/ml heparin; 1% Triton-X100. Following incubation on ice for 15 min, subunits were separated at 37°C for 10 min. Following centrifugation, cleared lysates were layered onto 10 to 50% sucrose (500 mM KCl; 15 mM Tris-HCl, pH 7.5; 2 mM MgCl2; 1mg/ml heparin) with a 60% sucrose cushion. Gradients were centrifuged at 35,000 rpm at 4°C in an SW41 rotor for 2 hrs 45 min. As a control, cells were lysed and separated in gradients containing: 500 mM KCl; 15 mM Tris-HCl, pH 7.5; 15 mM MgCl2; 100 μg/ml cycloheximide; 1mg/ml heparin. The lysis buffer also contained 1% Triton-X100.
Polysome mRNA preparation and Microarray analysis
Cells were treated with 100 μg/ml cycloheximide and lysates were prepared as described above. The cleared lysates were layered onto 10 to 50% sucrose gradients (300 mM NaCl; 15 mM Tris-HCl, pH 7.5; 15 mM MgCl2; and 100 μg/ml cycloheximide) with a 60% sucrose cushion. Gradients were centrifuged as mentioned above, and fractionated with a Teledyne Isco Foxy R1 Retriever/UA-6 detector system. The gradient fractions were sequentially treated overnight at 4°C and then for 30 – 60 min at 37°C with 0.5 mg/ml proteinase K (New England Biolabs) in the presence of 10 mM EDTA and 1% SDS. RNAs were extracted with an equal volume of phenol-chloroform-isoamylalcohol (25:24:1, Invitrogen). Aqueous phases were re-extracted with chloroform and precipitated with 3 M sodium acetate, 1 μl 20 mg/ml glycogen (Roche), and 100% Ethanol at −20°C overnight or on dry ice until frozen. RNA was pelleted at 14000 rpm for 15 min at 4°C. RNA pellets were washed with 75% ethanol, resuspended in water and precipitated with 0.5 volumes of a 7 M lithium chloride solution (Applied Biosystems) for at least 2 hrs at −20°C. RNA was pelleted and washed with 75 % ethanol and resuspended in water, as above, and polyA-selected using oligotex resin (Qiagen) following the manufacturer’s protocol. Following elution, the RNA was extracted with phenol-chloroform-isoamylalcohol (25:24:1, Invitrogen) and chloroform, and precipitated with 3 M sodium acetate, 1 μl pellet paint (Novagen), and 100% ethanol on dry ice. RNA was pelleted and washed as above and RNA amplification and microarrays were performed in triplicate by Phalanx Biotech (Palo Alto, CA) using OneArray oligonucleotide arrays.
Northern blot analysis
RNA was prepared as described above for the polysome mRNA preparation, but lysis buffer and gradients contained 1mg/ml heparin. Following oligotex selection and RNA precipitation, RNA pellets were resuspended in loading buffer containing 50% formamide, 6.7% formaldehyde, 1% MOPS-EDTA-sodium acetate (MESA) buffer. RNA was denatured at 65°C for 10 min, and separated in a 6.7% formaldehyde-1.25% agarose gel, 1x MESA buffer (Sigma). The RNA was transferred by capillary transfer in 20x SSC buffer and UV cross-linked to a Zeta probe membrane (Bio-Rad). To generate hybridization reagents, cDNAs were synthesized using gene specific reverse primers (Table S1). Fragments between 100 and 500 nucleotides were amplified using the primers listed in Table S1. PCR products were cloned into TOPO pCR2.1 vector and sequenced. Following EcoRI digestion and gel purification of DNA fragments, radioactive probes were prepared using the RadPrime DNA labeling kit (Invitrogen) in the presence of (α-32P) dATP. Labeled DNA was hybridized to the blot in Ultrahyb hybridization solution (Applied Biosystems). The signals were examined using a STORM 860 phosphor-scanner and intensities were quantitated using Image Quant (Molecular Dynamics).
Supplementary Material
Acknowledgments
We thank Karla Kirkegaard for many valuable discussions and critical input on the manuscript. This study was supported from the National Institutes of Health (GM073732).
Footnotes
Publisher's Disclaimer: This is a PDF file of an unedited manuscript that has been accepted for publication. As a service to our customers we are providing this early version of the manuscript. The manuscript will undergo copyediting, typesetting, and review of the resulting proof before it is published in its final citable form. Please note that during the production process errors may be discovered which could affect the content, and all legal disclaimers that apply to the journal pertain.
References
- 1.Kuter DJ, Rodgers A. The protein composition of HeLa ribosomal subunits and nucleolar precursor particles. Exp Cell Res. 1976;102:205–12. doi: 10.1016/0014-4827(76)90316-5. [DOI] [PubMed] [Google Scholar]
- 2.McConkey EH. Composition of mammalian ribosomal subunits: a reevaluation. Proc Natl Acad Sci U S A. 1974;71:1379–83. doi: 10.1073/pnas.71.4.1379. [DOI] [PMC free article] [PubMed] [Google Scholar]
- 3.McConkey EH, Hauber EJ. Evidence for heterogeneity of ribosomes within the HeLa cell. J Biol Chem. 1975;250:1311–8. [PubMed] [Google Scholar]
- 4.Mauro VP, Edelman GM. The ribosome filter hypothesis. Proc Natl Acad Sci U S A. 2002;99:12031–6. doi: 10.1073/pnas.192442499. [DOI] [PMC free article] [PubMed] [Google Scholar]
- 5.Mauro VP, Edelman GM. The ribosome filter redux. Cell Cycle. 2007;6:2246–51. doi: 10.4161/cc.6.18.4739. [DOI] [PMC free article] [PubMed] [Google Scholar]
- 6.Komili S, Farny NG, Roth FP, Silver PA. Functional specificity among ribosomal proteins regulates gene expression. Cell. 2007;131:557–71. doi: 10.1016/j.cell.2007.08.037. [DOI] [PMC free article] [PubMed] [Google Scholar]
- 7.Demianova M, Formosa TG, Ellis SR. Yeast proteins related to the p40/laminin receptor precursor are essential components of the 40 S ribosomal subunit. J Biol Chem. 1996;271:11383–91. doi: 10.1074/jbc.271.19.11383. [DOI] [PubMed] [Google Scholar]
- 8.Ford CL, Randal-Whitis L, Ellis SR. Yeast proteins related to the p40/laminin receptor precursor are required for 20S ribosomal RNA processing and the maturation of 40S ribosomal subunits. Cancer Res. 1999;59:704–10. [PubMed] [Google Scholar]
- 9.Colon-Ramos DA, Shenvi CL, Weitzel DH, Gan EC, Matts R, Cate J, Kornbluth S. Direct ribosomal binding by a cellular inhibitor of translation. Nat Struct Mol Biol. 2006;13:103–11. doi: 10.1038/nsmb1052. [DOI] [PMC free article] [PubMed] [Google Scholar]
- 10.Coyle SM, Gilbert WV, Doudna JA. Direct link between RACK1 function and localization at the ribosome in vivo. Mol Cell Biol. 2009;29:1626–34. doi: 10.1128/MCB.01718-08. [DOI] [PMC free article] [PubMed] [Google Scholar]
- 11.Roach PJ. Liver glycogen synthase. In: PD B, EG K, editors. The Enzymes. 17A. Academic Press; Orlando, FL: 1986. [Google Scholar]
- 12.Roach PJ. Glycogen and its metabolism. Curr Mol Med. 2002;2:101–20. doi: 10.2174/1566524024605761. [DOI] [PubMed] [Google Scholar]
- 13.Lehto M, Stoffel M, Groop L, Espinosa R, 3rd, Le Beau MM, Bell GI. Assignment of the gene encoding glycogen synthase (GYS) to human chromosome 19, band q13.3. Genomics. 1993;15:460–1. doi: 10.1006/geno.1993.1092. [DOI] [PubMed] [Google Scholar]
- 14.Nuttall FQ, Gannon MC, Kubic VL, Hoyt KJ. The human liver Glycogen synthase isozyme gene is located on the short arm of chromosome 12. Genomics. 1994;19:404–5. doi: 10.1006/geno.1994.1086. [DOI] [PubMed] [Google Scholar]
- 15.Westphal SA, Nuttall FQ. Comparative characterization of human and rat liver glycogen synthase. Arch Biochem Biophys. 1992;292:479–86. doi: 10.1016/0003-9861(92)90019-s. [DOI] [PubMed] [Google Scholar]
- 16.Pederson BA, Chen H, Schroeder JM, Shou W, DePaoli-Roach AA, Roach PJ. Abnormal cardiac development in the absence of heart glycogen. Mol Cell Biol. 2004;24:7179–87. doi: 10.1128/MCB.24.16.7179-7187.2004. [DOI] [PMC free article] [PubMed] [Google Scholar]
- 17.Kollberg G, Tulinius M, Gilljam T, Ostman-Smith I, Forsander G, Jotorp P, Oldfors A, Holme E. Cardiomyopathy and exercise intolerance in muscle glycogen storage disease 0. N Engl J Med. 2007;357:1507–14. doi: 10.1056/NEJMoa066691. [DOI] [PubMed] [Google Scholar]
- 18.Cameron JM, Levandovskiy V, MacKay N, Utgikar R, Ackerley C, Chiasson D, Halliday W, Raiman J, Robinson BH. Identification of a novel mutation in GYS1 (muscle-specific glycogen synthase) resulting in sudden cardiac death, that is diagnosable from skin fibroblasts. Mol Genet Metab. 2009;98:378–82. doi: 10.1016/j.ymgme.2009.07.012. [DOI] [PubMed] [Google Scholar]
- 19.Blobel G, Sabatini D. Dissociation of mammalian polyribosomes into subunits by puromycin. Proc Natl Acad Sci U S A. 1971;68:390–4. doi: 10.1073/pnas.68.2.390. [DOI] [PMC free article] [PubMed] [Google Scholar]
- 20.Sonenberg N, Hinnebusch AG. Regulation of translation initiation in eukaryotes: mechanisms and biological targets. Cell. 2009;136:731–45. doi: 10.1016/j.cell.2009.01.042. [DOI] [PMC free article] [PubMed] [Google Scholar]
- 21.Song Y, Jiang Y, Ying W, Gong Y, Yan Y, Yang D, Ma J, Xue X, Zhong F, Wu S, Hao Y, Sun A, Li T, Sun W, Wei H, Zhu Y, Qian X, He F. Quantitative proteomic survey of endoplasmic reticulum in mouse liver. J Proteome Res. 2010;9:1195–202. doi: 10.1021/pr900146t. [DOI] [PubMed] [Google Scholar]
- 22.Anderson P, Kedersha N. Stress granules: the Tao of RNA triage. Trends Biochem Sci. 2008;33:141–50. doi: 10.1016/j.tibs.2007.12.003. [DOI] [PubMed] [Google Scholar]
- 23.Skurat AV, Dietrich AD, Roach PJ. Glycogen synthase sensitivity to insulin and glucose-6-phosphate is mediated by both NH2- and COOH-terminal phosphorylation sites. Diabetes. 2000;49:1096–100. doi: 10.2337/diabetes.49.7.1096. [DOI] [PubMed] [Google Scholar]
- 24.Le Bacquer O, Petroulakis E, Paglialunga S, Poulin F, Richard D, Cianflone K, Sonenberg N. Elevated sensitivity to diet-induced obesity and insulin resistance in mice lacking 4E-BP1 and 4E-BP2. J Clin Invest. 2007;117:387–96. doi: 10.1172/JCI29528. [DOI] [PMC free article] [PubMed] [Google Scholar]
- 25.Washburn MP, Wolters D, Yates JR., 3rd Large-scale analysis of the yeast proteome by multidimensional protein identification technology. Nat Biotechnol. 2001;19:242–7. doi: 10.1038/85686. [DOI] [PubMed] [Google Scholar]
- 26.Lee SW, Berger SJ, Martinovic S, Pasa-Tolic L, Anderson GA, Shen Y, Zhao R, Smith RD. Direct mass spectrometric analysis of intact proteins of the yeast large ribosomal subunit using capillary LC/FTICR. Proc Natl Acad Sci U S A. 2002;99:5942–7. doi: 10.1073/pnas.082119899. [DOI] [PMC free article] [PubMed] [Google Scholar]
- 27.Louie DF, Resing KA, Lewis TS, Ahn NG. Mass spectrometric analysis of 40 S ribosomal proteins from Rat-1 fibroblasts. J Biol Chem. 1996;271:28189–98. doi: 10.1074/jbc.271.45.28189. [DOI] [PubMed] [Google Scholar]
- 28.Wehner KA, Schutz S, Sarnow P. OGFOD1, a novel modulator of eukaryotic translation initiation factor 2alpha phosphorylation and the cellular response to stress. Mol Cell Biol. 2010;30:2006–16. doi: 10.1128/MCB.01350-09. [DOI] [PMC free article] [PubMed] [Google Scholar]
Associated Data
This section collects any data citations, data availability statements, or supplementary materials included in this article.