Abstract
The semidwarf phenotype has been extensively selected during modern crop breeding as an agronomically important trait. Introduction of the semidwarf gene, semi-dwarf1 (sd1), which encodes a gibberellin biosynthesis enzyme, made significant contributions to the “green revolution” in rice (Oryza sativa L.). Here we report that SD1 was involved not only in modern breeding including the green revolution, but also in early steps of rice domestication. We identified two SNPs in O. sativa subspecies (ssp.) japonica SD1 as functional nucleotide polymorphisms (FNPs) responsible for shorter culm length and low gibberellin biosynthetic activity. Genetic diversity analysis among O. sativa ssp. japonica and indica, along with their wild ancestor O. rufipogon Griff, revealed that these FNPs clearly differentiate the japonica landrace and O. rufipogon. We also found a dramatic reduction in nucleotide diversity around SD1 only in the japonica landrace, not in the indica landrace or O. rufipogon. These findings indicate that SD1 has been subjected to artificial selection in rice evolution and that the FNPs participated in japonica domestication, suggesting that ancient humans already used the green revolution gene.
Plant domestication involves the genetic modification of wild species to create a new plant to meet human needs (1). During this domestication, ancient humans subjected common agronomic traits to artificial selection, thereby increasing the seed or fruit size, synchronization of growth and flowering, loss of seed dispersal, changes in plant architecture, and other characteristics comprising the ‘‘domestication syndrome’’ (2). These traits have contributed to more efficient cultivation, higher yields, and more valuable products for human use. Consequently, crop species have undergone extensive selection for these agronomically important traits, and genes impacted by artificial selection can be essential genetic factors in the domestication process (3).
Asian rice, Oryza sativa, was domesticated from its wild ancestor, O. rufipogon, ∼10,000 y ago (4–6). Recently, genes that control the domestication syndrome have been isolated in rice (7–9). In fact, several of these genes have been subjected to artificial selection during domestication and modern breeding (10–13). Although the genes controlling plant architecture are agriculturally important, little is known about their respective alterations during rice domestication (8, 9). In this study, we focused on Semi-dwarf1 (SD1), a null allele of which is known as a “green revolution” gene that has been used extensively in rice modern breeding over the last 50 y (14–17). We found that SD1 was also involved in the rice domestication process by controlling culm length (CL) in ancient japonica landraces. Ancient humans had selected mutations in the green revolution gene long before the green revolution of the 20th century.
Results
Quantitative Trait Locus Analysis for CL and Positional Cloning of qCL1a.
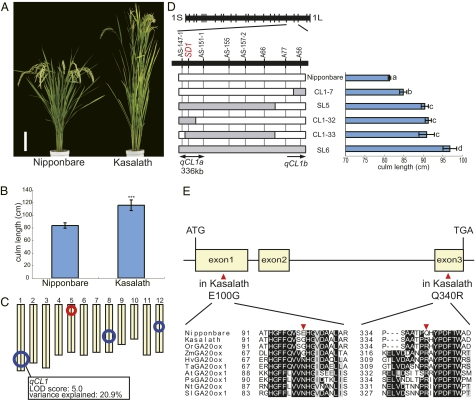
To identify genes controlling CL in rice domestication, we conducted the quantitative trait locus (QTL) analysis for CL in a set of backcross inbred lines (BILs) derived from a cross between two O. sativa ssp., the japonica variety Nipponbare and the indica variety Kasalath (18). Because japonica and indica have distinctly different domestication histories (4–6), we predicted the elucidation of two different domestication processes by comparing these subspecies. The mean CL of Kasalath was significantly longer than that of Nipponbare (116.0 ± 8.4 cm vs. 83.7 ± 4.4 cm; Fig. 1 A and B). In the BILs, CL ranged continuously from 56.9 to 118.8 cm, and transgressive segregants were observed beyond the parental varieties (Fig. S1). These segregants indicated that this trait was controlled by multiple QTLs. We detected four QTLs, and focused further studies on a QTL designated qCL1 (QTL for CL on chromosome 1), which explained 20.9% of the total phenotypic variation in the population (Fig. 1C and Table S1). The CL of lines introgressed with the Kasalath qCL1 region in the Nipponbare background was significantly longer than that of Nipponbare (Fig. 1D and Fig. S2), confirming that the introgressed segment included the QTL. High-resolution mapping using ∼5,000 plants segregating at the qCL1 locus demonstrated that qCL1 consisted of at least two loci, qCL1a and qCL1b. Because the genetic effect of qCL1a was larger than that of qCL1b (Fig. 1D), we chose qCL1a as a target for positional cloning. As a result of positional cloning, qCL1a was delimited within a 336-kb region between markers AS-147-1 and AS-151-1 (Fig. 1D). The Rice Annotation Project Database (http://rapdb.dna.affrc.go.jp/) indicated that this region contained at least 40 genes. Of these, we focused on GA20ox-2, SD1, which encodes GA20 oxidase, an enzyme involved in gibberellin (GA) biosynthesis. Previously, several mutations that resulted in a semidwarf phenotype were identified in SD1, a trait that triggered the green revolution in rice (14–17). Comparison of the SD1 sequence revealed two nonsynonymous SNPs at residue 100 in the first exon [glutamic acid (E) and glycine residues (G)] and at residue 340 in the third exon [glutamine (Q) and arginine (R)] in Nipponbare and Kasalath, respectively (Fig. 1E).
Fig. 1.
QTL analysis for CL and isolation of qCL1a. (A and B) Gross morphology (A) and CL (B) of Nipponbare and Kasalath at the mature stage. (Scale bar in A: 20 cm.) Asterisks in B indicate a significant difference (P < 0.001) according to the t test. Error bars represent the SD from the mean (n = 6). (C) QTL analysis for CL in a BIL population. The circles indicate the positions of QTLs, and the circle sizes indicate the relative contribution of each QTL. The red and blue circles indicate QTLs that Nipponbare and Kasalath alleles contribute to the elongation of CL, respectively. qCL1 is marked on chromosome 1. (D) High-resolution mapping of qCL1. (Left) Graphical genotypes of four selected recombinant homozygous lines. The horizontal lines represent chromosome 1, and a physical map is shown for the qCL1 region of chromosome 1. The vertical bars represent the molecular markers. The white and gray bars indicate homozygous alleles of Nipponbare and Kasalath, respectively. (Right) CL for each recombinant homozygous line. Letters (a–d) denote statistically significant differences (P < 0.05) according to Tukey's test. Error bars indicate the SD from the mean (n = 5). (E) Comparison of SD1 amino acid sequences between Nipponbare and Kasalath. The yellow squares and horizontal lines denote the exons and introns of SD1, respectively. The amino acid sequences of GA20ox proteins from Nipponbare, Kasalath, O. rufipogon, maize, barley, wheat, Arabidopsis, pea, tobacco, and tomato were aligned using ClustalW, followed by manual alignment. The red triangles indicate amino acid substitutions between Nipponbare and Kasalath.
Comparison of SD1 Alleles from Nipponbare and Kasalath.
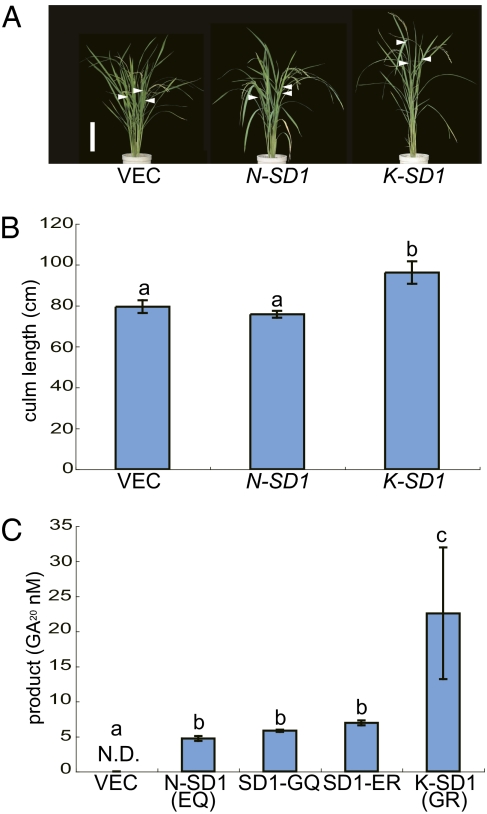
To verify that SD1 corresponds to qCL1a, we produced transgenic plants containing the entire SD1 alleles from Nipponbare (N-SD1) and Kasalath (K-SD1) in the Nipponbare background. K-SD1 showed significantly longer CL than N-SD1 and the empty vector control (Fig. 2 A and B), demonstrating that SD1 corresponds to qCL1a. To clarify the effect of the two amino acid differences, we compared the catalytic activity of N-SD1 (SD1-EQ), K-SD1 (SD1-GR), and intermediate types (SD1-GQ and SD1-ER) produced in Escherichia coli. SD1 catalyzes the pathway from GA53 to GA20, the main GA synthesis pathway in rice leaves and stems (19). Although all SD1 proteins catalyzed the conversion of GA53 to GA20, SD1-GR demonstrated significantly higher activity than the other three SD1 types (Fig. 2C). This indicates that two SNPs in SD1-EQ are functional nucleotide polymorphisms (FNPs) that are key natural variations in this gene.
Fig. 2.
Comparison of the SD1 alleles from Nipponbare and Kasalath. (A) Phenotype of transgenic plants containing the additional SD1 allele: from left to right, transgenic plants containing empty vector (VEC), the Nipponbare allele (N-SD1), and the Kasalath allele (K-SD1). The white arrowheads indicate the position of the panicle node. (Scale bar in A: 20 cm.) (B) CL in transgenic plants containing additional SD1. The letters a and b denote statistically significant differences (P < 0.05) according to Tukey's test. Error bars represent the SD from the mean of the longest culms (n = 15). (C) GA biosynthetic activity of SD1. N.D., not detected. The letters a–c denote statistically significant differences (P < 0.05) according to Tukey's test. Error bars represent the SD from the mean (n = 3).
Genetic Diversity Analysis in the SD1 Region.
We analyzed the prevalence of two FNPs in SD1 in a set of 72 diverse rice accessions. To exclude the effects of modern breeding, we chose landraces that were considered primitive cultivars after domestication and that represented maximum genetic diversity within O. sativa (20) for the subsequent analyses. In our collection, all of the japonica landraces (including both tropical and temperate japonica) carried SD1-EQ, whereas most of the indica landraces carried SD1-GR (Tables S2 and S3), indicating that these FNPs differentiate japonica and indica. All 42 accessions of O. rufipogon from different origins carried SD1-GR (Tables S2 and S3), strongly suggesting that the two FNPs in SD1-EQ had been specifically selected during the japonica domestication process.
To determine whether SD1-EQ had undergone artificial selection during japonica domestication, we analyzed the genetic variation in a ∼4.0-kb region encompassing the entire SD1 sequence in O. sativa and O. rufipogon. Our representative samples included 16 landraces of japonica, 15 landraces of indica, and 16 accessions of O. rufipogon (Table S3). An apparent reduction in genetic variation was observed at the SD1 locus in japonica landraces, but not in indica landraces or in O. rufipogon. The SD1 nucleotide diversity in the japonica landraces (π =0.00013) lost 98% of the diversity in the O. rufipogon sample (π =0.00568), whereas the indica landraces (π =0.00424) showed only a 25% reduction (Table S4). The nucleotide diversity in japonica SD1 was 10-fold lower than that of 111 randomly chosen gene fragments (π =0.00111) (21), suggesting that the low nucleotide diversity observed in japonica SD1 cannot be explained by a population bottleneck alone, because that would have caused a reduction in nucleotide diversity throughout the genome.
Detection of Selective Sweep and Coalescent Simulation.
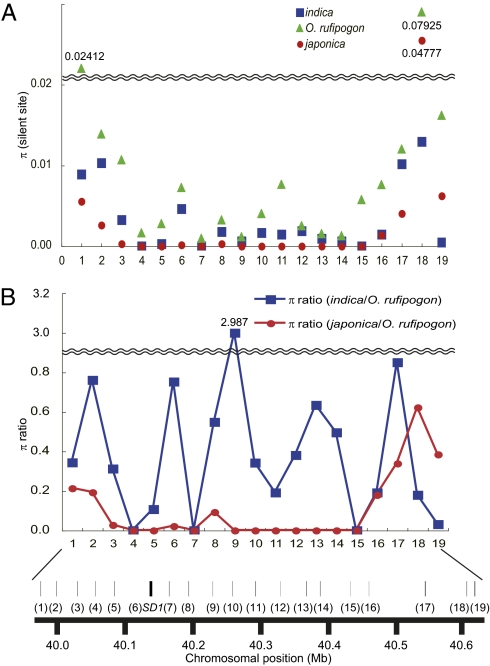
If SD1-EQ had been selected during the process of japonica domestication, then a lower level of genetic diversity in the flanking region known as selective sweep (3, 10, 22, 23) should be observed. Thus, we compared the nucleotide diversity in 18 genes spanning a 664-kb region surrounding the SD1 locus in japonica, indica, and O. rufipogon. The diversity of japonica in this region was apparently lower than that of indica and O. rufipogon across a ∼404-kb region from genes 3–15 (Fig. 3). Coalescent simulations (24) demonstrated that the japonica genetic diversity seen in this region (π = 0.0000536) was significantly lower (P < 0.01) than that of O. rufipogon (π = 0.00524), supporting our hypothesis of selection for SD1-EQ during japonica domestication. We found no evidence supporting selection for indica SD1, suggesting that this selection event could be specific to japonica domestication (SI Methods and Fig. S3).
Fig. 3.
Genetic diversity analysis around the SD1 region. (A) Values of π for the silent site of japonica (red circle), indica (blue square), and O. rufipogon (green triangle) across the SD1 genomic region of chromosome 1. (B) Nucleotide variation in japonica or indica relative to O. rufipogon. The blue and red lines indicate the ratios of all site nucleotide diversities in indica and japonica relative to O. rufipogon, respectively. In both A and B, ∼180- to 880-bp portions of 18 flanking genes were sequenced, along with the entire SD1 gene. The approximate genomic locations of the genes are indicated by solid bars, with the following gene identities: 1, hypothetical protein; 2, hypothetical protein; 3, leucine-rich repeat, cysteine-containing containing protein; 4, protein of unknown function, DUF803 family protein; 5, hypothetical protein; 6, SD1; 7, Armadillo-like helical domain containing protein; 8, conserved hypothetical protein; 9, conserved hypothetical protein; 10, similar to AGAMOUS homolog; 11, similar to EMB1879 (EMBRYO DEFECTIVE 1879); 12, hypothetical protein; 13, similar to NAC-domain containing protein 18 (ANAC018) (NO APICAL MERISTEM protein; AtNAM); 14, RIO-like kinase domain-containing protein; 15, similar to LOB domain protein 6 (ASYMMETRIC LEAVES2); 16, hypothetical conserved gene; 17, hypothetical protein; 18, hypothetical conserved gene, and 19, metallophosphoesterase domain-containing protein.
Origin of SD1-EQ.
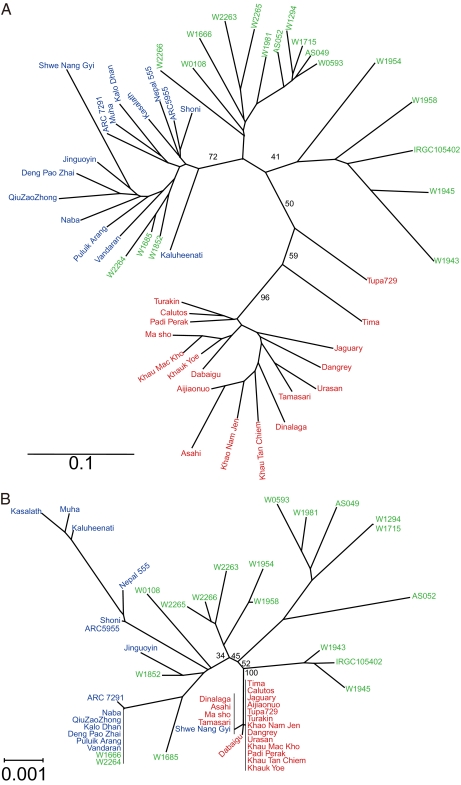
To clarify the origin of SD1-EQ, we performed phylogenetic analyses based on genome-wide transposon insertion patterns and entire SD1 genomic sequences. In O. rufipogon, five accessions (W1954, W1958, IRGC105402, W1945, and W1943) were closely related to japonica landraces on a genome-wide level (Fig. 4A). Three of these accessions (IRGC105402, W1945, and W1943) had SD1 nucleotide sequences similar to those of japonica landraces even though these accessions had SD1-GR (Fig. 4B and Table S3). This finding suggests that SD1-EQ was derived from an ancestor related to the japonica-like O. rufipogon (Fig. 5). This finding also indicates that FNPs in SD1 clearly differentiate between O. rufipogon and japonica.
Fig. 4.
Phylogenetic trees based on genome-wide transposon insertion patterns (A) and the SD1 genomic sequence (B). Landraces and accessions are indicated by red for japonica, blue for indica, and green for O. rufipogon. Bootstrap values (%) were obtained by 1,000 bootstrap replicates.
Fig. 5.
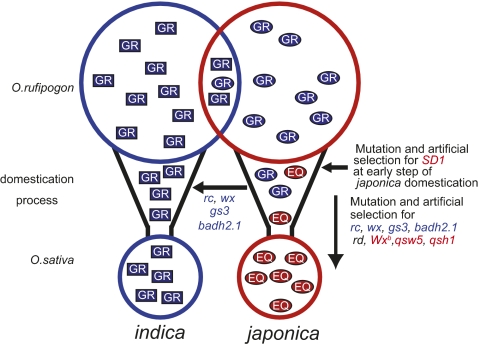
Model of the domestication process in rice. The blue and red circles indicate two genetically distinct groups, indica and japonica, and their corresponding ancestor, O. rufipogon. “GR” enclosed by a blue rectangle or ellipse indicates a GR-type SD1 allele. “EQ” enclosed by red ellipse indicate an EQ-type SD1 allele. Rectangles and ellipses indicate indica and japonica-like alleles in relation to sequences outside of the FNPs of SD1, respectively. Genes indicated by blue and red letters are genes introgressed from japonica into indica and genes isolated into the japonica population, respectively.
Discussion
In this study, we have identified SD1 as a domestication gene controlling CL and have demonstrated that FNPs in SD1 were subjected to artificial selection during japonica domestication. Because SD1 is a gene associated with rice plant architecture, this agronomic trait must be an essential target of artificial selection including both rice domestication and modern breeding. Our data suppose that ancient humans already used the green revolution gene; they took an interest in the height of rice plants as well as in seed shattering and size, and ultimately selected shorter plants with the SD1-EQ allele. On the other hand, in the rice green revolution during the 20th century, breeders favored the null allele of SD1 from the indica population (14–17), indicating that distinct SD1 alleles played an active role in the short plant height during rice evolution. Note that a clear reduction in genetic variation observed around SD1 indicates selection for this region. These results do not completely exclude the possibility that selection acted on other genes in the region (i.e., the region between genes 3 and 15 in Fig. 3). However, no obvious phenotypic differences were observed between near-isogenic lines containing the SD1-GR region and Nipponbare, except for CL. In addition, there are no reports or annotations for agronomically important traits in this region except SD1. Thus, SD1 would be the target for artificial selection.
Natural variation revealed the extant accessions with SD1-EQ (japonica) and SD1-GR (O. rufipogon and general indica). Mysteriously, no accession was found to have the intermediate alleles SD1-GQ and SD1-ER in either O. sativa or O. rufipogon. Two possible processes led to the eventual generation of SD1-EQ: mutations occurring twice and resulting in conversion of SD1-GR to SD1-EQ, or a mutation in SD1-GR resulting in SD1-GQ and SD1-ER, which subsequently underwent a recombination event. These intermediate alleles might have disappeared because of reasons such as genetic drift. Because there was little difference in enzymatic activity between SD1-EQ and the intermediates (Fig. 2C), which probably resulted in shorter CL, ancient humans could not distinguish plants with SD1-EQ and the intermediates. Whether the intermediates were targets for artificial selection before SD1-EQ was generated remains unclear from current data.
We also have demonstrated that FNPs in SD1 clearly differentiate between O. rufipogon and japonica. The SD1-EQ allele was probably fixed during japonica domestication before the speciation of tropical and temperate japonica. Such a distinct differentiation is rare in crops. Most FNPs in genes associated with domestication were not completely fixed between cultivated and wild relatives (7, 11, 13, 25–28), meaning that several cultivars still retain wild-relative alleles in domestication-related genes. These genes may be strongly affected by artificial selection during late stages of domestication; however, exceptions include FNPs in sh4 for seed shattering in rice (29) and tga1 for the loss of cupulate fruitcases in maize (30), which are fixed differences between cultivated and wild relatives. Thus, mutation and selection for these genes are considered critical steps in the domestication of these crops. Collectively, our results indicate that the SD1-EQ allele arose in a japonica ancestor in the early stages of japonica domestication, and that selection for these FNPs was a critical step in japonica domestication (Fig. 5).
Previous studies have suggested that hybridization between subpopulations and subsequent introgressions of domestication-related genes, combined with artificial and natural selection, gave rise to the present rice landraces (4–6, 11, 13, 25–28). In fact, many rice domestication-related genes, including rc, wx, gs3, and badh2.1, were presumably established during japonica domestication and subsequently introgressed into indica (11, 13, 25, 28). In the present study, despite the earlier prevalence of SD1-EQ in japonica landraces, SD1-EQ appeared to be introgressed into a small number of indica landraces (3 out of 52; Tables S2 and S3). These few exceptional landraces carry a defined region of japonica-like DNA flanking SD1 in the indica background, likely the result of natural crossing and subsequent introgression during domestication after the emergence of SD1-EQ in japonica. This clear differentiation of SD1 between japonica and indica might be attributed to the adaptation of SD1 alleles in a specific region. An intriguing alternative possibility is the contribution of a reproductive barrier to prevent introgression of this locus. Relevant to this point, it is important to note that qsh1, a domestication-related gene for reduced seed shattering, originated in japonica and was also not introgressed into indica (7). Both SD1-EQ and qsh1 are located on the long arm of chromosome 1, ∼1.9 Mbp apart, and thus should behave as a linked locus. The existence of a reproductive barrier between japonica and indica has been reported in this region (31), and this barrier might prevent the introgression of these two genes from japonica into indica. It is noteworthy that two contradictory events, hybridization between subpopulations and a potential reproductive barrier, might play important roles in rice domestication.
Methods
Plant Material and Growth Conditions.
Rice BILs, substitution lines, and accessions used for genetic diversity analysis were obtained from the National Institute of Agrobiological Sciences (18, 20). Other varieties used in this study were maintained at Nagoya University. All varieties were grown under natural field conditions in the research field. Seeds of all varieties were immersed in water for 2 d and then sown in a nursery bed. After 1 mo, the seedlings were transplanted to a paddy field.
QTL Analysis.
The CL of 98 BILs from a cross between Nipponbare and Kasalath was evaluated for QTL analysis. The CL was defined as the length from the soil surface to the panicle node. The linkage map was constructed using MAPMAKER/EXP version 3.0 (32). QGene version 3.29 (33) was used to identify QTLs. Four loci were scored, and all had an LOD score >2.5.
Selection of Accessions Used for Genetic Diversity Analysis.
Accessions used for genetic diversity analysis were chosen from a set of 72 landraces and 42 accessions of O. rufipogon to represent the genetic diversity of the entire set based on restriction fragment length polymorphism data for O. sativa (20) and p-SINE1, as well as the LTR retrotransposon insertion pattern for O. rufipogon.*
Sequencing of SD1 and Surrounding Genes.
Accessions were sequenced at SD1 and portions of 18 flanking loci located at 11- to 82-kb intervals upstream and downstream of SD1. All primers were designed from the Nipponbare genomic sequence. For SD1, primers were designed to amplify seven partially overlapping portions of the gene. For flanking loci, primers were designed to amplify ∼880-bp portions of genes with putative or known function. All primer pairs for flanking loci were designed on exons and spanned one or more intron regions (Table S5). All PCR primers were analyzed by BLAST against the Rice Annotation Project Database, to ensure amplification of only the targeted genomic region. Nucleotide sequences were determined by the dideoxynucleotide chain termination method using an automated sequencing system. Sequences were analyzed with GENETYX software.
Genetic Diversity Analysis.
Population genetic analyses were conducted for SD1 and the 18 flanking genes using DnaSP 5.1 (34). Levels of nucleotide diversity per site and silent site were estimated as π for each of the landrace groups of cultivated rice and O. rufipogon.
Phylogenetic Analysis.
Phylogenetic trees were constructed using the neighbor-joining method in PHYLIP version 3.69 (35). To produce the phylogenetic tree based on genome-wide transposon patterns, we used the Cavalli–Sforza chord distance (36) calculated by Microsatellite Analyzer 4.05 (37), followed by the neighbor-joining method.
Supplementary Material
Acknowledgments
We thank M. Ito, E. Koketsu, I. Mido-Aichi, and H. Omiya for technical assistance. We thank the Project of Wild Rice Resources at the National Institute of Genetics (Mishima, Japan) and the Genetic Resource Center at International Rice Research Institute (Manila, Philippines) for providing the Oryza rufipogon accessions. We are also grateful to Dr. K.-I. Nonomura, Dr. D. Fujita, and T. Miyabayashi for providing information on the O. rufipogon accessions. We thank S. Mizuno for maintenance of the paddy field, H. Kato and Y. Morinaka for maintenance of GC-MS, and E. Yamamoto for helpful suggestions. This work was partially supported by grants from the Ministry of Agriculture, Forestry and Fisheries of Japan (Genomics for Agricultural Innovation Grants QTL-5003 to J.W., NVR-0002 to K.E. and M.Y., QTL-4002 to M.A., and IPG0003 to M.M., and Green Technology Project Grant GD-2007 to T.M.) and Grant-in-Aid 22119001 (to M.A.) from the Ministry of Education, Culture, Sports, Science, and Technology, Japan and Japan Science and Technology Agency/Japan International Cooperation Agency, Science and Technology Research Partnership for Sustainable Development.
Footnotes
The authors declare no conflict of interest.
This article is a PNAS Direct Submission.
See Commentary on page 10931.
*Wu J, et al. (2010) Molecular and biological highlights to rice domestication revealed by analyzing the genetic diversity of yield and heading date-related genes. Proceedings Cold Spring Harbor Conference Asian, From Plant Biology to Crop Biotechnology, Suzhou, China, p. 107.
Data deposition: The sequences reported in this paper have been deposited in the DDBJ/EMBL/GenBank database (accession nos. AB633333–AB634249).
This article contains supporting information online at www.pnas.org/lookup/suppl/doi:10.1073/pnas.1019490108/-/DCSupplemental.
References
- 1.Doebley JF, Gaut BS, Smith BD. The molecular genetics of crop domestication. Cell. 2006;127:1309–1321. doi: 10.1016/j.cell.2006.12.006. [DOI] [PubMed] [Google Scholar]
- 2.Harlan J. Crops and Man. 2nd Ed. Madison, WI: American Society of Agronomy; 1992. [Google Scholar]
- 3.Yamasaki M, et al. A large-scale screen for artificial selection in maize identifies candidate agronomic loci for domestication and crop improvement. Plant Cell. 2005;17:2859–2872. doi: 10.1105/tpc.105.037242. [DOI] [PMC free article] [PubMed] [Google Scholar]
- 4.Kovach MJ, Sweeney MT, McCouch SR. New insights into the history of rice domestication. Trends Genet. 2007;23:578–587. doi: 10.1016/j.tig.2007.08.012. [DOI] [PubMed] [Google Scholar]
- 5.Sang T, Ge S. Genetics and phylogenetics of rice domestication. Curr Opin Genet Dev. 2007;17:533–538. doi: 10.1016/j.gde.2007.09.005. [DOI] [PubMed] [Google Scholar]
- 6.Sweeney M, McCouch S. The complex history of the domestication of rice. Ann Bot (Lond) 2007;100:951–957. doi: 10.1093/aob/mcm128. [DOI] [PMC free article] [PubMed] [Google Scholar]
- 7.Konishi S, et al. An SNP caused loss of seed shattering during rice domestication. Science. 2006;312:1392–1396. doi: 10.1126/science.1126410. [DOI] [PubMed] [Google Scholar]
- 8.Tan LB, et al. Control of a key transition from prostrate to erect growth in rice domestication. Nat Genet. 2008;40:1360–1364. doi: 10.1038/ng.197. [DOI] [PubMed] [Google Scholar]
- 9.Jin J, et al. Genetic control of rice plant architecture under domestication. Nat Genet. 2008;40:1365–1369. doi: 10.1038/ng.247. [DOI] [PubMed] [Google Scholar]
- 10.Olsen KM, et al. Selection under domestication: Evidence for a sweep in the rice waxy genomic region. Genetics. 2006;173:975–983. doi: 10.1534/genetics.106.056473. [DOI] [PMC free article] [PubMed] [Google Scholar]
- 11.Sweeney MT, et al. Global dissemination of a single mutation conferring white pericarp in rice. PLoS Genet. 2007;3:e133. doi: 10.1371/journal.pgen.0030133. [DOI] [PMC free article] [PubMed] [Google Scholar]
- 12.Zhang LB, et al. Selection on grain-shattering genes and rates of rice domestication. New Phytol. 2009;184:708–720. doi: 10.1111/j.1469-8137.2009.02984.x. [DOI] [PubMed] [Google Scholar]
- 13.Takano-Kai N, et al. Evolutionary history of GS3, a gene conferring grain length in rice. Genetics. 2009;182:1323–1334. doi: 10.1534/genetics.109.103002. [DOI] [PMC free article] [PubMed] [Google Scholar]
- 14.Asano K, et al. Genetic and molecular analysis of utility of sd1 alleles in rice breeding. Breed Sci. 2007;57:53–58. [Google Scholar]
- 15.Ashikari M, et al. Loss-of-function of a rice gibberellin biosynthetic gene, GA20 oxidase (GA20ox-2), led to the rice “green revolution.”. Breed Sci. 2002;52:143–150. [Google Scholar]
- 16.Sasaki A, et al. Green revolution: A mutant gibberellin-synthesis gene in rice. Nature. 2002;416:701–702. doi: 10.1038/416701a. [DOI] [PubMed] [Google Scholar]
- 17.Spielmeyer W, Ellis MH, Chandler PM. Semidwarf (sd-1), “green revolution” rice, contains a defective gibberellin 20-oxidase gene. Proc Natl Acad Sci USA. 2002;99:9043–9048. doi: 10.1073/pnas.132266399. [DOI] [PMC free article] [PubMed] [Google Scholar]
- 18.Lin SY, Sasaki T, Yano M. Mapping quantitative trait loci controlling seed dormancy and heading date in rice, Oryza sativa L., using backcross inbred lines. Theor Appl Genet. 1998;96:997–1003. [Google Scholar]
- 19.Kobayashi M, et al. Gibberellin biosynthesis: Metabolic evidence for three steps in the early 13-hydroxylation pathway of rice. Phytochemistry. 2000;55:317–321. doi: 10.1016/s0031-9422(00)00265-x. [DOI] [PubMed] [Google Scholar]
- 20.Kojima Y, Ebana K, Fukuoka S, Nagamine T, Kawase M. Development of an RFLP-based rice diversity research set of germplasm. Breed Sci. 2005;55:431–440. [Google Scholar]
- 21.Caicedo AL, et al. Genome-wide patterns of nucleotide polymorphism in domesticated rice. PLoS Genet. 2007;3:1745–1756. doi: 10.1371/journal.pgen.0030163. [DOI] [PMC free article] [PubMed] [Google Scholar]
- 22.Clark RM, Linton E, Messing J, Doebley JF. Pattern of diversity in the genomic region near the maize domestication gene tb1. Proc Natl Acad Sci USA. 2004;101:700–707. doi: 10.1073/pnas.2237049100. [DOI] [PMC free article] [PubMed] [Google Scholar]
- 23.Purugganan MD, Fuller DQ. The nature of selection during plant domestication. Nature. 2009;457:843–848. doi: 10.1038/nature07895. [DOI] [PubMed] [Google Scholar]
- 24.Gao LZ, Innan H. Nonindependent domestication of the two rice subspecies, Oryza sativa ssp. indica and ssp. japonica, demonstrated by multilocus microsatellites. Genetics. 2008;179:965–976. doi: 10.1534/genetics.106.068072. [DOI] [PMC free article] [PubMed] [Google Scholar]
- 25.Yamanaka S, Nakamura I, Watanabe KN, Sato YI. Identification of SNPs in the waxy gene among glutinous rice cultivars and their evolutionary significance during the domestication process of rice. Theor Appl Genet. 2004;108:1200–1204. doi: 10.1007/s00122-003-1564-x. [DOI] [PubMed] [Google Scholar]
- 26.Shomura A, et al. Deletion in a gene associated with grain size increased yields during rice domestication. Nat Genet. 2008;40:1023–1028. doi: 10.1038/ng.169. [DOI] [PubMed] [Google Scholar]
- 27.Konishi S, Ebana K, Izawa T. Inference of the japonica rice domestication process from the distribution of six functional nucleotide polymorphisms of domestication-related genes in various landraces and modern cultivars. Plant Cell Physiol. 2008;49:1283–1293. doi: 10.1093/pcp/pcn118. [DOI] [PubMed] [Google Scholar]
- 28.Kovach MJ, Calingacion MN, Fitzgerald MA, McCouch SR. The origin and evolution of fragrance in rice (Oryza sativa L.) Proc Natl Acad Sci USA. 2009;106:14444–14449. doi: 10.1073/pnas.0904077106. [DOI] [PMC free article] [PubMed] [Google Scholar]
- 29.Lin ZW, et al. Origin of seed shattering in rice (Oryza sativa L.) Planta. 2007;226:11–20. doi: 10.1007/s00425-006-0460-4. [DOI] [PubMed] [Google Scholar]
- 30.Wang H, et al. The origin of the naked grains of maize. Nature. 2005;436:714–719. doi: 10.1038/nature03863. [DOI] [PMC free article] [PubMed] [Google Scholar]
- 31.Harushima Y, Nakagahra M, Yano M, Sasaki T, Kurata N. A genome-wide survey of reproductive barriers in an intraspecific hybrid. Genetics. 2001;159:883–892. doi: 10.1093/genetics/159.2.883. [DOI] [PMC free article] [PubMed] [Google Scholar]
- 32.Lander ES, et al. MAPMAKER: An interactive computer package for constructing primary genetic linkage maps of experimental and natural populations. Genomics. 1987;1:174–181. doi: 10.1016/0888-7543(87)90010-3. [DOI] [PubMed] [Google Scholar]
- 33.Nelson JC. QGENE: Software for marker-based genomic analysis and breeding. Mol Breed. 1997;3:239–245. [Google Scholar]
- 34.Librado P, Rozas J. DnaSP v5: Software for comprehensive analysis of DNA polymorphism data. Bioinformatics. 2009;25:1451–1452. doi: 10.1093/bioinformatics/btp187. [DOI] [PubMed] [Google Scholar]
- 35.Felsenstein J. PHYLIP (Phylogeny Inference Package) version 3.69, University of Washington, Seattle. 2010. Available from: http://evolution.genetics.washington.edu/phylip.html.
- 36.Cavalli-Sforza LL, Edwards AWF. Phylogenetic analysis: Models and estimation procedures. Am J Hum Genet. 1967;19:233–257. [PMC free article] [PubMed] [Google Scholar]
- 37.Dieringer D, Schlötterer C. Microsatellite Analyser (MSA): A platform-independent analysis tool for large microsatellite data sets. Mol Ecol Notes. 2003;3:167–169. [Google Scholar]
Associated Data
This section collects any data citations, data availability statements, or supplementary materials included in this article.


