

Abstract
New regulatory roles continue to emerge for both natural and engineered noncoding RNAs, many of which have specific secondary and tertiary structures essential to their function. Thus there is a growing need to develop technologies that enable rapid characterization of structural features within complex RNA populations. We have developed a high-throughput technique, SHAPE-Seq, that can simultaneously measure quantitative, single nucleotide-resolution secondary and tertiary structural information for hundreds of RNA molecules of arbitrary sequence. SHAPE-Seq combines selective 2′-hydroxyl acylation analyzed by primer extension (SHAPE) chemistry with multiplexed paired-end deep sequencing of primer extension products. This generates millions of sequencing reads, which are then analyzed using a fully automated data analysis pipeline, based on a rigorous maximum likelihood model of the SHAPE-Seq experiment. We demonstrate the ability of SHAPE-Seq to accurately infer secondary and tertiary structural information, detect subtle conformational changes due to single nucleotide point mutations, and simultaneously measure the structures of a complex pool of different RNA molecules. SHAPE-Seq thus represents a powerful step toward making the study of RNA secondary and tertiary structures high throughput and accessible to a wide array of scientific pursuits, from fundamental biological investigations to engineering RNA for synthetic biological systems.
Keywords: chemical probing, RNA sequencing, RNA folding, genomics
Over the past several years, there has been an explosion in the discovery of noncoding, but functional RNAs that play central roles in maintaining, regulating, and defending the genome (1). At the same time, RNA-based mechanisms have emerged as powerful tools for engineering synthetic biological systems (2). Many of these natural and synthetic RNAs have specific secondary and tertiary structures essential to their function, and there is a growing need to develop technologies that enable rapid characterization of structural features within complex RNA populations. Such a high-throughput structure characterization assay would allow rapid assessment of the impact of sequence on structure and function and enable RNA engineers to design libraries of RNA molecules with desired structural properties.
Two techniques for high-throughput RNA structure characterization have recently been reported: parallel analysis of RNA structures (PARS) (3) and fragmentation sequencing (Frag-Seq) (4). Both techniques couple classic in vitro nuclease probing techniques that are traditionally performed one RNA at a time, with deep sequencing of RNA fragments to simultaneously probe a complex mixture of RNAs sampled from transcriptomes. Although important first steps, these techniques provide only low-resolution secondary structure information due to the limitations inherent in nuclease probing (5).
We have developed a high-throughput technique, SHAPE-Seq, that can simultaneously measure quantitative, single nucleotide-resolution secondary and tertiary structure information for hundreds of RNA molecules of arbitrary sequence. SHAPE-Seq combines selective 2′-hydroxyl acylation analyzed by primer extension (SHAPE) chemistry (6) with a multiplexed hierarchical bar coding and deep sequencing strategy, enabling parallel in vitro structure probing experiments in one test tube (Fig. 1). We have also developed a maximum-likelihood (ML) estimation strategy for inferring nucleotide reactivities that rigorously incorporates information from co-sequenced control experiments (7). Combined with bioinformatics software to process, bin, and map raw sequence reads, this creates a fully automated data analysis pipeline. Furthermore, the SHAPE reactivities that are the output of this pipeline are well established and can be immediately used in existing RNA folding algorithms to determine the structures for each RNA molecule (8, 9).
Fig. 1.

Overview of SHAPE-Seq. (A) Experimental pipeline. A DNA bar code is added to the 3′ end of template molecules, enabling SHAPE chemistry and sequencing library generation to be done on a mixture of bar-coded RNAs. (B) Bioinformatics and analysis pipeline. The automated pipeline separates reads by handle pools and bar code and maps the reads onto RNA sequences. Raw read counts at each nucleotide position in the (+) and (-) channel are fed into a ML estimation calculation to determine the reactivities at each nucleotide, Θ. Θ can be scaled and used in programs such as RNAStructure (9) to infer secondary structure from SHAPE-Seq data.
In this work, we show that SHAPE-Seq is able to accurately infer both secondary and tertiary structural information for the model RNA fold of the Bacillus subtilis RNase P specificity domain. Furthermore, we show that SHAPE-Seq can infer this information from hundreds of bar-coded copies of the RNase P RNA in a single sample. Finally we use this technique to simultaneously infer local structural changes in RNase P due to single point mutations and to determine the structures of two variants of the Staphylococcus aureus plasmid pT181 transcriptional attenuator, all within the same mixture.
Results
The SHAPE-Seq Pipeline.
The goal of SHAPE-Seq is to accurately infer nucleotide-resolution structural information through simultaneous SHAPE probing of a mixture of RNA species (Fig. 1). To explicitly distinguish the species, each RNA in the experiment is bar-coded with a unique nucleotide sequence near the 3′ end of the RNA (Fig. S1). These RNAs are then mixed and folded under the desired in vitro conditions, which can include any of the wide array of buffers (10), ligands (11), temperatures (12), and other variables already established for conventional SHAPE. Once folded, the pool is split into two samples, one of which (+) is treated with a SHAPE reagent [here 1M7 (6)], and the other (-) is treated with a control solvent. These pools then undergo conversion to cDNA through a reverse transcription (RT) process that is blocked by 1M7 modification (6), generating bar-coded distributions of different length cDNAs that represent locations of 1M7 modification (+), or processes such as transcriptase drop-off that cause bias in reverse transcription (-).
The (+) and (-) pools are kept separate during the RT step so that they can be tagged with an additional bar code attached to the 5′ tail of the RT primer, called a “handle” (Fig. 1A). The handles identify cDNA fragments as coming from the (+) or (-) channels when the cDNA pools are simultaneously sequenced together as a single mixture. Sequencing of the cDNA is performed using paired-end Illumina sequencing (13). To add the required Illumina sequencing adapters to cDNA products, one of the adapters was included in the tail of the RT primers, and the other was added through a single-stranded DNA ligation step after the RNA was removed by NaOH hydrolysis (see Materials and Methods). The single-stranded DNA ligation step is performed at elevated temperatures with a thermostable ligase, and with a blocking group on the 3′ end of the adapter to prevent adapter concatemerization (14). After nine rounds of PCR amplification, the libraries are sequenced on an Illumina Genome Analyzer IIx platform in paired-end mode. Only 50 nucleotides need to be sequenced on each end because the two pieces of information needed—the SHAPE modification position and the RNA identity (bar code)—are on opposite ends of the cDNA molecules. This obviated the need for a size-selection step, which has limited the structural information obtainable using other methods (4).
After sequencing, the reads are binned according to the handle sequence (Fig. 1B). The Illumina platform uses randomness in the first four nucleotide incorporations to calibrate for spectral overlap and cluster identification. Because the handles are the first nucleotides sequenced, we chose sets of handle sequences to represent the (+) and (-) reads, RRRY (R = A,G; Y = C,T) for (+) and YYYR for (-). This guaranteed that at each position of the handle, an equal mixture of A, T, C, and G is sequenced. Reads were first separated by handle, then bar code, and aligned to the appropriate RNA molecule sequence using the Bowtie alignment package (15), creating nucleotide-resolution count distributions in the (+) and (-) channels.
The digital nature of direct cDNA sequencing allows SHAPE-Seq data to be amenable to rigorous and fully automated mathematical analysis. In conventional SHAPE experiments, fluorescently labeled cDNAs are typically quantified by capillary electrophoresis (SHAPE-CE), which requires a series of manual data analysis steps associated with correcting channel mobilities, aligning, and integrating the analog electropherogram intensities into (+) and (-) distributions (16). The (+) and (-) distributions are subtracted to give the final output of the SHAPE experiment: a SHAPE “reactivity” for each nucleotide that represents the propensity for 1M7 adduct formation at that position. Previous work comparing SHAPE reactivities to NMR order parameters has shown that reactivities correlate strongly with local spatial disorder and are thus a measure of structural dynamics (17). In general, high reactivities are interpreted as nucleotides that are on average unstructured and low reactivities are interpreted as nucleotides that are constrained by canonical or noncanonical, secondary or tertiary interactions. Before the subtraction of the two distributions, two corrections are typically applied: The (+) channel intensities are adjusted by an exponential decay factor that corrects for fragment distribution decay resulting from the unidirectional RT process stopping at the first encountered adduct, and the (-) channel is scaled by a constant factor so that unreactive sites have a reactivity of zero when the two channels are subtracted. In addition to being manual, both of these steps require expert knowledge making it in general prohibitive to apply the standard SHAPE data analysis pipeline to hundreds of raw (+) and (-) distributions generated by SHAPE-Seq.
To overcome this barrier, we developed a rigorous, automated mathematical framework that can be applied to find the optimal set of reactivities that are most consistent with the observed (+) and (-) distributions [see Materials and Methods (7)]. The model uses ML estimation to output a set of reactivities, Θ, and the estimated average number of modifications per cite, c.
SHAPE-Seq Accurately Infers the Secondary and Tertiary Structure of a Highly Conserved Catalytic RNA.
As an initial test of the SHAPE-Seq platform, we probed the specificity domain of the highly conserved catalytic RNA, RNase P, from B. subtilis, which has been extensively characterized using conventional SHAPE with capillary electrophoresis (6). Furthermore, as determined by X-ray crystallography, the RNase P fold is highly structured, with well-defined tertiary interactions (18), making it an ideal candidate for an initial test of the method.
Fig. 2 shows an overlay of SHAPE-Seq reactivities on the known structure of RNase P. Over 7.5 million sequencing reads were used to compute Θ values for each nucleotide of the molecule, which were then converted into conventional SHAPE reactivities (see Materials and Methods). Immediately apparent are two regions of highly reactive nucleotides in the loops of helices P8 and P9 as expected because these loops are known to be unpaired. In contrast, the P8 and P9 stems show extremely low reactivities due to extensive base pairing. Over 200,000 fragments were mapped in this region with near perfect cancellation between the (+) and (-) channels, highlighting that even low reactivities are derived from large amounts of information. This holds true across the entire RNase P as seen by comparing raw (+) and (-) counts (Fig. S2).
Fig. 2.

SHAPE-Seq mapping of the RNase P specificity domain. (A) Overlay of SHAPE-Seq reactivities on an RNase P structure diagram (18). Θ were converted into reactivities by the 2%/8% rule for purposes of visualization. (Inset) Correlation between SHAPE-Seq and SHAPE-CE reactivities. Solid line represents a slope of one. Nucleotide G100 (asterisk) was not included for the R value indicated in parenthesis. (B) Crystal structure of RNase P [from ref. 18)] with nucleotides color-coded by reactivity as in A. (C) The Jensen-Shannon divergence (Top) and correlation coefficient R (Bottom) calculated between each bar code and the WT RNase P Θ, plotted versus the total number of reads mapped for each bar code. The average JS divergence and R are 0.02 and 0.99, respectively.
A plot of SHAPE-Seq versus SHAPE-CE reactivities for every nucleotide of RNase P shows a high degree of correlation between the two (R = 0.72) indicating that SHAPE-Seq accurately recapitulates SHAPE structure information (Fig. 2A, Inset). Pearson’s R correlation was determined both with and without inclusion of nucleotide G100 (asterisk in Fig, 2A, Inset). Nucleotide G100, although characterized as highly reactive in both methods, showed a much higher reactivity in SHAPE-Seq. Because it is a highly flexible nucleotide within a highly flexible loop, this does not change the consistency of these data with the known RNase P structure. It was therefore considered as an outlier based on structural interpretation. Two other nucleotides, U119 and U120, show similar behavior but to a lesser extent. These nucleotides are also within a highly flexible loop and are also characterized as highly reactive according to SHAPE-CE. Although there are quantitative differences between SHAPE-Seq and SHAPE-CE at these positions, the overall structural interpretation is not affected by the method used.
It should be noted that several regions of the SHAPE-Seq reactivity spectrum, namely the nucleotides A130 and A194, and the P10.1 loop were not as reactive as observed by SHAPE-CE. Nucleotides A130 and A194 are single nucleotide bulges that stack with other purines in the molecule (Fig. S3). This interaction is expected to cause a decrease in nucleotide flexibility and reactivity to 1M7. This is indeed what is observed in SHAPE-Seq (approximately 30% reactivity). This is nominally less than the reactivity obtained using SHAPE-CE and could be a result of the extra protocol steps required for SHAPE-Seq causing less sensitivity to this type of structural effect. Importantly, however, because SHAPE-Seq displays reactivity in this region, it does not alter the interpretation of the RNase P structure. The P10.1 loop is a stable UUCG tetraloop, which contains a stabilizing GU wobble closing the loop and constraining these nucleotides compared to other single-stranded regions in the RNA (Fig. S3). The lower reactivity observed in SHAPE-Seq (approximately 15% reactive) compared to SHAPE-CE (approximately 20–70% reactive) does not alter the overall interpretation of the data. Despite being unpaired on the secondary structure map, the P12 loop is known to form a well-defined tertiary interaction with the P10.1 helix and has been previously observed to be unreactive in conventional SHAPE-CE experiments (6). This is indeed observed in the SHAPE-Seq reactivity spectrum (Fig. 2A).
Fig. 2B shows an overlay of SHAPE-Seq data onto the known three-dimensional crystal structure of RNase P. The SHAPE-Seq reactivity data are remarkably consistent, with highly reactive nucleotides mapping onto positions of high flexibility, especially unpaired nucleotides that are not participating in tertiary contacts (Fig. S3). This demonstrates the power of SHAPE-Seq to infer both secondary and tertiary structural information.
Bar Coding Allows Multiplexed Structure Characterization.
One of the advantages of SHAPE-Seq is the ability to simultaneously determine structural information from many RNAs at once through direct sequencing of 3′ RNA bar codes (Fig. 1). To test this, we added 256 different bar-coded versions of the WT RNase P RNA into the same pool as the un-bar-coded WT RNase P RNA discussed above and carried out the SHAPE-Seq pipeline. The bar codes consisted of all four-nucleotide sequences and were placed in the 3′ structure cassette commonly used in SHAPE experiments (Fig. S1). These were introduced with degenerate primers before in vitro transcription of the RNA pool (see Materials and Methods).
Over 8.6 million bar-coded reads were mapped. For each bar code, Θ and c were calculated automatically according to the SHAPE-Seq data analysis pipeline (Fig. 1). The total number of sequenced fragments for each bar code was uneven (ranging from 10,488 to 308,978), most likely due to biases in random primer synthesis (Fig. S4). However, this gave us an opportunity to study how many fragments need to be mapped to accurately reconstruct SHAPE reactivity profiles. The distribution of c was tightly peaked around a value of 0.76, which closely matched the WT RNase P SHAPE-Seq data where c = 0.73 (Fig. S5).
The reactivities Θ from the 256 bar-coded molecules were compared to the WT RNase P SHAPE-Seq reactivity profile in two ways. To directly compare SHAPE-Seq reactivity profiles, we computed the Jensen-Shannon (JS) divergence between Θbar code and ΘWT for each bar code (see SI Text). The JS divergence takes into account the reactivity information at every nucleotide and has a value in between 0 and 1. It is a symmetric measure of the similarity between two distributions with identical distributions having JS divergence = 0. As shown in Fig. 2C, the histogram of the JS divergences for each bar code is extremely tightly peaked with an average JS divergence of 0.02. As another measure, we computed Pearson correlation coefficients, R, between the SHAPE-Seq Θ of bar-coded and WT RNase P. The correlation coefficient measures the degree to which the two datasets lie on a line and ranges from -1 for anticorrelated data to 1 for perfectly correlated data. Fig. 2C shows a histogram of R for all bar codes, which again is tightly peaked with an average of 0.99.
As shown in Fig. 2, both of these measures have a very weak dependence on the total number of fragments mapped for each bar code. The GGGG bar code was the least represented with 10,488 total hits spread over 204 nucleotides and had a SHAPE-Seq reactivity profile that was extremely similar to the non-bar-coded RNase P (R = 0.99, JSD = 0.04) (Fig. S6). By dividing by the total fragment counts observed for each bar code, we estimate that an upper bound of 0.1 pmol of RNA is needed to recover a SHAPE-Seq reactivity profile for RNase P. This is in contrast to current SHAPE-CE protocols that require a minimum of 3 pmol of each RNA (19). In terms of the amount of RNA used in this experiment, with 0.1 pmol of each RNA, it would be possible to infer accurate SHAPE-Seq reactivities of over 800 bar-coded RNA species.
SHAPE-Seq Resolves Local Structural Changes due to Point Mutations.
With bar coding, we have the ability to identify structural changes due to single point mutations in any given RNA molecule. As part of a seven-member SHAPE-Seq library, we generated five bar-coded variants of the native RNase P molecule from the previous library. These included the WT and the following point mutants: ΔA130, A130U, A131, and A194U (Table S1). These specific RNase P mutations were chosen at bulged nucleotides in the RNA to provide local, subtle changes in secondary structure. The SHAPE-Seq pipeline was applied to this mixture of RNAs to determine the changes in reactivity at positions 130 and 194 in the RNA due to the four point mutations (Fig. 3). Almost all other positions in the RNA remain unchanged compared to the wild-type RNase P RNA, and all RNAs had a similar number of mapped reads ranging from 1,441,075 to 1,224,576 (Fig. S7).
Fig. 3.

SHAPE-Seq reactivities for position 194 (magenta bars, Top) and position 130 (blue bars, Bottom) for each RNase P variant within a seven-membered RNA library. The positions of each nucleotide are highlighted in the simplified secondary structure for RNase P on the right. Pearson’s R values and Jensen–Shannon divergences (JSD) between SHAPE-Seq and SHAPE-CE for each RNA are summarized in the table.
The reactivity at positions 130 and 194 show only subtle changes for each of the four mutants as expected with only a couple of exceptions (Fig. 3). The reactivity of the A130U mutant remains unchanged at both position 130 and 194, indicating that a U at position 130 maintains a similar structural role in the RNA and does not disrupt the native stacking interaction at that position. The ΔA130 mutant has a gap in reactivity at position 130 as expected and shows little change in reactivity at position A194. That combined with fact that the RNA maintains a similar overall reactivity pattern indicates that removal of the stacking interaction at position 130 does not greatly impact the structural integrity of the RNA. The A131 RNA, which contains two bulged A nucleotides at position 130, shows a large increase in reactivity at one of the A’s and a very similar reactivity to wild type at the other A. This indicates that one of the A’s maintains a similar structural role to the wild-type A130 position by stacking with another purine nucleotide, whereas the other bulged A is much more flexible and is most likely not participating in any constraining interactions with neighboring nucleotides. Finally, the A194U mutant RNA shows a very similar reactivity at position 130 and a slightly lower reactivity at position 194. The cause of this decrease is unclear; however, it could be explained by enhanced stacking, or a G-U wobble interaction at this position (Fig. S3), causing the nucleotide to be more constrained and therefore less reactive.
The overall reactivities of the WT RNase P and the four mutants obtained using the SHAPE-Seq pipeline are similar to those obtained using the SHAPE-CE method (Fig. 3). A more detailed inspection of reactivity profiles around the mutation sites (Fig. S7) show that the changes in reactivity follow the same general trend in both SHAPE-Seq and SHAPE-CE with two notable exceptions. First, as mentioned above, SHAPE-CE shows higher reactivities for mutations at the 130 and 194 sites. Second, there is a reversal in the reactivity trend for RNase P A194U at the mutation position between SHAPE-Seq and SHAPE-CE. Although there is an inconsistency between the two techniques at this single position, the interpretation of the point mutations at every other position are the same by either method. However, SHAPE-Seq allows the experiment to be done in a single tube and with rigorous, automated mathematical analysis.
SHAPE-Seq Simultaneously Determines the Structures in a Complex Mixture of RNAs.
Finally, to demonstrate our ability to simultaneously determine the structure of unrelated RNA molecules, we added two variants of the pT181 transcriptional attenuator (20, 21) to the SHAPE-Seq library containing the five RNases P to make up the seven-member library. The full SHAPE-Seq pipeline was applied to generate secondary structures for two different lengths of the pT181 RNA, which represent transcription intermediates of the full-length attenuator (Fig. 4). The reactivity profile of the RNAs obtained from SHAPE-Seq is extremely similar to SHAPE-CE reactivities obtained from individual probing experiments on these RNAs (Fig. S8).
Fig. 4.

Secondary structure models for 112 (top) or 132 nucleotide (bottom) variants of the pT181 transcriptional attenuator. Secondary structures are the output of RNAstructure using reactivities from the SHAPE-Seq experiment as pseudo-free-energy constraints (see SI Text). Nucleotides are color-coded according to SHAPE-Seq reactivities using the color scale in Fig. 2.
The reactivities from SHAPE-Seq clearly show that the two RNAs fold into identical structures at the 5′ end of the transcript, but different structures at the 3′ end. The pT181 attenuator regulates transcription elongation by folding into alternative structures that either block or allow passage of RNA polymerase (20). These structures evolve during the process of transcription, and the changes observed in the SHAPE-Seq-determined structures likely reflect intermediate cotranscriptional folding states. Both of these structures agree with previous structure probing experiments (20).
Discussion
The Capabilities of SHAPE-Seq.
SHAPE-Seq was designed to combine the resolution and robustness of SHAPE, and the throughput, quantitation, and multiplexing capabilities of paired-end deep sequencing. As such, SHAPE-Seq makes several improvements over traditional SHAPE-CE. Because of the digital nature of direct cDNA sequencing, we were able to develop a rigorous and automated data analysis pipeline that obviates the need for expert knowledge and user-defined parameters needed to analyze SHAPE-CE experiments (16). Furthermore, the depth of sequence coverage provided by deep sequencing makes SHAPE-Seq a more sensitive technique, with approximately only 0.1 pmol of RNA needed to accurately map a SHAPE reactivity spectrum for RNase P. This property makes SHAPE-Seq particularly useful for precious biological samples for which only a small amount of starting RNA is available.
Recently, a pair of related nuclease-based high-throughput RNA structure probing techniques were developed (3, 4). Although they were able to simultaneously probe a complex mixture of RNAs derived from transcriptomes, they generally had poor overall accuracy (5). Compared to these techniques, SHAPE-Seq has several distinct advantages. First, unlike bulky nuclease proteins, the small chemical probe used in SHAPE experiments can be used to infer both secondary and tertiary structural information from RNAs in solution. SHAPE-Seq should thus be able to directly provide much-needed information for the growing development of algorithms to predict tertiary RNA structures from primary sequence (22). Furthermore, SHAPE is routinely used in variable temperature and buffer conditions and is not constrained to the limited environments necessary for enzymes to function.
At the level of sequencing, SHAPE-Seq removes a critical issue with the previous techniques that require the whole cDNA to be sequenced. These methods perform a size selection on the cleaved RNAs that discards short fragments, which prevents them from mapping certain portions of RNA molecules. SHAPE-Seq requires only a small number of bases to be sequenced on either end of the cDNA molecule and is thus not subject to this type of bias (Fig. S9).
The previous techniques also relied on the sequence divergence of the RNA mixture to map each fragment onto a unique RNA species. Because of the SHAPE-Seq bar-coding strategy, it is able to resolve the structural consequences of just single nucleotide changes (Fig. 3) making it a more general technique. This could be particularly useful in experiments that use systematic mutate-and-map strategies to uncover the three-dimensional orientation of nucleotides (23).
Finally, the output of a SHAPE-Seq experiment is a set of reactivities that can be directly plugged into existing RNA structure algorithms to guide the computational folding of RNAs (9). We found that SHAPE-Seq reactivities used in this way were able to recapitulate the structures of the two pT181 attenuator length variants used in this study (Fig. 4). Because these two structures represent possible folding intermediates during transcription of the attenuator, SHAPE-Seq could be used to recapitulate RNA cotranscriptional folding pathways by simultaneously probing intermediate length RNAs, each with its own bar code.
We note that although the data from SHAPE-Seq are extremely similar to those from SHAPE-CE, there are differences. These could be due to the multiple extra steps required in the SHAPE-Seq protocol, including adapter ligation, PCR, and cluster formation/sequencing steps required for any Illumina Seq method. Even so, using the built-in (-) control, the mathematical framework accurately recovers Θ values, which in some cases appear to be more accurate than those obtained from SHAPE-CE (see Fig. S8).
Extending SHAPE-Seq.
The ability of SHAPE-Seq to simultaneously infer structural information on a mixture of RNA species can be extended in powerful ways. Although the RNAs in this work were found to be noninteracting, the technique can be extended to intentionally study structural changes that result from specific RNA–RNA or RNA–protein interactions. This would be done by performing SHAPE-Seq on mixtures of RNAs with and without proteins or RNAs predicted to interact with the mixture. The data could then be compared to find changes in nucleotide flexibility that resulted from either direct binding to the RNA or indirect conformational changes, or both. Aside from being much more high throughput than SHAPE-CE, SHAPE-Seq provides a more detailed, higher resolution view of these interactions versus traditional native gel electrophoresis or filter partitioning approaches to examining RNA–RNA and RNA–protein interactions. A similar strategy could be used to probe pools of RNAs in the presence or absence of ligands for rapid, single step SELEX of RNA aptamers.
Equally important, SHAPE-Seq benefits greatly from the many extensions already under way for SHAPE. In particular, faster-acting SHAPE reagents such as BzCN could be used with multiplexing to probe RNA folding pathways (10). The protocol is also directly applicable to mapping modifications from other structure-dependent probes (23). Furthermore, SHAPE-Seq will directly benefit from improvements in deep sequencing technologies that will make these experiments even more practical for individual researchers.
SHAPE-Seq thus represents a powerful step in making the study of RNA secondary and tertiary structures high throughput and accessible to a wide array of scientific pursuits, from fundamental biological investigations to engineering RNA synthetic biological systems.
Materials and Methods
Structure-Selective RNA Modification.
All RNAs were synthesized with standard in vitro synthesis and modified with 1M7 (6.5 mM, final) as described previously with minor modifications for the analysis by deep sequencing (6). See SI Text for details.
SHAPE Analysis by Capillary Electrophoresis.
The general procedure of primer extension and data analysis is that of ref. 24.
SHAPE Analysis by Deep Sequencing.
The procedure for first strand cDNA synthesis was carried out following the primer extension protocol outlined elsewhere (24) using RT primers with tails containing the Illumina A_adapter_t and (+) or (-) handles (see SI Text). After primer extension, RNA was hydrolyzed and the Illumina A_adapter b was ligated to each cDNA using a ssDNA ligase (circLigase, Epicentre). Excess A_adapter_b was removed using Agencourt Ampure XP beads. Finally, 9 or 12 cycles of PCR amplification were performed (13) with no post size-selection step. Libraries were assayed for quality on an Agilent Bioanalyzer 2100 using a high-sensitivity DNA chip and then sequenced on an Illumina Genome Analyzer IIx for 50 cycles of sequencing per paired-end read. Data available upon request. See SI Text for a detailed protocol.
Bioinformatic Analysis of Bar-Coded Sequencing Reads.
Reads for RT fragments were first split into 1M7-treated and -untreated pools by examining the 4-nucleotide handle sequence on the 5′ end of the read generated from the 3′ end of each RNA probed in the experiment. This handle was then trimmed from each read to allow alignment of the reads to probed RNAs. Reads were then trimmed for A_adapter_b and A_adapter_t using the FASTX toolkit [http://hannonlab.cshl.edu/fastx_toolkit/] (see SI Text). Paired reads were optimally aligned to the probed RNAs using Bowtie 0.12.8 (15) to determine RT-stop counts. These RT-stop counts were then used to calculate ML-based reactivities. See SI Text for details.
Processing of SHAPE-Seq Data by Maximum Likelihood Estimation.
A stochastic model of SHAPE-Seq parameterized by reactivities, Θ, the expected number of modificiations per molecule, c, and natural polymerase drop-off rates, Γ, was used to infer the quantities of interest via maximum likelihood estimation (7). We assumed that the number of modifications per RNA was Poisson distributed, with an unknown parameter, c, to be estimated. With this model, the likelihood of a set of fragment counts X in the (+) channel and Y in the (-) channel obtained in an experiment was calculated by
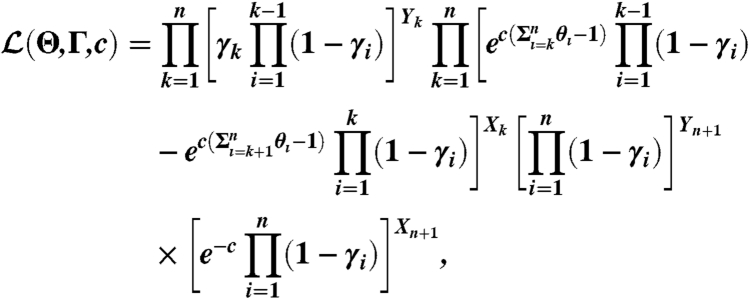 |
where Xk, Yk were the number of fragments reaching the kth position in the RNA. Details of the model derivation and analysis are provided in ref. 7.
Converting Between Θ and Reactivity.
Where needed, Θ were converted into SHAPE reactivities by excluding the top 2% of reactivites and normalizing by the average of the next 8% (9). Where needed, SHAPE-CE reactivities were converted to Θ by dividing by the sum of the reactivities so that the sum of the Θ was equal to 1. In cases where an exponential decay correction was not applied to the SHAPE-CE data (16), Θ was calculated using the ML correction (7).
Secondary Structure Prediction Using SHAPE-Seq Reactivity Constraints.
SHAPE reactivities were converted into a pseudo-free-energy change term in the RNA structure program following standard procedures (9). See SI Text for details.
Supplementary Material
Acknowledgments.
The authors thank Michael Eisen, Jacqueline Villalta, Oh Kyu Yoon, Leath Tonkin, Devin Scannell, Jennifer Kuehl, and Keith Keller for advice and assistance. We thank Rhiju Das for insightful reading of the manuscript. We also thank Phil Homan (University of North Carolina, Chapel Hill, NC) and Kevin Weeks (University of North Carolina, Chapel Hill, NC) for the generous gift of 1M7. J.A.D. is a Howard Hughes Medical Institute (HHMI) Investigator, and this work was supported in part by the HHMI. S.A.M. is a fellow of the Leukemia and Lymphoma Society. A.P.A., J.B.L., and S.A. acknowledge support from the Synthetic Biology Engineering Research Center under National Science Foundation Grant 04-570/0540879. J.B.L. and L.P. thank the Miller Institute for financial support, and a stimulating environment in which this work was conceived.
Footnotes
The authors declare no conflict of interest.
See Commentary on page 10933.
This article contains supporting information online at www.pnas.org/lookup/suppl/doi:10.1073/pnas.1106501108/-/DCSupplemental.
References
- 1.Sharp PA. The centrality of RNA. Cell. 2009;136:577–580. doi: 10.1016/j.cell.2009.02.007. [DOI] [PubMed] [Google Scholar]
- 2.Isaacs FJ, Dwyer DJ, Collins JJ. RNA synthetic biology. Nat Biotechnol. 2006;24:545–554. doi: 10.1038/nbt1208. [DOI] [PubMed] [Google Scholar]
- 3.Kertesz M, et al. Genome-wide measurement of RNA secondary structure in yeast. Nature. 2010;467:103–107. doi: 10.1038/nature09322. [DOI] [PMC free article] [PubMed] [Google Scholar]
- 4.Underwood JG, et al. FragSeq: Transcriptome-wide RNA structure probing using high-throughput sequencing. Nat Methods. 2010;7:995–1001. doi: 10.1038/nmeth.1529. [DOI] [PMC free article] [PubMed] [Google Scholar]
- 5.Mauger DM, Weeks KM. Toward global RNA structure analysis. Nat Biotechnol. 2010;28:1178–1179. doi: 10.1038/nbt1110-1178. [DOI] [PMC free article] [PubMed] [Google Scholar]
- 6.Mortimer SA, Weeks KM. A fast-acting reagent for accurate analysis of RNA secondary and tertiary structure by SHAPE chemistry. J Am Chem Soc. 2007;129:4144–4145. doi: 10.1021/ja0704028. [DOI] [PubMed] [Google Scholar]
- 7.Aviran S, et al. Modeling and automation of sequencing-based characterization of RNA structure. Proc Natl Acad Sci USA. 2011 doi: 10.1073/pnas.1106541108. 10.1073/pnas.1106541108. [DOI] [PMC free article] [PubMed] [Google Scholar]
- 8.Reuter JS, Mathews DH. RNAstructure: Software for RNA secondary structure prediction and analysis. BMC Bioinformatics. 2010;11:129. doi: 10.1186/1471-2105-11-129. [DOI] [PMC free article] [PubMed] [Google Scholar]
- 9.Low JT, Weeks KM. SHAPE-directed RNA secondary structure prediction. Methods. 2010;52:150–158. doi: 10.1016/j.ymeth.2010.06.007. [DOI] [PMC free article] [PubMed] [Google Scholar]
- 10.Mortimer SA, Weeks KM. Time-resolved RNA SHAPE chemistry. J Am Chem Soc. 2008;130:16178–16180. doi: 10.1021/ja8061216. [DOI] [PubMed] [Google Scholar]
- 11.Stoddard CD, Gilbert SD, Batey RT. Ligand-dependent folding of the three-way junction in the purine riboswitch. RNA. 2008;14:675–684. doi: 10.1261/rna.736908. [DOI] [PMC free article] [PubMed] [Google Scholar]
- 12.Wilkinson KA, Merino EJ, Weeks KM. RNA SHAPE chemistry reveals nonhierarchical interactions dominate equilibrium structural transitions in tRNA(Asp) transcripts. J Am Chem Soc. 2005;127:4659–4667. doi: 10.1021/ja0436749. [DOI] [PubMed] [Google Scholar]
- 13.Ingolia NT, Ghaemmaghami S, Newman JRS, Weissman JS. Genome-wide analysis in vivo of translation with nucleotide resolution using ribosome profiling. Science. 2009;324:218–223. doi: 10.1126/science.1168978. [DOI] [PMC free article] [PubMed] [Google Scholar]
- 14.Li TW, Weeks KM. Structure-independent and quantitative ligation of single-stranded DNA. Anal Biochem. 2006;349:242–246. doi: 10.1016/j.ab.2005.11.002. [DOI] [PubMed] [Google Scholar]
- 15.Langmead B, Trapnell C, Pop M, Salzberg SL. Ultrafast and memory-efficient alignment of short DNA sequences to the human genome. Genome Biol. 2009;10:R25. doi: 10.1186/gb-2009-10-3-r25. [DOI] [PMC free article] [PubMed] [Google Scholar]
- 16.Vasa SM, Guex N, Wilkinson KA, Weeks KM, Giddings MC. ShapeFinder: A software system for high-throughput quantitative analysis of nucleic acid reactivity information resolved by capillary electrophoresis. RNA. 2008;14:1979–1990. doi: 10.1261/rna.1166808. [DOI] [PMC free article] [PubMed] [Google Scholar]
- 17.Gherghe CM, Shajani Z, Wilkinson KA, Varani G, Weeks KM. Strong correlation between SHAPE chemistry and the generalized NMR order parameter (S2) in RNA. J Am Chem Soc. 2008;130:12244–12245. doi: 10.1021/ja804541s. [DOI] [PMC free article] [PubMed] [Google Scholar]
- 18.Krasilnikov AS, Yang X, Pan T, Mondragón A. Crystal structure of the specificity domain of ribonuclease P. Nature. 2003;421:760–764. doi: 10.1038/nature01386. [DOI] [PubMed] [Google Scholar]
- 19.Wilkinson KA, Merino EJ, Weeks KM. Selective 2′-hydroxyl acylation analyzed by primer extension (SHAPE): Quantitative RNA structure analysis at single nucleotide resolution. Nat Protoc. 2006;1:1610–1616. doi: 10.1038/nprot.2006.249. [DOI] [PubMed] [Google Scholar]
- 20.Brantl S, Wagner EGH. Antisense RNA-mediated transcriptional attenuation: An in vitro study of plasmid pT181. Mol Microbiol. 2000;35:1469–1482. doi: 10.1046/j.1365-2958.2000.01813.x. [DOI] [PubMed] [Google Scholar]
- 21.Lucks JB, Qi L, Mutalik V, Wang D, Arkin AP. Versatile RNA-sensing transcriptional regulators for engineering genetic networks. Proc Natl Acad Sci USA. 2011;108:8617–8622. doi: 10.1073/pnas.1015741108. [DOI] [PMC free article] [PubMed] [Google Scholar]
- 22.Das R, Karanicolas J, Baker D. Atomic accuracy in predicting and designing noncanonical RNA structure. Nat Methods. 2010;7:291–294. doi: 10.1038/nmeth.1433. [DOI] [PMC free article] [PubMed] [Google Scholar]
- 23.Kladwang W, Das R. A mutate-and-map strategy for inferring base pairs in structured nucleic acids: Proof of concept on a DNA/RNA helix. Biochemistry. 2010;49:7414–7416. doi: 10.1021/bi101123g. [DOI] [PubMed] [Google Scholar]
- 24.Mortimer SA, Weeks KM. Time-resolved RNA SHAPE chemistry: Quantitative RNA structure analysis in one-second snapshots and at single-nucleotide resolution. Nat Protoc. 2009;4:1413–1421. doi: 10.1038/nprot.2009.126. [DOI] [PMC free article] [PubMed] [Google Scholar]
Associated Data
This section collects any data citations, data availability statements, or supplementary materials included in this article.