Abstract
We present new sea-level reconstructions for the past 2100 y based on salt-marsh sedimentary sequences from the US Atlantic coast. The data from North Carolina reveal four phases of persistent sea-level change after correction for glacial isostatic adjustment. Sea level was stable from at least BC 100 until AD 950. Sea level then increased for 400 y at a rate of 0.6 mm/y, followed by a further period of stable, or slightly falling, sea level that persisted until the late 19th century. Since then, sea level has risen at an average rate of 2.1 mm/y, representing the steepest century-scale increase of the past two millennia. This rate was initiated between AD 1865 and 1892. Using an extended semiempirical modeling approach, we show that these sea-level changes are consistent with global temperature for at least the past millennium.
Keywords: climate, ocean, late Holocene, salt marsh
Climate and sea-level reconstructions encompassing the past 2,000 y provide a preanthropogenic context for understanding the nature and causes of current and future changes. Hemispheric and global mean temperature have been reconstructed using instrumental records supplemented with proxy data from natural climate archives (1, 2). This research has improved understanding of natural climate variability and suggests that modern warming is unprecedented in the past two millennia (1). In contrast, understanding of sea-level variability during this period is limited and the response to known climate deviations such as the Medieval Climate Anomaly, Little Ice Age, and 20th century warming is unknown. We reconstruct sea-level change over the past 2100 y using new salt-marsh proxy records and investigate the consistency of reconstructed sea level with global temperature using a semiempirical relationship that connects sea-level changes to mean surface temperature (3, 4). The new sea level proxy data constrain a multicentennial response term in the semiempirical model.
Results and Discussion
Sea-Level Data.
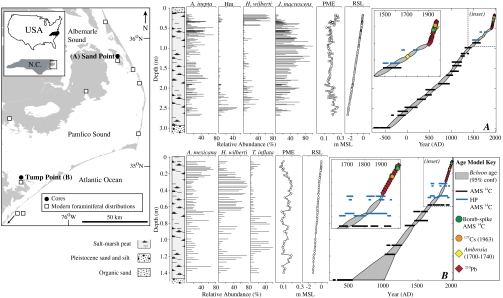
Salt-marsh sediments and assemblages of foraminifera record former sea level because they are intrinsically linked to the frequency and duration of tidal inundation and keep pace with moderate rates of sea-level rise (5, 6). We developed transfer functions using a modern dataset of foraminifera (193 samples) from 10 salt marshes in North Carolina, USA (7). Transfer functions are empirically derived equations for quantitatively estimating past environmental conditions from paleontological data (8). The transfer functions were applied to foraminiferal assemblages preserved in 1 cm thick samples from two cores of salt-marsh sediment (Sand Point and Tump Point, North Carolina; Fig. 1) to estimate paleomarsh elevation (PME), which is the tidal elevation at which a sample formed with respect to its contemporary sea level (9). Unique vertical errors were calculated by the transfer functions for each PME estimate and were less than 0.1 m. Composite chronologies were developed using Accelerator Mass Spectrometry (AMS) 14C (conventional, high-precision, and bomb-spike), a pollen chrono-horizon (increased Ambrosia at AD 1720 ± 20 y), 210Pb inventory, and a 137Cs spike (AD 1963). A probabilistic age-depth model (10) incorporating all dating results was generated separately for each core to reduce chronological uncertainty and provide downcore age estimates at 1 cm intervals with uncertainties that varied from ± 1 to ± 71 y for 95% of samples (Fig. 1).
Fig. 1.
Litho-, bio-, and chrono-stratigraphy of the Sand Point (A) and Tump Point (B) cores (North Carolina, USA). Chronologies were developed using AMS 14C dating (conventional, high-precision, HP, and bomb-spike), 210Pb, 137Cs, and a pollen horizon (Ambrosia). All dating results were combined to produce a probabilistic age-depth model for each core (10), shown as a gray-shaded area (95% confidence limits). This model estimated the age (with unique uncertainty) of samples at 1 cm resolution. Paleo marsh elevation (PME) above mean sea-level (MSL) was estimated for each sample by application of transfer functions to complete foraminiferal assemblages. Only the most abundant species are shown ( ). RSL was estimated by subtracting PME from measured sample altitude.
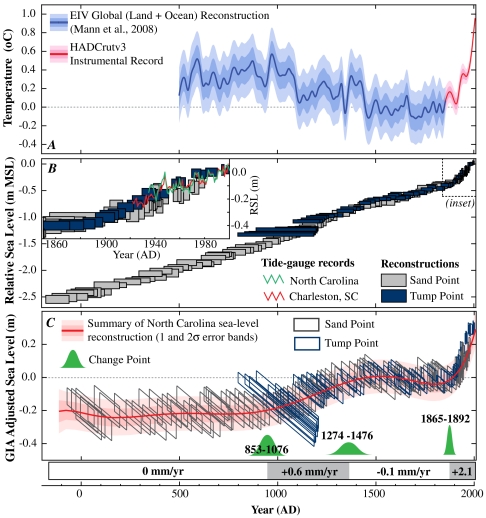
Relative sea level (RSL) was reconstructed by subtracting transfer-function derived estimates of PME from measured sample altitudes (Fig. 2B). Agreement of geological records with trends in regional and global tide-gauge data (Figs. 2B and 3) validates the salt-marsh proxy approach and justifies its application to older sediments (11, 12). Despite differences in accumulation history and being more than 100 km apart, Sand Point and Tump Point recorded near identical RSL variations. This agreement suggests that local-scale factors including tidal-range change and sediment compaction were not important influences on RSL in the region over the past two millennia. Accord between the age and altitude of basal and nonbasal samples (13, 14) provided further evidence that both records were free of detectable compaction.
Fig. 2.
(A) Composite EIV global land plus ocean global temperature reconstruction (1), smoothed with a 30-year LOESS low-pass filter (blue). Data since AD 1850 (red) are HADCrutv3 instrumental temperatures. Values are relative to a preindustrial average for AD 1400–1800 (B) RSL reconstructions at Sand Point and Tump Point since BC 100. Boxes represent sample-specific age and sea-level uncertainties (2σ). Inset is a comparison with nearby tide-gauge data. (C) GIA-adjusted sea level at Sand Point and Tump Point expressed relative to a preindustrial average for AD 1400–1800. Sea-level data points are represented by parallelograms because of distortion caused by GIA, which has a larger effect on the older edge of a data point than on the younger edge. Times of changes in the rate of sea-level rise (95% confidence change-point intervals) are shown. Pink envelope is a nine degree polynomial to visually summarize the North Carolina sea-level reconstruction.
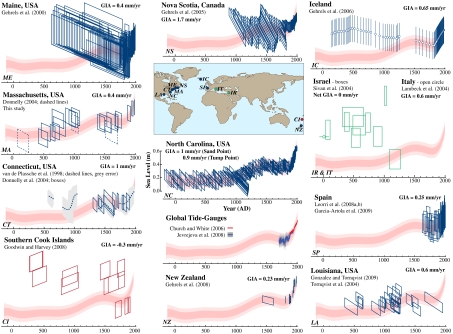
Fig. 3.
Late Holocene sea-level reconstructions after correction for GIA. Rate applied (listed) was taken from the original publication when possible. In Israel, land and ocean basin subsidence had a net effect of zero (26). Reconstructions from salt marshes are shown in blue; archaeological data in green; and coral microatolls in red. Tide-gauge data expressed relative to AD 1950–2000 average, error from (32) in gray. Vertical and horizontal scales for all datasets are the same, and are shown for North Carolina. Datasets were vertically aligned for comparison with the summarized North Carolina reconstruction (pink).
To extract climate-related rates of sea-level rise (Fig. 2C), we applied corrections for crustal movements associated with spatially variable and ongoing glacial isostatic adjustment (GIA). A constant rate of subsidence (with no error) was subtracted from the Sand Point (1.0 mm/y) and Tump Point (0.9 mm/y) records. These rates were estimated from a US Atlantic coast database of late Holocene (last 2000 y) sea-level index points (13, 15). Use of a constant rate is appropriate for this time period given Earth’s rate of visco-elastic response (14). The resulting records are termed “GIA-adjusted,” expressed relative to mean sea level from AD 1400–1800 and visually summarized by an envelope (Fig. 2C). Using Bayesian multiple change-point regression (16), we identified four intervals (successive linear trends) of long-term (century scale), persistent sea-level variations with 95% confidence (Fig. 2C). Within the error bounds of reconstructed sea level, greater variability in rates at subcentennial time scales can be accommodated. From at least BC 100 until AD 950, sea level was stable (0.0 to + 0.1 mm/y). Between AD 850 and 1080 the rate of sea-level rise increased to 0.6 mm/y (0.4 to 0.8 mm/y) for the following 400 y. A second change point at AD 1270–1480 marked a return to stable, or slightly negative, sea level (−0.2 to 0.0 mm/y), which persisted until the end of the 19th century. Between AD 1865 and 1892 sea-level rise increased to a mean rate of 2.1 mm/y (1.9 to 2.2 mm/y) (12). Sea-level variations in the last 2100 y did not exceed ± 0.25 m until the onset of the modern rise in the late 19th century. The modern rate of sea-level rise was greater than any century-scale trend in the preceding 2100 y; a conclusion that is independent of the GIA correction applied.
Comparison with Other Proxy Sea-Level Reconstructions.
Most RSL reconstructions spanning the last 2000 y are from near- and intermediate-field regions affected by glacio-isostatic land movement because of their proximity to former ice sheets. To facilitate comparison among records, all sea-level reconstructions (including far-field regions) were adjusted for estimated GIA (Fig. 3). In Massachusetts, we developed a high-resolution reconstruction of RSL for the past 1500 y using macrofossils of common salt-marsh plants as sea-level indicators (Fig. S1). Sea level was stable prior to AD 500 and rose from AD 500 to 1000. The Massachusetts data agree with the North Carolina reconstruction, except for higher sea level between AD 700 and 1000 (although the uncertainty ranges overlap). There is a scarcity of high-resolution sea-level data covering the Medieval Climate Anomaly, particularly outside of North America (Fig. 3). Salt-marsh proxy records from the Gulf of Mexico (17, 18) show stable sea level until AD 1000, followed by rise to a peak at AD 1200. In Connecticut, sea level rose rapidly at AD 1000 (19), although this record may be compromised by sedimentary hiatuses from hurricane erosion (20, 21). In Iceland, sea level fell gradually from AD 500 to 1800, possibly as a result of regional steric influences (22). All records from the Atlantic coast of North America, Gulf of Mexico, and New Zealand (23) show stable or falling sea level between AD 1400 and 1900 at the time of the Little Ice Age. A record from Connecticut (6) developed using salt-marsh plant macrofossils showed stable sea level between AD 1300 and 1800 (Fig. 3). The record from Maine (24) is inconclusive due to large uncertainties. In the Mediterranean Sea, archaeological evidence from Roman fish ponds in Italy located sea level 2000 y ago (50 BC to AD 100) at 0.13 m below present (25). In Israel, archaeological evidence compiled from coastal wells showed falling or stable sea level between AD 100 and 900 (26), including sea level above present from AD 300 to 700. There is some evidence for a 1 m sea-level oscillation at AD 1000. In the Cook Islands (far-field region), reconstructions from coral microatolls proposed falling sea level over the last 2000 y, including two low stands in the last 400 y separated by a high stand at AD 1750 indicating sea-level oscillations of up to 0.6 m (27), that are not observed in other proxy records. Atlantic reconstructions constrain the onset of modern sea-level rise to AD 1880–1920 (12) and are supported by salt-marsh records from Spain (28–30) and New Zealand (23). The Icelandic record suggests that local sea-level rise began earlier (AD 1800–1840). There are no reconstructions spanning the transition to modern rates of sea-level rise from the Mediterranean or far-field and these sea-level proxies have not been validated against instrumental records.
Representation of Global Sea-Level Changes.
There is close agreement between reconstructed sea level in North Carolina and compilations of global tide-gauge data (31, 32) (Fig. 3; SI Text). Between AD 1700 and 1900, global sea level rose by 9 ± 5 cm (32). Reconstructed sea-level rise in North Carolina for this period was 5 ± 5 cm. GIA-adjusted RSL change from AD 1900 to 2000 in North Carolina (24 ± 5 cm) exceeded the Intergovernmental Panel on Climate Change (IPCC) AR4 estimate for global 20th century rise (17 ± 5 cm), although the uncertainty ranges overlap. Tide-gauge estimates for 20th century sea-level rise were 16 cm (31) and 19 cm (32), but showed variability in rates of sea-level rise among ocean basins and confirm that 20th century rates in the northwest Atlantic exceeded the global average (33, 34). Regional deviations from global sea-level trends on the time scales of interest arise from unforced variability around the mean and forced differences in regional trends. The former arise from natural climate modes such as El Niño Southern Oscillation. Differences in trend can be large over short time scales, but become progressively smaller as longer time scales are considered. Forced differences may arise from ocean circulation changes (35) in response to climate change (associated with regional temperature and salinity changes) and/or changes in gravitational field due to melting of continental ice sheets. In contrast to unforced oscillations, these forced deviations can increase in one direction as climate changes. Multicentennial differences among regions are limited in magnitude by the restorative force of gravity, which pulls sea level toward the geoid. For North Carolina, we estimate that the deviation in sea-level rise from the global mean due to ocean circulation changes is between 0 and +5 cm. This estimate was based on the IPCC AR4 model ensemble for a 21st century global warming of ∼3 °C, in which sea level rises globally by 22–48 cm. We take 5 cm. as an upper limit estimate as temperature and sea-level variations over the last 2100 y were smaller (Fig. 2A). The gravitational effect from continental ice sheet melting on sea level along the Atlantic coast is negative and we conclude that an upper limit is -5 cm for the largest sea-level variations in North Carolina (SI Text).
IPCC AR4 (36) showed that local sea-level trends differed by up to 2 mm/y from the global mean over AD 1955–2003, which implies deviations of up to ±10 cm at some locations (but ±5 cm along most coastlines) as the sum of forced and unforced effects. This analysis suggests that our data can be expected to track global mean sea level within about ±10 cm over the past two millennia, within the uncertainty band shown for our analysis (Fig. 2C).
Modeling Sea Level from Global Temperature on a Millennial Time Scale.
Based on physical considerations, Rahmstorf (3) proposed a proportionality between the rate global sea-level change H and global temperature T (as a deviation from a preindustrial equilibrium T0):
| [1] |
as a first-order approximation on time scales from a few decades to a few centuries. Semiempirical models must be calibrated with data from the past (observational or proxy-based) to constrain how sea-level rise responded to temperature change. Applying this formula to the temperature record shown in Fig. 2A yielded (after time integration) the blue sea-level curve in Fig. 4D. Here a = 3.4 mm/y/K was used as reported in ref. 3 from observational data since AD 1880, but the preindustrial temperature (which is not constrained well by these data) was adjusted within its uncertainty to −0.35 K (from −0.5 K, relative to mean temperature AD 1951–1980). With the extended formula and parameters of Vermeer and Rahmstorf (4) similar results are obtained (using T0 = -0.35 K, instead of −0.41 K). The key difference is a larger acceleration factor (a = 0.56) from correction for water stored in artificial reservoirs, which increases the climate-related component of 20th century sea-level rise. These two models (3, 4) were designed to describe only the short-term response, but are in good agreement with reconstructed sea level for the past 700 y.
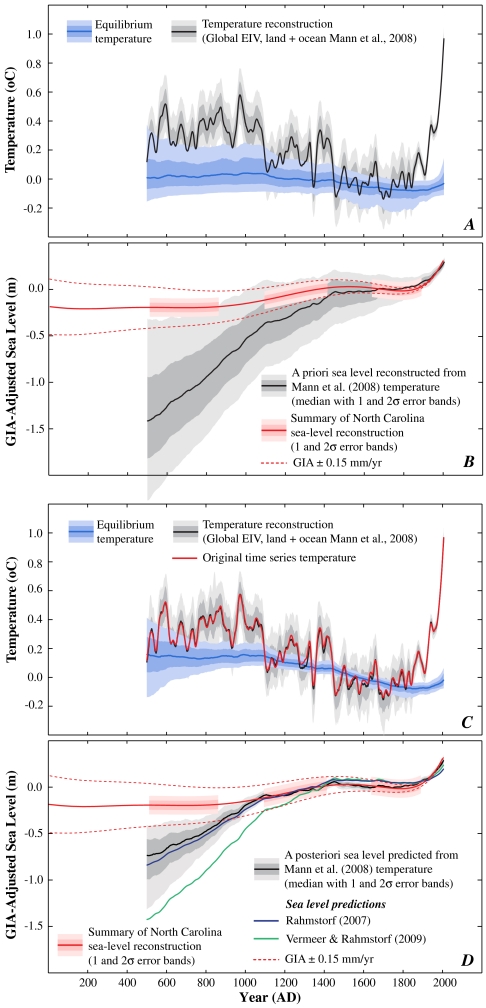
Fig. 4.
A priori and a posteriori sea-level predicted from paleo-temperature data. Temperature and GIA-adjusted sea level are expressed relative to AD 1400–1800 averages. Shaded error bands indicate 1σ and 2σ uncertainties. (A) A priori temperature (gray) and equilibrium temperature (blue). (B) A priori sea level predicted from temperature (gray) and summary of North Carolina sea-level reconstruction as cutaway bands (pink). An additional, systematic, GIA uncertainty (additive linear trend of 0.15 mm/y) is indicated by dashed red lines and exceeds the 2σ uncertainty of estimated GIA (0.1 mm/y). Temperatures and model parameters are set to the a priori distributions (Table S3). (C) A posteriori temperature [gray, original from ref. 1 is the red line] and equilibrium temperature T0(t) (blue). (D) Sea level predicted from temperature (gray) with summary of North Carolina sea-level reconstruction (pink). Salt-marsh proxy data used in Bayesian update were down-weighted by a factor of 10 and used only after AD 1000. Sea level predicted from refs. 4 and 3 are shown for comparison. Dashed red lines are as B.
The long proxy sea-level reconstruction from North Carolina gives a more robust constraint on the warming-induced, modern acceleration of sea-level rise (specifically by tight constraint of T0), because it is sufficiently long to include a multicentury period of stable sea level (AD 1400–1880; Fig. 2). This reconstruction also provides an opportunity to improve on earlier semiempirical studies by explicitly resolving the finite response time scale (τ) discussed (but then neglected due to the short time scale considered) in (3) and later implemented in (37).
Using the North Carolina data we thus added a term to the semiempirical model of Rahmstorf (3) as follows:
| [2a] |
| [2b] |
The first term captures a slow response compared to the time scale of interest (now one or two millennia, rather than one or two centuries as in Eq. 1). The second term represents intermediate time scales, where an initial linear rise gradually saturates with time scale τ as the base temperature (T0) catches up with T. In Eq. 1, T0 was assumed to be constant. The third term is the immediate response term introduced by Vermeer and Rahmstorf (4); it is of little consequence for the slower sea-level changes considered in this paper.
Grinsted et al. (37) used a single term with time scale τ to model sea level. We retained the short- and very long-term components to describe the full sea-level response on all time scales. In the following analysis, we kept the constraints established from instrumental sea-level data for AD 1880–2000 (4), which control the rapid response term (parameter b) and the sum of the first two terms on the RHS of Eq. 2a. Compatibility with values for AD 1880–2000 implies that the parameters in Eqs. 1 and 2 are linked as follows to give the same total sea-level rise for this period from both equations:
| [3] |
where 〈T0〉 is the average of T0(t) over AD 1880–2000. If the resulting time scale τ in Eq. 2 is multicentury, T0(t) will vary little and sea-level curves for AD 1880–2000 will be almost identical to those shown in ref. 4. The parameter values found previously (3) for this time period were:
 |
[4] |
Hence two new parameters, a2 and τ, together with an initial value T0,0, are introduced, which need to be constrained from the new sea-level reconstruction. To do so, we forced the model with a global temperature record, T(t), for AD 500–1850 (1). The two parameters were then constrained through Monte Carlo simulations combined with Bayesian updating from the North Carolina sea-level reconstruction (37).
A Priori Solution.
We generated temperature curves using the Mann et al. (1) reconstruction (global land and ocean, Error-in-Variables, EIV) and its formal uncertainties. These data fulfilled our requirement of global (not just hemispheric) land and ocean coverage. For the instrumental period (temperatures based on HADCrutv3 dataset), we conservatively assumed error margins of ±0.06 K for AD 1850–1950 and ±0.04 K for AD 1950–2006 for decadal averages. These uncertainties formed a band surrounding the Mann et al. (1) temperature curve (Fig. 4A). Temperature curves were translated into corresponding sea-level curves using Eqs. 2 and 3. We described the prior uncertainties of the fit parameters a1, a2, b, T0,0, T0(t), and τ. For a, b, and 〈T0〉 we took the values given in Eq. 4 as true. Our a priori error distributions are presented in Table S3.
An ensemble of sea-level curves, T0(t), and its uncertainties were computed by integrating Eq. 2. Fig. 4B shows the a priori analysis with all parameters varied across their full a priori uncertainty ranges. Since AD 1000, reconstructed sea level from North Carolina was within the uncertainty bands for sea level predicted from the paleo-temperature data of Mann et al. (1), showing broad consistency among proxy sea level and proxy temperature data under the semiempirical relationship (Eq. 2).
A Posteriori Solution.
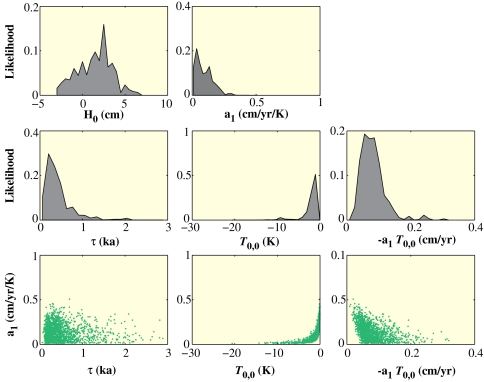
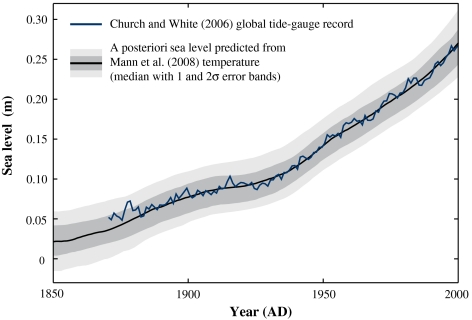
We combined the two sources of data to constrain parameters and narrow uncertainty by using the North Carolina sea-level data to perform a Bayesian update on the a priori solution (SI Text). After constraining the parameters of the semiempirical model (Fig. 5), a good agreement among predicted and reconstructed sea levels was achieved (Fig. 4D). Predicted sea level also agreed well with instrumental (tide gauge) data (31) since AD 1880 (Fig. 6).
Fig. 5.
Posterior probability density distributions and correlation point clouds for unknown parameters and functions of interest; ka is thousands of years.
Fig. 6.
Comparison of posterior solution with instrumental (tide gauge) data for AD 1880–2000. Black, gray: predicted sea level based on Mann et al. (1) temperatures (effectively HADcrutv3), as shown in Fig. 4D. Blue: Church and White (31) sea level, corrected for the artificial reservoir storage contribution (4).
To find acceptable agreement, τ must be finite and probably less than 1000 y (Fig. S3). This result is robust against inflating the uncertainties of Eq. 4 by a factor of 10, showing it to hold for a broad range of semiempirical fit parameters, not just those derived in Vermeer and Rahmstorf (4). See SI Text for details.
Divergence arises before AD 1000, when predicted sea level leaves the 2σ uncertainty band of reconstructed sea level, including GIA uncertainty of ±0.15 mm/y (Fig. 4). Reconstructed temperature showed warmer temperatures before AD 1000 compared to after, while reconstructed sea level was stable before AD 1000, but rose thereafter (AD 1000–1400). This finding is fundamentally inconsistent with warmer global temperatures causing sea level to rise. A possible explanation is that reconstructed global temperature (1) was systematically too high prior to AD 1000. Northern Hemisphere temperature reconstructions are generally cooler than the global average for this period (2). Lowering global temperature by 0.2 K over the period AD 500–1100 removes this discrepancy. This observation illustrates how tightly input temperatures constrain sea level computed by the semiempirical model, making the good agreement for the past millennium all the more significant.
Conclusions
We have presented a unique, high-resolution sea-level reconstruction developed using salt-marsh sediments for the last 2100 y from the US Atlantic coast. Post-AD 1000, these sea-level reconstructions are compatible with reconstructions of global temperature, assuming a linear relation between temperature and the rate of sea-level rise. This consistency mutually reinforces the credibility of the temperature and sea-level reconstructions. According to our analysis, North Carolina sea level was stable from BC 100 to AD 950. Sea level rose at a rate of 0.6 mm/y from about AD 950 to 1400 as a consequence of Medieval warmth, although there is a difference in timing when compared to other proxy sea-level records. North Carolina and other records show sea level was stable from AD 1400 until the end of the 19th century due to cooler temperatures associated with the Little Ice Age. A second increase in the rate of sea-level rise occurred around AD 1880–1920; in North Carolina the mean rate of rise was 2.1 mm/y in response to 20th century warming. This historical rate of rise was greater than any other persistent, century-scale trend during the past 2100 y.
Materials and Methods
Sea level in North Carolina was reconstructed using transfer functions relating the distribution of salt-marsh foraminifera to tidal elevation (7, 12). Application of transfer functions to samples from two cores (at sites 120 km apart) of salt-marsh sediment provided estimates of PME with uncertainties of < 0.1 m. For each core a probabilistic age-depth model (10) was developed from composite chronological results and allowed the age of any sample to be estimated with 95% confidence. In Massachusetts, plant macrofossils preserved in salt-marsh sediment overlying a glacial erratic, were dated using AMS 14C and pollen and pollution chronohorizons (Fig. S1). The modern distribution of common salt-marsh plants was used to estimate PME. Sea level was reconstructed by subtracting estimated PME from measured sample altitude. Corrections for GIA were estimated from local (13) and US Atlantic coast (15) databases of late Holocene sea-level index points. Detailed methods are presented in SI Text.
Supplementary Material
Acknowledgments.
Dana MacDonald counted Wood Island pollen. R. Gehrels provided the Nova Scotia sea-level data. We thank L. Neureither (Potsdam Institute for Climate Impact Research) for critically reviewing the modeling code and algorithm description and A. Parnell (University College Dublin) for statistical support. D. Hill (Oregon State University) and J. Feyen (NOAA) performed tidal modeling. Research was supported by National Science Foundation (NSF) grants (EAR-0951686) (to B.P.H. and J.P.D.) A.C.K. thanks an internship at the National Ocean Sciences Accelerator Mass Spectrometry, UPenn paleontology stipend, and grants from Geological Society of America and North American Micropaleontology Section. North Carolina sea-level research was funded by National Oceanic and Atmospheric Administration (NA05NOS4781182), United States Geological Survey (02ERAG0044), and NSF (EAR-0717364) grants to B.P.H. with S. Culver and R. Corbett (East Carolina University). J.P.D. (EAR0309129) and M.E.M. (ATM-0902133) acknowledge NSF support. M.V. acknowledges Academy of Finland Project 123113 and European Cooperation in Science and Technology Action ES0701. This paper is dedicated to David Swallow.
Footnotes
The authors declare no conflict of interest.
*This Direct Submission article had a prearranged editor.
This article contains supporting information online at www.pnas.org/lookup/suppl/doi:10.1073/pnas.1015619108/-/DCSupplemental.
References
- 1.Mann ME, et al. Proxy-based reconstructions of hemispheric and global surface temperature variations over the past two millennia. Proc Nat'l Acad Sci USA. 2008;105:13252–13257. doi: 10.1073/pnas.0805721105. [DOI] [PMC free article] [PubMed] [Google Scholar]
- 2.Jansen E, et al. Paleoclimate. In: Solomon S, et al., editors. Climate Change 2007: The Physical Science Basis. Contributionof Working Group I to the Fourth Assessment Report of the Intergovernmental Panel on Climate Change. New York City: Cambridge University Press; 2007. [Google Scholar]
- 3.Rahmstorf S. A semi-empirical approach to projecting future sea-level rise. Science. 2007;315:368–370. doi: 10.1126/science.1135456. [DOI] [PubMed] [Google Scholar]
- 4.Vermeer M, Rahmstorf S. Global sea level linked to global temperature. Proc Nat'l Acad Sci USA. 2009;106:21527–21532. doi: 10.1073/pnas.0907765106. [DOI] [PMC free article] [PubMed] [Google Scholar]
- 5.Horton B, Edwards R. Quantifying Holocene sea-level change using intertidal foraminifera: lessons from the British Isles. Fredericksburg, VA: Cushman Foundation for Foraminiferal Research; 2006. p. 97. [Google Scholar]
- 6.Donnelly JP, Cleary P, Newby P, Ettinger R. Coupling instrumental and geological records of sea-level change: evidence from southern New England of an increase in the rate of sea-level rise in the late 19th century. Geophys Res Lett. 2004;31:L05203. [Google Scholar]
- 7.Kemp AC, Horton BP, Culver SJ. Distribution of modern salt-marsh foraminifera in the Albemarle-Pamlico estuarine system of North Carolina, USA: Implications for sea-level research. Mar Micropaleontol. 2009;72:222–238. [Google Scholar]
- 8.Sachs HM, Webb T, Clark DR. Paleoecological transfer functions. Annu Rev Earth Pl Sc. 1977;5:159–178. [Google Scholar]
- 9.Edwards RJ. Sea level studies: low energy coasts sedimentary indicators. In: Elias SA, editor. Encyclopedia of Quaternary Science. Amsterdam: Elsevier; 2007. pp. 2994–3005. [Google Scholar]
- 10.Parnell AC, Haslett J, Allen JRM, Buck CE, Huntley B. A flexible approach to assessing synchroneity of past events using Bayesian reconstructions of sedimentation history. Quaternary Sci Rev. 2008;27:1872–1885. [Google Scholar]
- 11.Gehrels WR, et al. Onset of recent rapid sea-level rise in the western Atlantic Ocean. Quaternary Sci Rev. 2005;24:2083–2100. [Google Scholar]
- 12.Kemp AC, et al. Timing and magnitude of recent accelerated sea-level rise (North Carolina, United States) Geology. 2009;37:1035–1038. [Google Scholar]
- 13.Horton BP, et al. Holocene sea-level changes along the North Carolina Coastline and their implications for glacial isostatic adjustment models. Quaternary Sci Rev. 2009;28:1725–1736. [Google Scholar]
- 14.Peltier WR. Global sea level rise and glacial isostatic adjustment: an analysis of data from the east coast of North America. Geophys Res Lett. 1996;23:717–720. [Google Scholar]
- 15.Engelhart SE, Horton BP, Douglas BC, Peltier WR, Tornqvist TE. Spatial variability of late Holocene and 20th century sea-level rise along the Atlantic coast of the United States. Geology. 2009;37:1115–1118. [Google Scholar]
- 16.Carlin BP, Gelfand AE, Smith AFM. Hierarchical Bayesian analysis of change-point problems. Applied Statistics. 1992;41:389–405. [Google Scholar]
- 17.Tornqvist TE, Bick SJ, van der Borg K, de Jong AFM. How stable is the Mississippi Delta? Geology. 2006;34:697–700. [Google Scholar]
- 18.González JL, Törnqvist TE. A new Late Holocene sea-level record from the Mississippi Delta: evidence for a climate/sea level connection? Quaternary Sci Rev. 2009;28:1737–1749. [Google Scholar]
- 19.van de Plassche O, van der Borg K, de Jong AFM. Sea level-climate correlation during the past 1400 yr. Geology. 1998;26:319–322. [Google Scholar]
- 20.van de Plassche O, et al. Salt-marsh erosion associated with hurricane landfall in southern New England in the fifteenth and seventeenth centuries. Geology. 2006;34:829–832. [Google Scholar]
- 21.van de Plassche O, Wright AJ, van der Borg K, de Jong AFM. On the erosive trail of a 14th and 15th century hurricane in Connecticut (USA) salt marshes. Radiocarbon. 2004;46:775–784. [Google Scholar]
- 22.Gehrels WR, et al. Rapid sea-level rise in the North Atlantic Ocean since the first half of the nineteenth century. Holocene. 2006;16:949–965. [Google Scholar]
- 23.Gehrels WR, Hayward B, Newnham RM, Southall KE. A 20th century acceleration of sea-level rise in New Zealand. Geophys Res Lett. 2008;35:L02717. [Google Scholar]
- 24.Gehrels WR, Belknap DF, Black S, Newnham RM. Rapid sea-level rise in the Gulf of Maine USA since AD 1800. The Holocene. 2002;12:383–389. [Google Scholar]
- 25.Lambeck K, Anzidei M, Antonioli F, Benini A, Esposito A. Sea level in Roman time in the Central Mediterranean and implications for recent change. Earth Planet Sc Lett. 2004;224:563–575. [Google Scholar]
- 26.Sivan D, et al. Ancient coastal wells of Caesarea Maritima, Israel, an indicator for relative sea level changes during the last 2000 years. Earth Planet Sc Lett. 2004;222:315–330. [Google Scholar]
- 27.Goodwin ID, Harvey N. Subtropical sea-level history from coral microatolls in the Southern Cook Islands, since 300 AD. Mar Geol. 2008;253:14–25. [Google Scholar]
- 28.Garcia-Artola A, Cearreta A, Leorri E, Irabien MJ, Blake WH. Coastal salt-marshes as geological archives of recent sea-level changes. Geogaceta. 2009;47:109–112. (in Spanish) [Google Scholar]
- 29.Leorri E, Cearreta A, Horton BP. A foraminifera-based transfer function as a tool for sea-level reconstructions in the southern Bay of Biscay. Geobios-Lyon. 2008;41:787–797. [Google Scholar]
- 30.Leorri E, Horton BP, Cearreta A. Development of a foraminifera-based transfer function in the Basque marshes, N. Spain: implications for sea-level studies in the Bay of Biscay. Mar Geol. 2008;251:60–74. [Google Scholar]
- 31.Church JA, White NJ. A 20th century acceleration in global sea-level rise. Geophys Res Lett. 2006;33:L01602. [Google Scholar]
- 32.Jevrejeva S, Moore JC, Grinsted A, Woodworth PL. Recent global sea level acceleration started over 200 years ago? Geophys Res Lett. 2008;35:L08715. [Google Scholar]
- 33.Jevrejeva S, Grinsted A, Moore JC, Holgate S. Nonlinear trends and multiyear cycles in sea level records. J Geophys Res. 2006;111:C09012. [Google Scholar]
- 34.Woodworth PL, et al. Evidence for the accelerations of sea level on multi-decade and century time scales. Int J Climatol. 2009;29:777–789. [Google Scholar]
- 35.Yin J, Schlesinger ME, Stouffer RJ. Model projections of rapid sea-level rise on the northeast coast of the United States. Nat Geosci. 2009;2:262–266. [Google Scholar]
- 36.Bindoff NL, et al. Observations: Oceanic Climate Change and Sea Level. In Climate Change 2007: The Physical Science Basis. In: Solomon S, Qin D, Manning M, Chen Z, Marquis M, Averyt KB, Tignor M, Miller HL, editors. Contribution of Working Group I to the Fourth Assessment Report of the Intergovernmental Panel on Climate Change. Cambridge, United Kingdom, New York, NY: Cambridge University Press; 2007. [Google Scholar]
- 37.Grinsted A, Moore J, Jevrejeva S. Reconstructing sea level from paleo and projected temperatures 200 to 2100 AD. Climate Dynamics. 2009;34:461–472. [Google Scholar]
Associated Data
This section collects any data citations, data availability statements, or supplementary materials included in this article.


