

Abstract
Differentially methylated oral squamous cell carcinoma (OSCC) biomarkers, identified in-vitro and validated in well-characterized surgical specimens, have shown poor clinical correlation in cohorts with different risk profiles.
To overcome this lack of relevance we used the HumanMethylation27 BeadChip, publicly available methylation and expression array data, and Quantitative Methylation Specific PCR to uncover differential methylation in OSCC clinical samples with heterogeneous risk profiles.
A two stage-design consisting of Discovery and Prevalence screens was used to identify differential promoter methylation and deregulated pathways in patients diagnosed with OSCC and head and neck squamous cell carcinoma.
Promoter methylation of KIF1A (κ = 0.64), HOXA9 (κ = 0.60), NID2 (κ = 0.60), and EDNRB (κ = 0.60) had a moderate to substantial agreement with clinical diagnosis in the Discovery screen. HOXA9 had 68% sensitivity, 100% specificity and a 0.81 AUC. NID2 had 71% sensitivity, 100% specificity and a 0.79 AUC. In the Prevalence screen HOXA9 (κ = 0.82) and NID2 (κ = 0.80) had an almost perfect agreement with histologic diagnosis. HOXA9 had 85% sensitivity, 97% specificity and a 0.95 AUC. NID2 had 87% sensitivity, 95% specificity and a 0.91 AUC. A HOXA9 and NID2 gene panel had 94% sensitivity, 97% specificity and a 0.97 AUC. In saliva from OSCC cases and controls HOXA9 had 75% sensitivity, 53% specificity and a 0.75 AUC. NID2 had 87% sensitivity, 21% specificity and a 0.73 AUC.
This Phase I Biomarker Development Trial identified a panel of differentially methylated genes in normal and OSCC clinical samples from patients with heterogeneous risk profiles. This panel may be useful for early detection and cancer prevention studies.
Keywords: Genome-wide promoter methylation, Differential Methylation, Oral Squamous Cell Carcinoma, Biomarkers for Early Detection, Quantitative Methylation Specific PCR
Introduction
There are an estimated half a million cases of oral and oropharyngeal cancer worldwide. (1) Oral cavity mortality rates have remained unchanged or have decreased in some countries around the world from 1995 to 2005. (2) It is well established that oral cancer incidence and mortality are higher in regions where tobacco habits, in the form of chewing and/or smoking, with or without alcohol intake, are common. (3) It is also known that oral cancer cases distribution and occurrence varies by age, ethnic group, culture and life style, and level of country development. (4) For example, the Population Attributable Risk (PAR) due to the effects of tobacco and alcohol on oral cavity cancers is lower in the United States (US) than in Europe and Latin America. (5)
While incidence and mortality rates are relatively low compared to other cancers, oral cancer patients are usually diagnosed in an advanced stage, which is associated with worse prognosis and higher radio- and chemotherapy morbidity. Moreover, the oral cavity patient quality of life is disproportionately compromised, since surgical therapy can be mutilating and often has significant effects on swallowing, speech, and physical appearance. (6) Evidently, improved oral cancer prevention, early detection, diagnostic, and clinical management tools are needed to identify high risk patients, such as patients with smoking and alcohol exposures, patients without adequate access to health care, and patients with high risk lesions such as leukoplakia, which may progress to carcinoma lesions. (7)
Quantitative Methylation Specific PCR (qMSP) has been proposed as a platform to develop early detection, diagnostic, and clinical management biomarkers in Head and Neck Squamous Cell Carcinoma (HNSCC). (8–10) However, previous efforts at identifying epigenomic biomarkers in HNSCC have been limited by candidate gene or cell culture-based discovery approaches and validation technologies on well characterized pathology specimens from homogeneous cohorts, all of which has limited the clinical relevance of the results. (11–13) Numerous genes in OSCC tissues have been studied for promoter methylation status. It has also been shown that histologically normal tissue adjacent to tumors and premalignant lesions can also have high levels of methylation of some genes, suggesting that methylation is an early event in oral carcinogenesis (14). Hypermethylated genes in OSCC have been associated with alterations in proliferation, DNA repair, apoptosis, cell-cell adhesion and angiogenessis, Clinically, they have been associated with tumor aggressiveness, invasiveness and with the malignant transformation of oral epithelial dysplasia (14). Recently, our lab showed that promoter hypermethylation is present in OSCC premalignant lesions, is useful for HNSCC detection and plays a role in the development of resistance to cytotoxic chemotherapeutic agents (15–18). Other laboratories have shown that promoter methylation of genes in saliva may serve as potential biomarkers for early detection of primary and relapsing OSCC/HNSCC (19, 20).
Pharmacologic unmasking in cell lines with subsequent validation in surgical specimens has been the canonical pseudo genome-wide discovery approach used to identify differentially genes in OSCC.(21) This approach has provided a description of hypermethylated and silenced tumor suppressor genes or hypomethylated candidate proto-oncogenes, in well characterized and carefully dissected samples from, in the large part, North American patients.(22, 23) The results obtained with the pharmacologic unmasking approach in cell lines however have shown poor clinical application, probably due to pharmacologic bias and methylation changes associated to cell lines passage, as well as the high degree of cellular heterogeneity in tumor tissue and saliva samples.
The advent of high throughput genomic platforms provides the opportunity to examine novel approaches. We set out to overcome the limitations of previous methods using a novel study design in clinically defined samples from populations with different risk profiles. (24–26) We used high-density promoter methylation platforms, publicly available expression arrays, and qMSP in a Phase I Biomarker Development Trial to identify differentially methylated genes that can distinguish between OSCC/HNSCC tumor and normal tissue in study populations with different risk factors. (8, 27, 28) A novel feature of this project, which facilitates the heterogeneous risk factor approach is the two-stage design of the study. In the first stage, called the Discovery Screen, we used clinical samples obtained from Spain, a population with high OSCC risk associated to tobacco smoking and alcohol consumption. (29, 30) In the second stage, called the “Prevalence Screen”, we analyzed the promoter methylation status of the best performing hypermethylated genes identified in the Discovery Screen on DNA isolated from a separate cohort of HNSCC tumor samples from North America with well characterized histopathology. Markers that perform well in a population with a heterogeneous risk profile in a clinical setting in the Discovery screen have a higher probability of performing well in a well-characterized set of confirmed cases and controls in the Prevalence screen. This novel study design maximizes resource investment in Phase I Biomarker Development Trials (BDT) and ensures that more robust biomarkers are tested in Phase II. Bioinformatics, biostatistical and pathway analyses were used to identify relevant genes, and Quantitative Methylation Specific PCR (qMSP) was used to determine the differential methylation identified in particular genes or pathways.
Methods
Patient selection
Patients for this study were consented at hospitals in Baltimore, USA (n=143) and Madrid, Spain (n=36). Normal, premalignant and OSCC tumor tissue was collected from patients who visited the outpatient clinics of Hospital Gregorio Marañón in Madrid. OSCC tumor and adjacent tissue samples were collected at Hospital Ramon y Cajals in Madrid. Tumor and normal tissue and saliva rinses from HNSCC and healthy patients were collected at Johns Hopkins Hospital in Baltimore. Salivary rinses were obtained by rinse and gargle of 20ml saline solution. All participants signed a consent form that clearly explained the risks and benefits of the study. The study was approved by the Ethics Committee of each participating hospital, as well as by the Johns Hopkins Institutional Review Board.
Samples
Tissue samples were frozen in liquid nitrogen and stored in −80° C. The salivary rinses were centrifuged, the supernatant was discarded and DNA was isolated from the pellet. Tissue samples were shipped to our laboratory at the Head and Neck Cancer Research Division of the Department of Otolaryngology at Johns Hopkins School of Medicine. Tissue (5 mg) and saliva pellets were digested with 1% SDS and 50 µg/mL proteinase K (Boehringer Mannheim) at 48°C overnight, followed by phenol/chloroform extraction and ethanol precipitation of DNA as previously described.
Discovery Screen
Bisulfite modification of genomic DNA (2ug) was performed with EpiTect Bisulfite Kit (QIAGEN) according to the manufacturer’s protocol. We hybridized bisulfite converted DNA from normal (n=4), leukoplakia (n=4) and Oral Squamous Cell Carcinoma (OSCC) tissue (n=4) samples to the HumanMethylation27 DNA Analysis BeadChip assay, which quantitatively interrogates 27,578 CpG sites from 14,495 protein-coding gene promoters and 110 microRNA gene promoters at single-nucleotide resolution. The Infinium Methylation assay detects cytosine methylation at CpG islands based on highly multiplexed genotyping. The assay interrogates these chemically differentiated loci using two site-specific probes, one designed for the methylated locus (M bead type) and another for the unmethylated locus (U bead type). Single-base extension of the probes incorporates a labeled ddNTP, which is subsequently stained with a fluorescence reagent. A beta (β) value was used to denote the methylation level of the CpG loci using the ratio of intensities between methylated and unmethylated alleles (β value= Methylation intensity / Methylation + unmethylated intensity of the given CpG locus).
Hierarchical clustering analysis and heatmap creation
The average beta values of all probes on the Illumina Infinium arrays were subjected to log10 transformation and used to generate a heatmap based on unsupervised hierarchical clustering with Spotfire DecisionSite (Somerville, MA). This clustering was based on the unweighted average method using correlation as the similarity measure and ordering by average values. The color red was selected to represent hypermethylated genes and the color blue to represent hypomethylated genes.
Differential Methylation Bioinformatics
Bioinformatics strategies were used for background correction, normalization and data analysis of differentially methylated genomic regions between tumor, leukoplakia and normal tissue. The gene selection from the Illumina Infinium assay data was performed in a stepwise manner. An F-test was performed across all twelve samples to identify genes with a significant difference in β values between normal, leukoplakia, and malignant tissue. Since the empirical p-values were calculated genome-wide, adjustment for multiple testing was performed. Rather than using a Bonferroni correction, which is very stringent, the p-values were transformed into q-values, which are measures of significance in terms of the false discovery rate (FDR) instead of the false positive rate normally associated with p-values. (31) Q-values were computed from the empirical p-values using the Benjamin and Hochberg correction. Probes with q-values less than 0.05 were deemed statistically significant and were included in the final gene list. We then selected only those genes that showed a methylation difference of at least 0.2 between cancer and normal tissues and a beta value of at least 0.3 in cancer. All bioinformatics analyses were performed using R version 2.11.1.
Comparison to existing databases of known methylation events in cancer
The list of differentially hypermethylated genes in tumor tissue identified in the Discovery Screen was first compared against existing databases of known methylation events in cancer. (32, 33) We generated a list of genes that have been previously shown to be hypermethylated in OSCC/HNSCC and in other tumor tissues.
Cross reference of hypermethylated genes with publicly available OSCC gene expression arrays
We then searched the GEO database (NCBI) for published expression analyses, which compared favorably with our Infinium methylation assay in terms of analyzing OSCC tissues against normal oral tissues from healthy patients and not to adjacent normal oral tissues. GSE10121 hybridized 35 oral squamous cell carcinoma samples and 6 oral mucosa tissues from healthy participants to a whole-transcriptome spotted array that contains 35,035 gene-specific oligos (Human OligoSet 4.0). (34) The expression of genes identified to be hypermethylated in tumor tissue was examined for evidence of tumor down-regulation in the expression arrays and a list of genes showing both hypermethylation and down regulation was generated. (Figure 1)
Figure 1.

Flowchart of the data analysis and integration tasks performed to identify HOXA9 and NID2 as two novel hypermethylated genes in OSCC and HNSCC.
Ingenuity Pathway Analysis
Pathway and ontology analysis were performed to identify how differential methylation alters cellular networks and signaling pathways in OSCC. A list of RefSeq identifiers for hypermethylated/down-regulated genes was uploaded to the Ingenuity Pathway Analysis program (Redwood City, CA), enabling exploration of gene ontology and molecular interaction. Each uploaded gene identifier was mapped to its corresponding gene object (focus genes) in the Ingenuity Pathways Knowledge Base. Core networks were constructed for both direct and indirect interactions using default parameters, and the focus genes with the highest connectivity to other focus genes were selected as seed elements for network generation. New focus genes with high specific connectivity (overlap between the initialized network and gene’s immediate connections) were added to the growing network until the network reached a default size of 35 nodes. Non-focus genes (those that were not among our differentially methylated input list) that contained a maximum number of links to the growing network were also incorporated. The ranking score for each network was then computed by a right-tailed Fisher’s exact test as the negative log of the probability that the number of focus genes in the network is not due to random chance. Similarly, significances for functional enrichment of specific genes were also determined by the right-tailed Fisher’s exact test, using all input genes as a reference set.
Validation of in-silico findings with Quantitative Methylation Specific PCR (qMSP)
qMSP was used to validate the candidate genes identified in the Discovery Screen on a cohort of oral cavity tissue samples from non-cancer and OSCC patients from Spain and the US. Briefly, bisulfite-modified DNA was used as template for fluorescence-based real-time PCR, as previously described. (35) Fluorogenic PCR reactions were carried out in a reaction volume of 20 µL consisting of 600 nmol/L of each primer; 200 µmol/L probe; 0.75 units platinum Taq polymerase (Invitrogen); 200 µmol/L of each dATP, dCTP, dGTP, and dTTP; 200 nmol/L ROX dye reference (Invitrogen); 16.6 mmol/L ammonium sulfate; 67 mmol/L Trizma (Sigma, St. Louis, MO); 6.7 mmol/L magnesium chloride; 10 mmol/L mercaptoethanol; and 0.1% DMSO. Duplicates of three microliters (3 µL) of bisulfite-modified DNA solution were used in each real-time methylation-specific PCR (MSP) amplification reaction. Primers and probes were designed to amplify a segment of a CpG island in the promoter of genes of interest and of a reference gene, actin-B (ACTB) as previously described. Primers and probes were tested on positive (genomic methylated bisulfite converted DNA) and negative controls (genomic unmethylated bisulfite converted DNA) to ensure amplification of the desired product and non-amplification of unmethylated DNA, respectively. Primer and probe sequences and annealing temperatures are provided in Supplementary Table 1.
Amplification reactions were carried out in 384-well plates in a 7900 Sequence Detector (Perkin-Elmer Applied Biosystems, Norwalk, CT) and were analyzed by SDS 2.2.1 (Sequence Detector System; Applied Biosystems, Norwalk, CT). Thermal cycling was initiated with a first denaturation step at 95°C for 3 minutes, followed by 50 cycles of 95°C for 15 seconds and annealing temperature for 1 minute. Each plate included patient DNA samples, positive (bisulfite converted hypermethylated universal DNA standard, Zymo Research) and multiple water blanks as non-template controls. Serial dilutions (60-0.006 ng) of this DNA were used to construct a calibration curve for each plate. The relative level of methylated DNA for each gene in each sample was determined as a ratio of qMSP for the amplified gene to ACTB and then multiplied by 100 for easier tabulation. The samples were categorized as unmethylated or methylated based on detection of methylation above a threshold set for each gene. This threshold was determined using ROC curves analyzing the levels and distribution of methylation, if any, in normal tissues.
Prevalence Screen
We then analyzed the promoter methylation status of the best performing hypermethylated genes found in the Discovery Screen on DNA from a set of well-characterized HNSCC tumor samples and healthy patients. This allowed the validation of the hypermethylated genes in an independent set of tumors, as well as provided an estimation of the hypermethylation prevalence among a larger number of tumors with well-characterized pathology. Furthermore, to examine the feasibility of creating a diagnostic panel we examined the promoter methylation status of the best performing candidate tumor suppressor genes in saliva samples from HNSCC and healthy patients.
Biostatistics
To test the reliability of using QMSP results to identify tumor tissue Cohen’s kappa (κ) was used. Because there is no clear-cut ‘‘gold standard’’ for the QMSP results, equal weight was applied to promoter methylation for all genes. A κ statistic <0 would suggest poor agreement, 0 to 0.20 slight, 0.21 to 0.40 fair, 0.41 to 0.60 moderate, 0.61 to 0.80 substantial, and 0.81 to 1.00 almost perfect. Confidence intervals (CI) were calculated for the kappa statistic using the STATA command ‘‘kapci.’’ STATA uses an analytic method for simple two-by-two comparisons and a bootstrap method in the case of dichotomous variables. ROC curves were drawn to obtain sensitivity and specificity in the discovery screen and most suitable cut-off values were chosen. To measure the association between two QMSP results and tumor status the Chi-square statistic (X2) and Odds Ratios were calculated. The inverse-logit function logit−1 (x) was used to transform the QMSP results from continuous methylation values to probabilities in single predictor logistic regression models. Scatterplots, volcano plots and ROC curves were drawn to describe the results. All Biostatistics analyses were performed using Stata 11 (Texas, USA) and R 2.11.1 (www.r-project.org).
Results
Discovery Screen: Methylation progression in OSCC
The bisulfite converted DNA from normal (n=4), leukoplakia (n=4) and Oral Squamous Cell Carcinoma (OSCC) tissue (n=4) samples was hybridized to the HumanMethylation27 DNA Analysis BeadChip assay, which quantitatively interrogates 27,578 CpG sites from 14,495 protein-coding gene promoters and 110 microRNA gene promoters at single-nucleotide resolution. The average beta values of all probes were log-transformed and used to generate a heatmap based on unsupervised hierarchical clustering. The clustering of all CpG loci (p< 0.05) clearly distinguishes between methylation events in normal, leukoplakia, and oral cancer tissue. (Figure 2a). Hypomethylated genes can be seen in blue and hypermethylated genes in red. A closer examination of differential methylation in a subset of genes shows a progression to hypermethylation in OSCC samples when compared to normal and leukoplakia samples. (Figure 2b).
Figure 2.

2a. Unsupervised hierarchical clustering based on the unweighted average method using correlation as the similarity measure and ordering by average values. The color Red was selected to represent hypermethylated genes and the color Green to represent hypomethylated genes. Normal mucosa, leukoplakia, and oral squamous cell carcinoma samples were examined using the HumanMethylation27 DNA Analysis BeadChip assay, which interrogates 27,578 CpG sites from 14,495 protein-coding gene promoters and 110 micro-RNA gene promoters. 2b. A closer examination of differential methylation in a subset of genes show a progression to hypermethylation in OSCC samples when compared to normal and leukoplakia samples. 2c. Venn diagrams show the overlaps of significantly hypermethylated genes in cancer when compared to normal tissue, genes hypermethylated in leukoplakia when compared to normal mucosa, and hypermethylated genes in tumor when compared to leukoplakia tissue. 2d. Venn diagrams show the overlaps of significantly hypomethylated genes in tumor when compared to normal samples, genes hypomethylated in leukoplakia when compared to normal tissue, and genes hypomethylated in leukoplakia when compared to normal tissue. 2e. The progression of differential methylation events between the three groups of tissue examined with the Infinium methylation assay, normal oral mucosa, leukoplakia and OSCC tissues, is depicted. The number of potential tumor suppressor genes and potential proto-oncogenes are shown for every two-way comparison between the three histology groups. 2f. A bar graph showing the chromosomal frequency of hypermethylated genes in OSCC when compared to normal mucosa. The majority of the 301 hypermethylated genes are clustered from chromosome 1 to chromosome 11. 2g. A bar graph showing the chromosomal frequency of hypomethylated genes in OSCC when compared to normal mucosa. The majority of the 62 hypomethylated genes are clustered between chromosome 8 and chromosome 19.
The bioinformatics strategy used to analyze the Illumina data identified a progression of differential methylation events between the three tissue samples groups examined with the Infinium methylation assay. We observed 301 potential tumor suppressor genes that were significantly hypermethylated in cancer when compared to normal tissue, 92 genes hypermethylated in leukoplakia when compared to normal mucosa, and 143 hypermethylated genes in tumor when compared to leukoplakia tissue. There were 86 hypermethylated genes overlapping the 143 tumor/leukoplakia and 301 tumor/normal differentially methylated genes. (Figure 2c) We also observed 62 potential proto-oncogenes hypomethylated in tumor when compared to normal samples, 168 genes hypomethylated in leukoplakia when compared to normal tissue and 47 genes hypomethylated in leukoplakia when compared to tumor tissue. Ten genes overlapped the 62 cancer/normal and the 47 cancer/leukoplakia differentially methylated genes. Four genes overlapped the 62 cancer/normal and the 168 leukoplakia/normal differentially methylated genes. (Figure 2d) In addition, 92 potential tumor suppressor genes were hypermethylated in leukoplakia when compared to normal tissue and 168 potential proto-oncogenes were hypomethylated in leukoplakia when compared to normal tissue. Furthermore, 143 potential tumor suppressor genes were hypermethylated in cancer when compared to leukoplakia tissue and 47 potential proto-oncogenes were hypomethylated in leukoplakia when compared to normal tissue. (Figure 2e)
We then examined the chromosomal distribution of hypermethylated (Figure 2f) and hypomethylated (Figure 2g) genes in OSCC. There is a non-stochastic distribution for hypermethylation and hypomethylation events, which may be a reflection of both, driving oncogenic transformative events and phenotypic changes resultant from the oncogenic transformation. Most of the 301 hypermethylated genes (Supplementary Table 2a) are clustered from chromosome 1 to chromosome 11, while the majority of the 62 hypomethylated (Supplementary Table 2b) genes are clustered between chromosome 8 and chromosome 19.
Gene ontology and Ingenuity Pathway Analysis of hypermethylated genes
The 301 hypermethylated differentially genes were analyzed for their biological significance using Geneontology (Spotfire®) and Ingenuity Pathway Analysis (IPA®). The differentially hypermethylated genes were found to be associated with pathways intimately related to oncogenic transformation: cell adhesion; cell proliferation; growth regulation; and cell death. (p<0.05)
The top associated network functions in IPA shown in Supplementary Table 3 are pathways directly related to tumorigenesis: cell signaling and interaction, nucleic acid metabolism, DNA replication, recombination and repair, cellular assembly organization, function and maintenance.
Analysis of correlation of promoter hypermethylation with gene expression
From the list of 301 hypermethylated genes in cancer we were able to find expression values for 275 of them in the expression arrays selected for methylation-transcriptional silencing analysis, 140 of which were downregulated. A volcano plot illustrating the correlation between the expression array results and our list of hypermethylated and hypomethylated genes is shown in Figure 3a. A Venn diagram showing the relationship of down regulated genes in the expression array to the hypermethylated gene list is depicted in Figure 3b
Figure 3.

Figure 3a. Volcano plot of p-values versus effect size in the expression arrays. The log10 of the Fold Change P value of tumor vs. control from the 9,441 upregulated genes are plotted to the right of the 0 effect size value in center and log10 of the Fold Change P value of tumor vs. control from the 8,356 downregulated genes are plotted to the left. The 301 significantly hyper methylated genes in OSCC are in red: 140 genes are plotted to the left and 161 are plotted to the right of ) effect size in the center. The Y axis represents the log10 of the Fold Change P value of tumor vs. control. The X axis represents the log2 fold change of tumor vs. control. Figure 3b. A Venn diagram shows the overlapping 140 genes, significantly hypermethylated in the methylation platforms and significantly downregulated in the expression arrays.
Comparison to existing databases of known methylation events in cancer
We generated a list of genes that have been previously shown to be hypermethylated in OSCC/HNSCC and in other tumor tissues.
Target gene selection
Using multiple selection criteria we choose eight genes to validate on OSCC and normal oral mucosa tissue samples. The eight genes were among the 140 hypermethylated genes identified in the Discovery Screen that were also downregulated in the public expression database we examined for OSCC. Four of those genes (EDNRB, HOXA9, GATA4, and NID2) were identified as hypermethylated in non-OSCC/HNSCC tumor tissues in a Pubmed search (36–40). Another four genes (MCAM, KIF1A, DCC, CALCA) were also found to be hypermethylated in existing databases of known methylation events in cancer (17, 18, 41). Hypermethylation of EDNRB, KIF1A, and DCC has been previously shown to be associated with HNSCC histology. We thus chose these genes as benchmarks against which we could evaluate our genomic approach. CALCA, HOXA9, GATA4, and NID2 had never been shown to be hypermethylated in OSCC.
Promoter methylation association with oral cavity malignancy
Differential promoter methylation status was confirmed with qMSP in the Discovery screen. The Discovery screen cohort consisted of 24 OSCC samples and 12 normal oral cavity mucosa tissues obtained from the Madrid OSCC study. Six out of the eight genes, EDNRB, HOXA9, GATA4, NID2, KIF1A, DCC show differential methylation between cases and controls (Figure 4). The promoter methylation status of the remainder two genes, CALCA and MCAM, however did not seem to differ between tumor tissue and normal mucosa.
Figure 4.
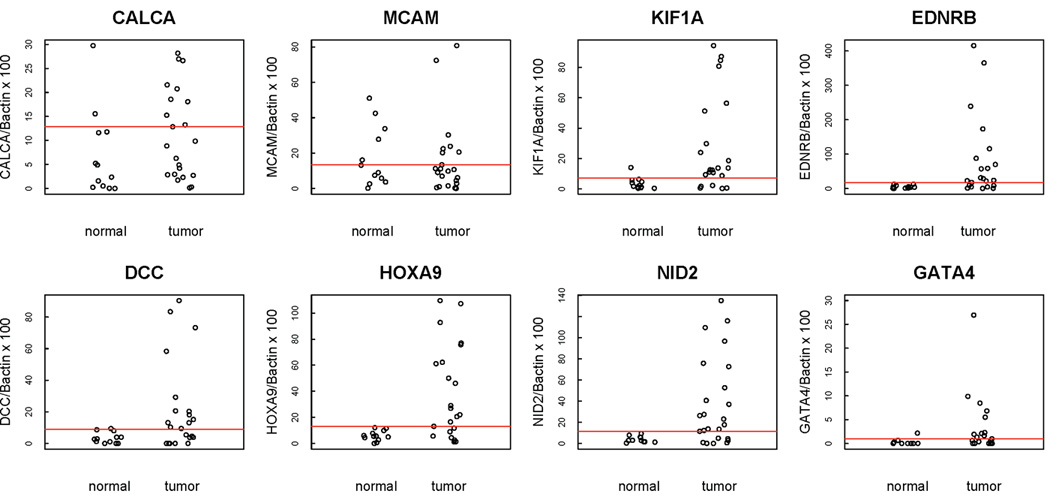
Scatterplots of quantitative MSP analysis of candidate genes promoters in the Discovery screen cohort, which consisted of 24 OSCC samples and 12 normal oral cavity mucosa tissues. The relative level of methylated DNA for each gene in each sample was determined as a ratio of MSP for the amplified gene to ACTB and then multiplied by 100 [(average value of duplicates of gene of interest / average value of duplicates of ACTB) × 100] for EDNRB, HOXA9, GATA4 NID2, MCAM, KIF1A, DCC, CALCA. Red line denotes cutoff value.
Promoter methylation of KIF1A (κ = 0.64), HOXA9 (κ = 0.60), NID2 (κ = 0.60), and EDNRB (κ = 0.60) had a moderate to substantial agreement with clinical diagnosis in the Discovery screen. The fur of them also had a percentage agreement equal to or greater than 79% (Table 1)
Table 1.
Kappa statistic (κ) of inter-classification agreement, 95% confidence intervals, and agreement percentage between classification of samples by promoter methylation of EDNRB, HOXA9, GATA4, NID2, MCAM, KIF1A, DCC, CALCA and by clinical diagnosis (Discovery Screen - n=36) and by histology (Prevalence Screen - n=92).
| Variable | Kappa coefficient |
|
|---|---|---|
| κ (95% CI) |
Percentage agreement (%) |
|
| Discovery Screen | ||
| HOXA9 | 0.60 (0.36, 0.84) | 79 |
| NID2 | 0.60 (0.36, 0.84) | 80 |
| GATA4 | 0.37 (0.09, 0.65) | 67 |
| KIF1A | 0.64 (0.39, 0.89) | 82 |
| EDNRB | 0.60 (0.36, 0.84) | 79 |
| DCC | 0.44 (0.18, 0.70) | 71 |
| MCAM | −0.12 (−0.42, 0.18) | 41 |
| CALCA | 0.24 (−0.02, 0.51) | 59 |
| Prevalence Screen | ||
| HOXA9 | 0.82 (0.70, 0.94) | 91 |
| NID2 | 0.80 (0.68, 0.92) | 90 |
Sensitivity, specificity, AUC, and methylation cut-off values for each of the genes evaluated in the Discovery Screen are shown in Table 2. Of the four candidate genes that had an AUC value equal to or higher than 0.75, only NID2 and HOXA9 had 100% specificity and sensitivity higher than 70%. We selected these two genes for further testing with the Prevalence Screen.
Table 2.
Predictive accuracy of EDNRB, HOXA9, GATA4, NID2, MCAM, KIF1A, DCC, CALCA with oral squamous cell carcinoma. Discovery Screen (n=36); Prevalence Screen (n=92)
| Predictor | Sensitivity % |
Specificity % |
AUC | Methylation Cutoff value |
|---|---|---|---|---|
| Discovery Screen | ||||
| HOXA9 | 68 | 100 | 0.81 | 13.11 |
| NID2 | 71 | 100 | 0.79 | 11.48 |
| GATA4 | 57 | 89 | 0.72 | 0.96 |
| KIF1A | 77 | 92 | 0.79 | 7.14 |
| EDNRB | 68 | 100 | 0.83 | 17.42 |
| DCC | 55 | 92 | 0.74 | 9.04 |
| MCAM | 36 | 58 | 0.45 | 13.44 |
| CALCA | 46 | 83 | 0.67 | 12.85 |
| Prevalence Screen | ||||
| HOXA9 | 85 | 97 | 0.91 | 13.11 |
| NID2 | 87 | 95 | 0.92 | 11.48 |
| HOXA9 and NID2 | 94 | 97 | 0.97 | * |
Classified positive (+) if predicted probability for positive outcome (tumor) >= than 0.5
Prevalence Screen
We examined HOXA9 and NID2 promoter methylation status in 55 HNSCC tumor tissue samples and 37 normal tissue samples obtained from uvulopharyngopalatoplasty (UPPP) procedures performed in non-cancer patients. Minimal or no promoter methylation of HOXA9 and NID2 was observed in the normal oral cavity mucosa samples, while varying degrees of hypermethylation were present in the OSCC samples (Figure 5a).
Figure 5.

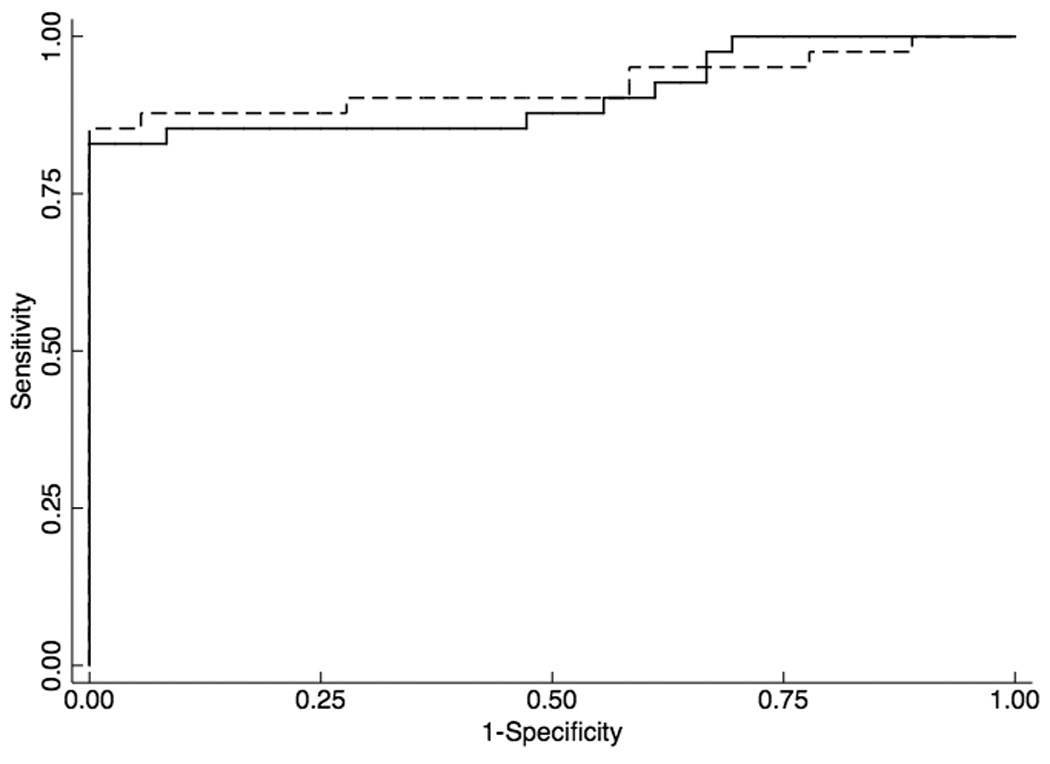
Figure 5a. Scatterplots of quantitative MSP analysis of candidate genes promoters in the Prevalence screen cohort, which consisted of 55 HNSCC tumor tissue samples and 37 normal tissue samples obtained from uvulopharyngopalatoplasty (UPPP) procedures performed in non-cancer patients. The relative level of methylated DNA for each gene in each sample was determined as a ratio of MSP for the amplified gene to ACTB and then multiplied by 100 [(average value of duplicates of gene of interest / average value of duplicates of ACTB) × 100] for, HOXA9 and NID2. Red line denotes cutoff value. Figure 5b. Receiver Operator Characteristics (ROC) curve of HOXA9 (solid line) and NID2 (dashed line) methylation in a HNSCC prevalence cohort (n=92).
HOXA9 (κ =0.82; 95% CI, 0.70, 0.94) and NID2 (κ =0.80; 95% CI, 0.68, 0.92) had an almost perfect agreement with histologic diagnosis in the Prevalence Screen (Table 1). ROC analyses using the cut-off values optimized for the Discovery screen revealed that HOXA9 had 85% sensitivity, 97% specificity and a 0.95 AUC. NID2 had 87% sensitivity, 95% specificity and a 0.91 AUC (Figure 5b). A HOXA9 and NID2 gene panel had 94% sensitivity, 97% specificity and a 0.97 AUC (Table 2)
Diagnostic panel in saliva – Oral and oropharyngeal squamous cell carcinoma
To test the feasibility of creating a diagnostic panel in saliva we examined the promoter methylation status of HOXA2 and NID2 in saliva samples from 16 patients with OSCC, 16 patients with oropharyngeal squamous cell carcinoma (OPSCC) and saliva samples from 19 non-cancer patients. Methylation of HOXA9 and NID2 promoters of the 51 saliva samples can be seen in Supplementary Figure 1a. Promoter methylation of NID2 (κ= 0.55) and HOXA9 (κ= 0.52) had a moderate agreement with histologic diagnosis. (Table 3)
Table 3.
Kappa statistic (κ) of inter-classification agreement, 95% confidence intervals, and agreement percentage between sample classification by promoter methylation of HOXA9 and NID2 and by histology on head and neck cancer saliva samples. (n=51)
| Variable | Kappa coefficient |
|
|---|---|---|
| κ (95% CI) |
Percentage agreement (%) |
|
| Oral and oropharyngeal cancer | ||
| HOXA9 | 0.52 (−0.12, 0.42) | 59 |
| NID2 | 0.55 (−0.18, 0.37) | 59 |
| Oral cancer | ||
| HOXA9 | 0.21 (−0.11, 0.52) | 60 |
| NID2 | 0.23 (−0.03, 0.49) | 60 |
ROC analyses of the Prevalence Screen samples using the methylation cut-off values optimized for the Discovery Screen revealed that HOXA9 had a sensitivity of 63%, a specificity of 53% and an AUC of 0.65. NID2 had a sensitivity of 72%, a specificity of 21% and an AUC of 0.57. (Table 4)
Table 4.
Predictive accuracy of HOXA9 and NID2 on head and neck cancer saliva samples. (n=51)
| Predictor | Sensitivity % |
Specificity % |
AUC | Methylation Cutoff value |
|---|---|---|---|---|
| Oral and oropharyngeal cancer (n=51) | ||||
| HOXA9 | 63 | 53 | 0.65 | 13.11 |
| NID2 | 72 | 21 | 0.57 | 11.48 |
| Oral cancer (n=35) | ||||
| HOXA9 | 75 | 53 | 0.75 | 13.11 |
| NID2 | 87 | 21 | 0.73 | 11.48 |
| HOXA9 and | 50 | 90 | 0.75 | * |
| NID2 | ||||
Classified positive (+) if predicted probability for positive outcome (tumor) >= than 0.5
Diagnostic panel in saliva – Oral squamous cell carcinoma
We then examined the use of promoter methylation status of HOXA2 and NID2 for cancer detection in saliva samples from 16 patients with OSCC and saliva samples from 19 non-cancer patients. Methylation of HOXA9 and NID2 promoters of the 35 saliva samples can be seen in Supplementary Figure 1b. Promoter methylation of NID2 (κ= 0.23) and HOXA9 (κ= 0.21) had a fair agreement with histologic diagnosis. (Table 3). ROC analyses using the cut-off values optimized for the discovery screen revealed that HOXA9 had a sensitivity of 75%, a specificity of 53% and an AUC of 0.75. NID2 had a sensitivity of 87%, a specificity of 21% and an AUC of 0.73. A panel of HOXA9 and NID2 had a sensitivity of 50%, a specificity of 90% and an AUC of 0.77. (Table 4)
The numbers of cancer/non-cancer patients, and unmethylated/methylated samples in each category for the Discovery, Prevalence and Saliva screens are described in Supplementary Table 4. The table also describes the thresholds of promoter methylation levels (cut-off levels). Supplementary Table 5 shows the summary statistics for HOXA9 and NID2 promoter methylation values in tissues and saliva samples.
Discussion
To our knowledge this is the first study that utilizes an unbiased genome-wide DNA methylation platform to uncover differentially methylated genes in OSCC. We successfully implemented a novel approach that combines high-density promoter methylation platforms, together with publicly available methylation and gene expression array data, to identify novel hypermethylated genes in OSCC and HNSCC. These candidate genes can be used in diagnostic panels for early detection of OSCC and HNSCC in tissue and saliva from patients from countries with different PAR due to tobacco and alcohol use.
We used clinical rather than pathological characterization of our samples in the Discovery Screen and well characterized surgical samples in the Prevalence screen. By testing our candidate genes in samples from populations with different risk profiles we aimed to increase their clinical usefulness to both surgical and dental practitioners. (See Supplementary Table 4 for a description of cancer/non-cancer patients, and unmethylated/methylated samples described in each category.)
Our results suggest that patient heterogeneity in PAR to the two main risk factors for OSCC strengthens this molecular study, and may lead to a better reproducibility of the results in other populations. The focus of this study was not, however, to explore the potential associations of the novel hypermethylated genes we identified in this study with tobacco and alcohol consumption. We first wanted to establish the usefulness of using clinical samples from OSCC patients with heterogeneous risk profiles to identify hypermethylated genes that could distinguish between normal and tumor samples in Phase I Biomarker Development studies, utilizing unbiased genome-wide arrays.
Precancerous lesions of the upper aerodigestive tract include leukoplakia, erythroplakia and leukoerythroplakia. These are clinically defined lesions that have a higher degree of oncogenic risk when compared with normal oral mucosa. When these lesions show evidence of cellular atypia without evidence of invasion, they are defined as dysplastic. The presence of dysplasia increases the oncogenic risk of these lesions. Our focus in this project was to identify markers that may be useful for early diagnosis in populations with different risk profiles, and thus our interest in using samples from Europe in the Discovery screen and from North America in the Prevalence screen.
The significant differentially hypermethylated genes identified by our approach were found to be associated with oncogenic transformation pathways and cellular functions that are de-regulated in cancer: The changes identified by pathway and gene ontology analysis underlie the progressive acquisition of a malignant phenotype in OSCC progression, which should be looked into utilizing a pathway driven approach that is beyond the scope of this manuscript.
The heatmap revealed differential DNA methylation progression, distinguishing methylation or de-methylation events unique to each tissue type: normal, leukoplakia and tumor. Our integrative approach identified HOXA9 and NID2 as novel differentially methylated genes in OSCC in the Discovery Screen. These genes then proved to have significantly higher methylation levels in tumor than normal mucosa in the Prevalence screen, as evidenced by ROC analysis of HNSCC samples. This finding may find clinical applicability in OSCC/HNSCC resection margin assessment and in situations when an OSCC/HNSCC biopsy is non - conclusive such as in post chemo-radiation scenarios.
The evaluation of methylation of HOXA9 and NID2 in separate cohorts of salivary rinses from non-cancer individuals and patients with OSCC revealed high specificity values limited sensitivity, and an AUC of 0.77 for a panel of both genes. These results favorably compare to previous hypermethylated markers evaluated in saliva. (17) The fact that we observed much better sensitivity and AUC results in saliva from OSCC patients compared with saliva from OPSCC patients might result from two possible causes: the first may be due to the different risk factors associated with OSCC and OPSCC. A large proportion of OPSCC are HPV related as opposed to OSCC, which are smoking and alcohol related. It might very well be that viral related tumors have different patterns of methylation motifs than chemical related tumors. Another plausible cause is that saliva does not bathe the oropharynx in the same extent as it does the oral cavity and thus there is less representation of tumor tissue cells in the saliva compartment.
The functional role of NID2 and HOXA9 has not been investigated in OSCC/HNSCC. Nidogens are believed to connect laminin and collagen IV networks, hence stabilizing the basement membrane structure. Nidogens are also important for cell adhesion, as they establish contacts with various cellular integrins (36). Loss of nidogen expression in OSCC may thus favor invasion and metastasis of tumor cells by loosening cell interaction with basal membrane and by weakening the strength of the basement membrane itself.
Functional studies have revealed that loss of HOXA9 promotes mammary epithelial cell growth and survival, as well as altered tissue morphogenesis. Restoring HOXA9 expression represses growth and survival and inhibits the malignant phenotype of breast cancer cells in culture and in xenograft mouse models. HOXA9 has been shown to restrict breast tumor behavior by directly modulating the expression of BRCA1, a DNA repair gene (38). Therefore HOXA9 hypermethylation may lead to diminished DNA repair capacity in OSCC/HNSCC, thus increasing cancer risk particularly in those patients that smoke tobacco, which has been shown to lead to the formation of oncogenic DNA-PAH adducts (42).
We used the two most common statistical approaches utilized in biomarker studies: modeling disease risk with logistic regression models and evaluated biomarker performance by measuring sensitivity, specificity, ROC and the AUC. (43) We performed logistic regression modeling with one predictor to draw the predictive probability plots for each gene in the Discovery screen, the Prevalence screen, and the saliva screens. Graphical expression of the logistic regression, Pr (case=1) = logit −1 (b0 + b1 x methylation), with data overlain can be seen in Supplementary Figure 2(a–d). The predictor methylation is the QMSP value for each case (1) and each control (0). Cutoff methylation values for each gene are shown by vertical dotted line. The classification performance for HOXA9 and NID2 in both, HNSCC tissue and OSCC saliva were highly satisfactory and the best published so far for hypermethylated biomarkers in HNSCC tissue and OSCC saliva, respectively.
The non-stochastic chromosomal location of hypermethylated and hypomethylated genes in the comparison between normal and OSCC tissue, as well as the similar comparisons with leukoplakia tissue, also deserves further research, which is beyond the context of this manuscript. The chromosomal location of the significant differential methylation events can be utilized to unravel the interplay between genetic and differential methylation in the progression from normal to OSCC tissue, contribute to the identification of novel therapeutic strategies for this malignancy, and help us understand whether OSCC exhibits oncogene addiction, (44, 45) and/or network/pathway addiction. This multi-dimensional knowledge may provide opportunities for the diagnosis of premalignant squamous lesions, and for the development of novel molecular-targeted strategies for the prevention and treatment of OSCC. (46)
In sum, the preliminary results suggest HOXA9 and NID2 are promising OSCC biomarkers that should be studied on tissue, saliva and serum from larger cohorts, as we move forward. These OSCC biomarkers may be useful in oral cancer prevention, early detection, diagnostic, and clinical management studies that target high risk patients, patients without adequate access to health care, and patients with high risk lesions such as leukoplakia, which may progress to carcinoma lesions. Our results in also suggest that a Phase I Biomarker development trial can be performed with a small number of genome-wide methylation arrays and subsequent validation in larger independent sample sets. A major feature facilitating our approach is the two-stage design of the study, which buffers the impact of sample-to-sample variance by using experimental and publicly available data sets. The two-stage design provides a sensitive approach for differential methylation and deregulated pathway detection in OSCC, while dramatically lowering the overall cost of a Phase I Biomarker development project. Resources can then be utilized on the validation of the initial findings in larger number of samples from independent cohorts.
Supplementary Material
Acknowledgements
Financial support: This research was supported in part by the following grant awards: National Cancer Institute (NCI) Early Detection Research Network grant U01 CA84986, an NCI Supplement to Promote Diversity Award to U01 CA84986, a National Institute of Dental and Craniofacial Research (NIDCR) and NIH Specialized Program of Research Excellence grant (SPORE) P50DE019032 and NIDCR grant RC2 DE20957. The funding agencies had no role in the design of the study, data collection or analysis, the interpretation of the results, the preparation of the manuscript, or the decision to submit the manuscript for publication.
E. Soudry is recipient of a fellowship grant from the American Physicians Fellowship for Medicine in Israel.
This research used a web database application provided by Research Information Technology Systems (RITS) - https://www.rits.onc.jhmi.edu/
Footnotes
Disclosure of Potential Conflicts of Interest: D. Sidransky owns Oncomethylome Sciences, SA stock, which is subject to certain restrictions under University policy. D. Sidransky is a paid consultant to Oncomethylome Sciences, SA, and is a paid member of the company's Scientific Advisory Board. J.A. Califano is the Director of Research of the Milton J. Dance Head and Neck Endowment. The terms of this arrangement are being managed by the Johns Hopkins University in accordance with its conflict of interest policies.
References
- 1.Warnakulasuriya S. Global epidemiology of oral and oropharyngeal cancer. Oral Oncol. 2009 Apr-May;45(4–5):309–316. doi: 10.1016/j.oraloncology.2008.06.002. [DOI] [PubMed] [Google Scholar]
- 2.Yako-Suketomo H, Matsuda T. Comparison of time trends in lip, oral cavity and pharynx cancer mortality (1990–2006) between countries based on the WHO mortality database. Jpn J Clin Oncol. Nov;40(11):1118–1119. doi: 10.1093/jjco/hyq202. [DOI] [PubMed] [Google Scholar]
- 3.Goldstein BY, Chang SC, Hashibe M, La Vecchia C, Zhang ZF. Alcohol consumption and cancers of the oral cavity and pharynx from 1988 to 2009: an update. Eur J Cancer Prev. Nov;19(6):431–465. doi: 10.1097/CEJ.0b013e32833d936d. [DOI] [PMC free article] [PubMed] [Google Scholar]
- 4.Zini A, Czerninski R, Sgan-Cohen HD. Oral cancer over four decades: epidemiology, trends, histology, and survival by anatomical sites. J Oral Pathol Med. Apr;39(4):299–305. doi: 10.1111/j.1600-0714.2009.00845.x. [DOI] [PubMed] [Google Scholar]
- 5.Hashibe M, Brennan P, Chuang SC, Boccia S, Castellsague X, Chen C, et al. Interaction between tobacco and alcohol use and the risk of head and neck cancer: pooled analysis in the International Head and Neck Cancer Epidemiology Consortium. Cancer Epidemiol Biomarkers Prev. 2009 Feb;18(2):541–550. doi: 10.1158/1055-9965.EPI-08-0347. [DOI] [PMC free article] [PubMed] [Google Scholar]
- 6.Kreeft A, Tan IB, van den Brekel MW, Hilgers FJ, Balm AJ. The surgical dilemma of 'functional inoperability' in oral and oropharyngeal cancer: current consensus on operability with regard to functional results. Clin Otolaryngol. 2009 Apr;34(2):140–146. doi: 10.1111/j.1749-4486.2009.01884.x. [DOI] [PubMed] [Google Scholar]
- 7.Glazer CA, Chang SS, Ha PK, Califano JA. Applying the molecular biology and epigenetics of head and neck cancer in everyday clinical practice. Oral Oncol. 2009 Apr-May;45(4–5):440–446. doi: 10.1016/j.oraloncology.2008.05.013. [DOI] [PubMed] [Google Scholar]
- 8.Kagan J, Srivastava S, Barker PE, Belinsky SA, Cairns P. Towards Clinical Application of Methylated DNA Sequences as Cancer Biomarkers: A Joint NCI's EDRN and NIST Workshop on Standards, Methods, Assays, Reagents and Tools. Cancer Res. 2007 May 15;67(10):4545–4549. doi: 10.1158/0008-5472.CAN-06-2888. [DOI] [PubMed] [Google Scholar]
- 9.Hudson TJ, Anderson W, Artez A, Barker AD, Bell C, Bernabe RR, et al. International network of cancer genome projects. Nature. Apr 15;464(7291):993–998. doi: 10.1038/nature08987. [DOI] [PMC free article] [PubMed] [Google Scholar]
- 10.Ha PK, Califano JA. Promoter methylation and inactivation of tumour-suppressor genes in oral squamous-cell carcinoma. Lancet Oncol. 2006 Jan;7(1):77–82. doi: 10.1016/S1470-2045(05)70540-4. [DOI] [PubMed] [Google Scholar]
- 11.Smith IM, Glazer CA, Mithani SK, Ochs MF, Sun W, Bhan S, et al. Coordinated activation of candidate proto-oncogenes and cancer testes antigens via promoter demethylation in head and neck cancer and lung cancer. PLoS One. 2009;4(3):e4961. doi: 10.1371/journal.pone.0004961. [DOI] [PMC free article] [PubMed] [Google Scholar]
- 12.Glazer CA, Smith IM, Ochs MF, Begum S, Westra W, Chang SS, et al. Integrative discovery of epigenetically derepressed cancer testis antigens in NSCLC. PLoS One. 2009;4(12):e8189. doi: 10.1371/journal.pone.0008189. [DOI] [PMC free article] [PubMed] [Google Scholar]
- 13.Rosas SL, Koch W, da Costa Carvalho MG, Wu L, Califano J, Westra W, et al. Promoter hypermethylation patterns of p16, O6-methylguanine-DNA-methyltransferase, and death-associated protein kinase in tumors and saliva of head and neck cancer patients. Cancer Res. 2001 Feb 1;61(3):939–942. [PubMed] [Google Scholar]
- 14.Shaw R. The epigenetics of oral cancer. Int J Oral Maxillofac Surg. 2006 Feb;35(2):101–108. doi: 10.1016/j.ijom.2005.06.014. [DOI] [PubMed] [Google Scholar]
- 15.Carvalho AL, Jeronimo C, Kim MM, Henrique R, Zhang Z, Hoque MO, et al. Evaluation of promoter hypermethylation detection in body fluids as a screening/diagnosis tool for head and neck squamous cell carcinoma. Clin Cancer Res. 2008 Jan 1;14(1):97–107. doi: 10.1158/1078-0432.CCR-07-0722. [DOI] [PubMed] [Google Scholar]
- 16.Chang X, Monitto CL, Demokan S, Kim MS, Chang SS, Zhong X, et al. Identification of hypermethylated genes associated with cisplatin resistance in human cancers. Cancer Res. Apr 1;70(7):2870–2879. doi: 10.1158/0008-5472.CAN-09-3427. [DOI] [PMC free article] [PubMed] [Google Scholar]
- 17.Demokan S, Chang X, Chuang A, Mydlarz WK, Kaur J, Huang P, et al. KIF1A and EDNRB are differentially methylated in primary HNSCC and salivary rinses. Int J Cancer. Nov 15;127(10):2351–2359. doi: 10.1002/ijc.25248. [DOI] [PMC free article] [PubMed] [Google Scholar]
- 18.Pattani KM, Zhang Z, Demokan S, Glazer C, Loyo M, Goodman S, et al. Endothelin receptor type B gene promoter hypermethylation in salivary rinses is independently associated with risk of oral cavity cancer and premalignancy. Cancer Prev Res (Phila) Sep;3(9):1093–1103. doi: 10.1158/1940-6207.CAPR-10-0115. [DOI] [PMC free article] [PubMed] [Google Scholar]
- 19.Righini CA, de Fraipont F, Timsit JF, Faure C, Brambilla E, Reyt E, et al. Tumor-specific methylation in saliva: a promising biomarker for early detection of head and neck cancer recurrence. Clin Cancer Res. 2007 Feb 15;13(4):1179–1185. doi: 10.1158/1078-0432.CCR-06-2027. [DOI] [PubMed] [Google Scholar]
- 20.Viet CT, Schmidt BL. Methylation array analysis of preoperative and postoperative saliva DNA in oral cancer patients. Cancer Epidemiol Biomarkers Prev. 2008 Dec;17(12):3603–3611. doi: 10.1158/1055-9965.EPI-08-0507. [DOI] [PubMed] [Google Scholar]
- 21.Yamashita K, Dai T, Dai Y, Yamamoto F, Perucho M. Genetics supersedes epigenetics in colon cancer phenotype. Cancer Cell. 2003 Aug;4(2):121–131. doi: 10.1016/s1535-6108(03)00190-9. [DOI] [PubMed] [Google Scholar]
- 22.Marsit CJ, Christensen BC, Houseman EA, Karagas MR, Wrensch MR, Yeh RF, et al. Epigenetic profiling reveals etiologically distinct patterns of DNA methylation in head and neck squamous cell carcinoma. Carcinogenesis. 2009 Mar;30(3):416–422. doi: 10.1093/carcin/bgp006. [DOI] [PMC free article] [PubMed] [Google Scholar]
- 23.Smith IM, Mydlarz WK, Mithani SK, Califano JA. DNA global hypomethylation in squamous cell head and neck cancer associated with smoking, alcohol consumption and stage. Int J Cancer. 2007 Oct 15;121(8):1724–1728. doi: 10.1002/ijc.22889. [DOI] [PubMed] [Google Scholar]
- 24.Hawkins RD, Hon GC, Ren B. Next-generation genomics: an integrative approach. Nat Rev Genet. Jun 8;11(7):476–486. doi: 10.1038/nrg2795. [DOI] [PMC free article] [PubMed] [Google Scholar]
- 25.Khachatryan V, Sirunyan AM, Tumasyan A, Adam W, Bergauer T, Dragicevic M, et al. First measurement of Bose-Einstein correlations in proton-proton collisions at radicals=0.9 and 2.36 TeV at the LHC. Phys Rev Lett. Jul 16;105(3):032001. doi: 10.1103/PhysRevLett.105.032001. [DOI] [PubMed] [Google Scholar]
- 26.Hawkins RD, Hon GC, Lee LK, Ngo Q, Lister R, Pelizzola M, et al. Distinct epigenomic landscapes of pluripotent and lineage-committed human cells. Cell Stem Cell. May 7;6(5):479–491. doi: 10.1016/j.stem.2010.03.018. [DOI] [PMC free article] [PubMed] [Google Scholar]
- 27.Pepe MS, Etzioni R, Feng Z, Potter JD, Thompson ML, Thornquist M, et al. Phases of biomarker development for early detection of cancer. J Natl Cancer Inst. 2001 Jul 18;93(14):1054–1061. doi: 10.1093/jnci/93.14.1054. [DOI] [PubMed] [Google Scholar]
- 28.Srivastava S. Cancer biomarker discovery and development in gastrointestinal cancers: early detection research network-a collaborative approach. Gastrointest Cancer Res. 2007;1 4 Suppl 2:S60–S63. [PMC free article] [PubMed] [Google Scholar]
- 29.Moreno-Lopez LA, Esparza-Gomez GC, Gonzalez-Navarro A, Cerero-Lapiedra R, Gonzalez-Hernandez MJ, Dominguez-Rojas V. Risk of oral cancer associated with tobacco smoking, alcohol consumption and oral hygiene: a case-control study in Madrid, Spain. Oral Oncol. 2000 Mar;36(2):170–174. doi: 10.1016/s1368-8375(99)00084-6. [DOI] [PubMed] [Google Scholar]
- 30.Varela-Lema L, Ruano-Ravina A, Juiz Crespo MA, Barros-Dios JM. Tobacco consumption and oral and pharyngeal cancer in a Spanish male population. Cancer Lett. Feb 1;288(1):28–35. doi: 10.1016/j.canlet.2009.06.015. [DOI] [PubMed] [Google Scholar]
- 31.Storey JD, Tibshirani R. Statistical significance for genomewide studies. Proc Natl Acad Sci U S A. 2003 Aug 5;100(16):9440–9445. doi: 10.1073/pnas.1530509100. [DOI] [PMC free article] [PubMed] [Google Scholar]
- 32.Fang YC, Huang HC, Juan HF. MeInfoText: associated gene methylation and cancer information from text mining. BMC Bioinformatics. 2008;9:22. doi: 10.1186/1471-2105-9-22. [DOI] [PMC free article] [PubMed] [Google Scholar]
- 33.He X, Chang S, Zhang J, Zhao Q, Xiang H, Kusonmano K, et al. MethyCancer: the database of human DNA methylation and cancer. Nucleic Acids Res. 2008 Jan;36(Database issue):D836–D841. doi: 10.1093/nar/gkm730. [DOI] [PMC free article] [PubMed] [Google Scholar]
- 34.Sticht C, Freier K, Knopfle K, Flechtenmacher C, Pungs S, Hofele C, et al. Activation of MAP kinase signaling through ERK5 but not ERK1 expression is associated with lymph node metastases in oral squamous cell carcinoma (OSCC) Neoplasia. 2008 May;10(5):462–470. doi: 10.1593/neo.08164. [DOI] [PMC free article] [PubMed] [Google Scholar]
- 35.Hoque MO, Begum S, Topaloglu O, Chatterjee A, Rosenbaum E, Van Criekinge W, et al. Quantitation of promoter methylation of multiple genes in urine DNA and bladder cancer detection. J Natl Cancer Inst. 2006 Jul 19;98(14):996–1004. doi: 10.1093/jnci/djj265. [DOI] [PubMed] [Google Scholar]
- 36.Ulazzi L, Sabbioni S, Miotto E, Veronese A, Angusti A, Gafa R, et al. Nidogen 1 and 2 gene promoters are aberrantly methylated in human gastrointestinal cancer. Mol Cancer. 2007;6:17. doi: 10.1186/1476-4598-6-17. [DOI] [PMC free article] [PubMed] [Google Scholar]
- 37.Renard I, Joniau S, van Cleynenbreugel B, Collette C, Naome C, Vlassenbroeck I, et al. Identification and validation of the methylated TWIST1 and NID2 genes through real-time methylation-specific polymerase chain reaction assays for the noninvasive detection of primary bladder cancer in urine samples. Eur Urol. Jul;58(1):96–104. doi: 10.1016/j.eururo.2009.07.041. [DOI] [PubMed] [Google Scholar]
- 38.Gilbert PM, Mouw JK, Unger MA, Lakins JN, Gbegnon MK, Clemmer VB, et al. HOXA9 regulates BRCA1 expression to modulate human breast tumor phenotype. J Clin Invest. May 3;120(5):1535–1550. doi: 10.1172/JCI39534. [DOI] [PMC free article] [PubMed] [Google Scholar]
- 39.Ahlquist T, Lind GE, Costa VL, Meling GI, Vatn M, Hoff GS, et al. Gene methylation profiles of normal mucosa, and benign and malignant colorectal tumors identify early onset markers. Mol Cancer. 2008;7:94. doi: 10.1186/1476-4598-7-94. [DOI] [PMC free article] [PubMed] [Google Scholar]
- 40.Hellebrekers DM, Lentjes MH, van den Bosch SM, Melotte V, Wouters KA, Daenen KL, et al. GATA4 and GATA5 are potential tumor suppressors and biomarkers in colorectal cancer. Clin Cancer Res. 2009 Jun 15;15(12):3990–3997. doi: 10.1158/1078-0432.CCR-09-0055. [DOI] [PubMed] [Google Scholar]
- 41.Liu JW, Nagpal JK, Jeronimo C, Lee JE, Henrique R, Kim MS, et al. Hypermethylation of MCAM gene is associated with advanced tumor stage in prostate cancer. Prostate. 2008 Mar 1;68(4):418–426. doi: 10.1002/pros.20709. [DOI] [PubMed] [Google Scholar]
- 42.Terry MB, Gammon MD, Zhang FF, Eng SM, Sagiv SK, Paykin AB, et al. Polymorphism in the DNA repair gene XPD, polycyclic aromatic hydrocarbon-DNA adducts, cigarette smoking, and breast cancer risk. Cancer Epidemiol Biomarkers Prev. 2004 Dec;13(12):2053–2058. [PubMed] [Google Scholar]
- 43.Pepe MS, Feng Z, Huang Y, Longton G, Prentice R, Thompson IM, et al. Integrating the predictiveness of a marker with its performance as a classifier. Am J Epidemiol. 2008 Feb 1;167(3):362–368. doi: 10.1093/aje/kwm305. [DOI] [PMC free article] [PubMed] [Google Scholar]
- 44.Weinstein IB, Joe A. Oncogene addiction. Cancer Res. 2008 May 1;68(9):3077–3080. doi: 10.1158/0008-5472.CAN-07-3293. discussion 80. [DOI] [PubMed] [Google Scholar]
- 45.Weinstein IB. Cancer. Addiction to oncogenes--the Achilles heal of cancer. Science. 2002 Jul 5;297(5578):63–64. doi: 10.1126/science.1073096. [DOI] [PubMed] [Google Scholar]
- 46.Tonon G. From oncogene to network addiction: the new frontier of cancer genomics and therapeutics. Future Oncol. 2008 Aug;4(4):569–577. doi: 10.2217/14796694.4.4.569. [DOI] [PubMed] [Google Scholar]
Associated Data
This section collects any data citations, data availability statements, or supplementary materials included in this article.