

Abstract
Melanomas depend on autocrine signals for proliferation and survival; however, no systematic screen of known RTKs has been performed to identify which autocrine signaling pathways are activated in melanoma. Here we performed a comprehensive analysis of 42 receptor tyrosine kinases (RTKs) in 6 individual human melanoma tumor specimens as well as 17 melanoma cell lines, some of which were derived from the tumor specimens. We identified 5 RTKs that were active in almost every one of the melanoma tissue specimens and cell lines, including two previously unreported receptors, IGF1R and MSPR, in addition to three receptors (VEGFR, FGFR and HGFR) known to be autocrine activated in melanoma. We show by real time quantitative PCR that all melanoma cell lines expressed genes for the RTK ligands HGF, IGF1 and MSP. Addition of antibodies to either IGF1 or HGF, but not to MSP, to the culture medium blocked melanoma cell proliferation, and even caused net loss of melanoma cells. Antibody addition deactivated IGF1R and HGFR receptors, as well as MAPK signaling. Thus, IGF1 is a new growth factor for autocrine driven proliferation of human melanoma in vitro. Our results suggest that IGF1-IGF1R autocrine pathway in melanoma is a possible target for therapy in human melanomas.
Keywords: IGF1, IGF1R, HGF, HGFR, c-Met, melanoma, Receptor Tyrosine Kinases
Introduction
Melanoma is the leading cause of skin cancer deaths. Once metastatic to distant sites, it is poorly responsive to systemic therapy and is almost always fatal, with an estimated survival of 6–9 months and a 5-year survival rate less than 5% [1, 2]. Promising melanoma treatment options include those that target cell signaling pathways critical to melanoma progression and metastasis. Despite their potential, however, most targeted therapies have had limited success in clinical application. This disappointing response profile may be due in part to signaling that allows the cells to resist inhibition of targeted pathways. Alternatively, melanoma cells may be producing and secreting survival and growth factors to activate signaling pathways not yet targeted.
Paracrine and autocrine signaling is mediated through receptor tyrosine kinase (RTK) activation at the cell surface [3]. Paracrine activation of RTKs by stromal growth factors supports melanoma and growth, but autocrine activation of RTKs is of particular interest because this may enable survival during metastatic progression. There are some studies of RTK and growth factor expression in melanoma [4–7]. Autocrine signaling by FGF/FGFR has been described in melanomas, and we have described a VEGF/VEGFR-2 autocrine growth loop in melanomas [8–13]. HGF/HGFR (HGFR is also commonly referred to as c-Met) signaling has been implicated in both paracrine and autocrine growth signaling in various tumors and in the development of melanoma [14–16]. HGF has been identified as an autocrine growth factor in multiple cancers including bladder cancer [17–20] and has been shown to promote tumorigenesis and tumor cell growth [21, 22]. HGF has also been previously identified as an autocrine factor in malignant melanoma [23]. However, in that study the effects of HGF blockade on cell growth or proliferation were not examined.
The goal of this study was to perform a comprehensive analysis of activated RTKs in melanoma cells and tumors, to identify different RTKs and cognate growth factors, and to determine whether inhibition of these factors could reduce melanoma proliferation and survival.
Methods
Cell Culture
Melanoma cell lines used in this study were derived from tumors taken from tumor-involved lymph nodes from patients at the University of Virginia (VMM18, VMM39, VMM5A, VMM15, VMM14, VMM17, and VMM609) or from patients at Duke University (DM6, DM13, DM93, DM122, and DM331) as described previously [24–27]. VMM1 was derived from a metastatic brain tumor, VMM425 was derived from a pelvic soft tissue recurrence, and VMM917 was derived from a subcutaneous recurrence. These three lines were all derived from patients at the University of Virginia in the same manner as described for cells cultured from lymph nodes [27]. SKMel24 and HT144 were both obtained from ATCC. All of the cell lines were cultured in RPMI 1640 medium supplemented with 5% fetal bovine serum, 2 mM L-glutamine, penicillin (100 units/ml), and streptomycin (100 μg/ml) at 37 °C in 5% CO2, unless otherwise indicated.
Harvesting Lysates
For analysis of proteins, cells from all 17 melanoma lines were plated in 100 mm Petri dishes and incubated for 24 hours in RPMI medium plus 5% FBS. After 24 hours, the medium was aspirated and the cells were washed twice with 10 ml PBS and harvested and lysed as described previously [24]. For serum-starvation lysates, the cells were harvested the same way except no serum was added to the media and cells were lysed after 18–24 hrs. For quick frozen tumor tissue, tumor pieces were placed into small pouches of aluminum foil covered with two layers of polyester freezer labels, kept at −180C with vapor N2. The tumor pieces in packets were placed between two pre-chilled metal plates, which were placed between two pre-chilled pieces of wood and mechanically smashed to powder. The tumor powder was placed on wet ice and mixed with lysis buffer (plus 100ul/10ml phosphatase inhibitor cocktail (SigmaP2850)) according to tissue weight (~3ul/ug). Lysates were microfuged and aliquoted. Total protein concentration was determined by BCA and the lysate kept frozen at −80C.
Phospho-Receptor Tyrosine Kinase Arrays
Melanoma cells were treated with peroxyvanadate [28] for 30 minutes prior to harvest. Media was removed, cells were rinsed with ice cold PBS, trypsinized at room temperature for 1 minute and pelleted by centrifugation at 4° C. Cells were lysed with the NP-40 lysis buffer from the R&D Proteome Profiler Arrays Human phospho-RTK array (R&D systems, Minneapolis, MN, Catalog No. ARY001, Lot 1155200). These arrays have immobilized specific antibodies for individual RTKs spotted in duplicate on a filter the size of a microscope slide (Figure S1). The RTKs are recovered from a single cell extract and their activation revealed by immunostaining for phosphotyrosine. Identical amounts of total protein (250 micrograms) from extracts of melanoma cells were incubated with the antibody arrays overnight at 4 ° C and developed according to manufacturer’s instructions with Pierce’s SuperSignal west pico chemiluminescent substrate. For arrays performed on melanoma tissue, extracts were prepared as described previously; 250 micrograms of total protein were incubated with the arrays, which were processed according the manufacturer’s instructions with Pierce’s SuperSignal west femto chemiluminescent substrate. Quantitation of the arrays was performed using ImageQuant TL and the raw values of each spot on the arrays are shown in supplemental tables.
Statistical Methods for Correlation Coefficients
The natural logarithmic transformation of the raw data was used. For each assay (subject/tissue/experiment), the ratios of phosphorylated RTKs to the average of the positive controls, log(phosphorylated RTK)/log(control), were calculated. Correlation plots of the ratios in experiment A and experiment B were produced separately for each subject/tissue subset. Spearman correlations were calculated to summarize the strength of the correlations.
Quantitative Real-time PCR
Total RNA samples were obtained using the RNEasy mini kit according to manufacturer’s instructions (Qiagen, Valencia, CA). Reverse transcription was done with MultiScribe reverse transcriptase (Applied Biosystems, Foster City, CA) and random hexamers as per the manufacturer’s instructions. The resulting cDNA was then subjected to qRT-PCR as described previously. The data collected from these quantitative PCRs defined a threshold cycle (Ct) of detection for the targets (HGF, IGF1, and MSP) or the control genes (GAPDH and HPRT1) in each cDNA sample. To convert the Ct value into a relative abundance of target and control gene per sample, a standard curve was generated for the control gene using serial dilutions of the cDNA sample:an arbitrary value of template was first assigned to the highest standard and then corresponding values were assigned to the subsequent dilutions; these relative values were plotted against the Ct value determined for each dilution, resulting in the generation of the standard curve. The relative amount of target and control genes in each sample was then determined using the comparative Ct method (Applied Biosystems). The ratios of HGF, IGF1, and MSP transcripts are normalized by the geometric mean of the two control genes GAPDH and HPRT1 and are plotted on the graph.
Assay of Cell Number
Melanoma cells (1,000 cells per well) were plated in triplicate in 96-well plates with 5% fetal bovine serum and allowed to adhere overnight. After 12–16 hours, the cells were washed and treated with serum alone or with antibodies, as indicated. Cell numbers were assayed 48 hours later using Cell Titer-Glo (Promega Catalog# G7571; Madison, WI), according to the instructions provided by the manufacturer. This assay uses luciferase to measure ATP; because ATP levels are kept constant in living cells, the level is proportional to the number of viable cells.
Western Blot Analysis
Protein yields were determined by BCA analysis. Proteins were resuspended in SDS-containing samplebuffer, heated for 10 min at 70 °C, and 20 ug/lane, unless otherwise indicated, was resolved by SDS-PAGE using 4–12 % gradient gels and transferred to Low fluorescence Immobilon-P (Millipore). Membranes were blocked in Odyssey blocking buffer (Licor, Lincoln, NE). Membranes were probed with antibodies listed below in Odyssey blocking buffer with 0.1% Tween 20. Secondary antibodies were conjugated to fluorescent tags, which were detected using the Odyssey Luminescent detector. Blots were analyzed on the Licor Odyssey Infrared imaging system and quantitated using Odyssey application software Version 3.0.
Antibodies
Anti-mouse IgG, IRDye conjugated purified immunoglobulin from goat (Catalog #926-32220, used at 1:20,000) and anti-rabbit IgG, IRDye conjugated purified immunoglobulin from goat (Catalog #926-32211, used at 1:20,000) were purchased from LiCor Biosciences. HGFR antibody (catalog #51067, used at 1:1000) and IGF1R antibody (Catalog #54274, used at 1:500) were purchased from Abcam. Phosphorylated HGFR[pY1234/1235] antibody (Catalog #AF2480, used at 1:2500) was purchased from R&D biosystems. Phosphorylated IGF1R[pY1161] (Catalog #101703, used at 1:1000) was purchased from Santa Cruz biotechnologies. P44/42 MAPK (Erk1/2) antibody (Catalog #9107, used at 1:2000), phosphorylated-p44/42 MAPK (Erk1/2) [pThr202/204] (Catalog #9101, used at 1:1000) were purchased from Cell Signaling Technology. Beta Actin (catalog# 600-401-886; used at 1:5,000) was purchased from VWR. Two different anti-MSP antibodies (Catalog#s AF352 and MAB352) were purchased and tested by R&D Systems. As a control for these antibodies, an IgG control was purchased from Jackson ImmunoResearch Labs (Catalog# 0111-000-003). Anti-IGF1 antibody (catalog# sc-9013), anti-HGF antibody (catalog# sc-7949), and an IgG control (catalog# sc-2027) for these antibodies were purchased from Santa Cruz Biotechnology.
Human Subjects
All of the research involving human subjects was approved by the University of Virginia’s IRB (Human Investigation Committee, HIC 5202 and HIC 10598) in accordance with assurances filed with and approved by the Department of Health and Human Services.
Results
Comprehensive analysis of receptor tyrosine kinases in metastatic melanomas
The phosphorylation of 42 different human receptor tyrosine kinases (RTKs) was analyzed in 6 metastatic melanoma tissues and 17 cell lines derived from metastatic melanomas using phospho-RTK arrays (Figure 1, Figure S2– S4 and Tables S1–S3). Less than half of the RTKs were phosphorylated in these melanoma cell lines and tumors. This indicated that many of the human RTKs are either not expressed in melanomas, or are expressed but not activated. Comparison of RTKs activated in the VMM917T tumor (Figure 1C) to the cell line derived from this tissue (Figure 1A) revealed seven common RTKs. The tumor sample had 12 other activated RTKs not seen in the cell line and conversely the cell line had 10 other activated RTKs. These patterns were highly reproducible. Reproducibility was demonstrated using three tumors and three representative cell lines in two independent experiments (Figure 1B, 1D, Figure S2, S3 and Table S1–S2). Spearman correlation analyses revealed coefficients between 0.67 and 0.88, (p < 0.01) for the replicate experiments (Figure 1B, 1D and S2–3).
Figure 1. Receptor tyrosine kinase phosphorylation in melanomas.
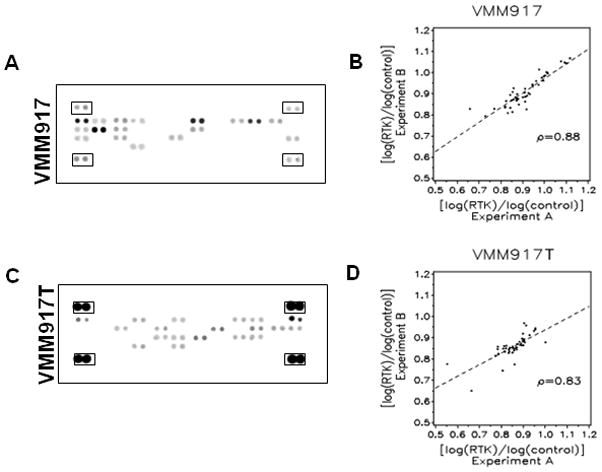
A, Phospho-Receptor Tyrosine Kinase arrays with duplicate spots of capture antibodies for 42 different receptors are shown with pairs of (+) control spots at the corners (boxed) for the VMM917 melanoma cell line. The staining by SuperSignal west pico chemiluminescent substrate was exposed to film and scanned into a TIFF file and analyzed by ImageQuant TL software. B, Spearman correlation plot for the VMM917 melanoma cell line where the log of the value for the RTK is divided by the log of the value for the control for both the X axis (value from experiment A) and Y axis (value from experiment B). The Spearman correlation value was 0.88 with a p-value of < 0.01. C, Phospho-RTK arrays, as described in A, for the VMM917T melanoma tissue specimen. D, Spearman correlation plot for the phospho-RTK arrays from Experiment A and Experiment B using the VMM917T tissue specimen showed a correlation value of 0.83 with a p-value of < 0.01.
The staining intensity of activated RTKs in the melanoma cell lines was consistently greater than that in melanoma tumor specimens (Figure 1A vs. 1C). The tyrosine phosphatase inhibitor pervanadate was used to treat melanoma cell lines in culture to preserve Tyr phosphorylation, but this was not possible for melanoma tumors prior to excision and extraction. The inhibitor treatment did not non-specifically increase Tyr phosphorylation of RTKs in cells. We found the same RTKs activated with or without pervanadate treatment of DM93 cells (not shown). The relatively low level of RTK phosphorylation in tissues was addressed by an amplified detection system to allow comparison with the cell lines. The differences in which RTKs were activated between tumors and cell lines could have been due to non-melanoma cells in biopsies. The RTKs seen in cell lines but not in the tumors could have been due to the in vitro culture conditions. We analyzed RTK activation in serum-starved cells using 7 of the 17 melanoma cell lines (Figure S5 and Table S4). We found a common set of RTKs was activated in the cell lines both in the presence and absence of serum: MSPR, HGFR, IGF1R, FGFR3, ErbB3 and VEGFR3. Even with differences between tumors and cell lines the RTK arrays provided a means to compare the signaling events across multiple samples of melanomas.
We prepared a matrix to compare RTK activation for the melanoma tumors and cell lines (Figure 2). We assigned RTKs into four groups (A, B, C, D) based on statistical analysis of differences in their activation status in melanoma. Group A RTKs (12 total RTKs) were predominantly not active in melanoma cell lines grown in vitro, but some RTKs in this group (e.g. ROR1, ROR2, and Tie-1) were phosphorylated in melanoma tumors. Group B RTKs (19 total RTKs) were phosphorylated in as few as one, and less than 10, of the 17 cell lines, and in some melanoma tumors. Group B included EGFR, VEGFR-2, Dtk and Tie-2. Group C RTKs (5 total RTKs) were phosphorylated in a majority (greater than or equal to 10 out of 17) cell lines (including ErbB4, InsR, and EphA4). Group D RTKs (6 total RTKs) were phosphorylated in > 80% of the entire set of melanoma cell lines. These receptors included MSPR, HGFR, IGF1R, VEGFR-3, ErbB3 and FGFR-3. Phospho-HGFR was detected in 14 of 17 (82%) of melanoma cell lines, but not in any of 7 melanoma tumor samples. Therefore, we also tested HGFR phosphorylation by immunoblotting with a phosphosite-specific (P-Tyr1234/1235) antibody in eleven cell lines and eight tumors, three of which were tested on the RTK array. By immunoblotting we found phospho HGFR in the two cell lines DM122 and HT144 tested and in 7 of 8 (~88%) of tumors (Supplemental Figure S6 A and B). We also detected phospho HGFR by immunoblotting HT144, DM13 and DM93 melanoma cell lines both in the presence and absence of serum (Supplemental Figure S6 C). Furthermore, we detected activated HGFR in melanoma cells in a paraffin-embedded formalin-fixed tumor sample by immunohistochemistry (data not shown). Based on these observations, we concluded that the MSPR, IGF1R, HGFR, VEGFR-3, and FGFR-3 RTKs are activated in human melanoma. Our hypothesis was that this occurs via autocrine signaling.
Figure 2. Matrix of activated RTKs in human melanoma cell lines and tissue specimens.

The cell origins are plotted along the X-Axis and RTKs along the Y-Axis. RTKs were rank-ordered on the melanoma cell lines with the least activated receptors at the top. Melanoma cell lines grown in serum are shown in blue, serum-starved cell lines in green and melanoma tumor specimens in lavender. Coloration of the block on the map corresponds to phosphorylation of the RTK on the array. An empty block corresponds with no detectable phosphorylation of the RTK. The black dashed lines delineate the four groups.
Genotyping of BRAF and NRAS was undertaken on 13 of the 17 cell lines used for the RTK arrays. Of these, 9 had BRAF V600E mutation, 2 had NRAS mutation, and 2 were wild type for both BRAF and NRAS. The numbers were too small to make any significant conclusions about effects of mutation status on RTK phosphorylation.
Autocrine Stimulation of Melanoma Cell Lines
Autocrine activation of VEGF/VEGFR2 and FGF/FGFR in melanoma has already been defined [8–13], therefore we focused on testing autocrine stimulation by HGF, IGF1 and MSP in melanoma. First, quantitative Real Time PCR (qRT-PCR) showed mRNA for HGF, IGF1, and MSP in every one of the 14 melanoma cell lines tested (Figure 3). ELISA assay of cells in medium without added serum showed secretion of IGF1 in a subset of 6 tested cell lines, and secretion of MSP in a subset of 6 tested cell lines (data not shown). Second, because the melanomas were expressing these growth factors, we examined effects of blocking each of these factors with antibodies on cell proliferation in vitro. Addition of anti-IGF1 antibody to the culture medium blocked melanoma proliferation in all 4 melanoma cell lines tested (Figure 4). In three of the four cell lines, the higher antibody concentrations caused a specific net decrease in number of viable melanoma cells. This suggested to us that depriving the melanoma cells of IGF-1 could be lethal. Addition of anti-HGF antibody to culture medium also blocked melanoma cell proliferation in a dose-dependent manner (Figure 5). Again, there was a net loss of melanoma cells at the highest antibody concentrations. Addition of a control, non-immune IgG to the culture medium produced some decrease in melanoma proliferation at the highest concentrations (Figures 4 and 5; white bars). Regardless, at the lower antibody concentrations there was specific inhibition of proliferation by the anti-IGF1 and HGF antibodies not seen with the IgG control antibody. At the highest concentrations even though the control antibodies inhibited proliferation, there was a dramatic loss of cells in response to the specific anti-IGF1 and HGF antibodies. We concluded that neutralization of IGF1 or HGF by antibodies inhibited proliferation of multiple melanoma cell lines. In contrast, there was no significant reduction in cell proliferation compared to controls by blocking MSP with either of two different anti-MSP antibodies, over a 10,000-fold concentration range (Supplemental Figure S7). Thus, HGF and IGF1, but not MSP, are required for survival and proliferation of human melanoma cells in vitro.
Figure 3. Expression of HGF, IGF1, and MSP in human melanoma cell lines.

Quantitative real-time PCR was performed as described in the materials and methods to determine the relative mRNA expression of growth factors IGF1, HGF and MSP in 14 melanoma cell lines. The levels were normalized to the geometric mean of GAPDH and HPRT1 as controls. Results are plotted on a logarithmic scale to allow comparison of the 1000-fold range in mRNA levels.
Figure 4. Anti-IGF1 antibody inhibits proliferation of human melanoma cell lines.

A–D, Four melanoma cell line dose response curves are shown. The percent change in cell number versus concentration in ug/ml of antibody is shown in a cell proliferation assay using Cell Titer-Glo starting with 1,000 cells/well. Cells were cultured in media plus serum with no treatment (hatched bar), plus an IgG control antibody (white bars) as described in materials and methods, and an anti-IGF1 antibody (black bars) at concentrations ranging from 0.01 to 10 ug/ml. Error bars represent standard deviations from three independent experiments.
Figure 5. Anti-HGF antibody inhibits proliferation of human melanoma cell lines.

A–D, Four melanoma cell line dose response curves are shown. As in Figure 4, the percent change in cell number versus concentration in ug/ml of antibody is shown in a cell proliferation assay using Cell Titer-Glo starting with 1,000 cells/well. Cells were cultured in media plus serum with no treatment (hatched bar), plus an IgG control antibody (white bars) as described in materials and methods, and an anti-HGF antibody (black bars) at concentrations ranging from 0.01 to 10 ug/ml. Error bars represent standard deviations from three independent experiments.
Effects of growth factor blockade on receptor phosphorylation and on MAPK
The cellular targets of the anti-proliferative effects of anti-IGF1 and anti-HGF were examined by immunoblotting cell extracts with phosphosite specific antibodies. Phosphorylated IGF1R and activated MAPK were readily detected in the DM13 melanoma cell line (Figure 6). Phosphorylation of IGF1R (P-Tyr1161) was extinguished within 6 hrs of anti-IGF1 treatment, and the deactivation due to anti-IGF1 persisted for at least 18 hrs (Figure 6A). Phosphorylation of MAPK remained up to 6 hrs after IGF1 blockade, but was not detected at 18 hrs (Figure 6A). Phosphorylation HGFR (P-Tyr1234/1235) was detected by immunoblotting and this staining was eliminated within 6 hrs of adding anti-HGF antibody to cells (Figure 6B). The inhibitory effects persisted for up to 18 hrs. These results showed that antibodies added to the culture medium indeed interfered with the autocrine activation of the IGF1 and HGFR receptors and the MAPK pathway in melanoma cell lines in vitro.
Figure 6. Signaling effects of anti-IGF1 or anti-HGF antibodies in human melanoma cells.

A, DM13 melanoma cells were left untreated or treated with 10 ug/ml of IgG antibody or the anti-IGF1 antibody and then incubated for 6 or 18 hrs, at which time cells were lysed and extracts prepared. Western blot analysis of phospho-IGF1R, IGF1R, phospho-MAPK, and MAPK are shown. Beta Actin is blotted as a loading control. B, DM13 melanoma cells were left untreated or treated with 10 ug/ml of IgG antibody or the HGF antibody, and then incubated for 6 or 18 hrs, at which time cells were lysed and extracts prepared. Western blot analysis of phospho-HGFR, HGFR, phospho-MAPK, and MAPK are shown. Beta Actin is blotted as a loading control.
Discussion
Autocrine growth loops contribute to aberrant RTK signaling in a range of human diseases [29–33]. Growth factors and their receptor tyrosine kinases signal in both autocrine and paracrine fashion, and certainly both modes of signaling are important. However, autocrine signaling enables cell autonomy and the ability to independently survive and metastasize. Identification and control of autocrine signaling allows for blocking the invasive phenotype of melanoma, and this is the focus of our discussion. Autocrine signaling including members of the FGF family and their receptors [34] are implicated in melanoma, and our group previously described a VEGF/VEGFR-2 autocrine growth loop in melanoma [8]. However, until now there has been no comprehensive analysis of RTK activation both in melanoma tissue biopsies and in their derivative cell lines. Our comprehensive analysis of 42 RTKs shows most are not expressed or activated in melanoma. However, a handful of receptors (Group D) were activated in almost every melanoma cell line and in melanoma tumors. This group included three RTKs (FGFR3, VEGFR-3, and HGFR) that act as receptors of previously identified autocrine growth factors in melanoma. Those results in effect validated our approach and methods. But, in addition we found two other activated RTKs, MSPR and IGF-1R, as potential autocrine-activated RTKs.
It should be noted that the tumor and cell lines had differences in activation of some RTKs. The reason for this is likely multifactorial. Lower levels of phosphorylated RTK in cell lines may be due to activated RTKs in stromal cells included in analysis of tissue. Alternatively, higher levels of phosphorylated RTKs in cell lines may be due to a pure clonal tumor population, avoiding the stromal component seen in tissue. Additionally, processing of tissue can lead to dephosphorylation of receptor kinases by phosphatases, artificially lowering levels of transiently phosphorylated RTKs as compared to that seen in cell lines. Overall cell lines are a reasonable model in selective cases, but cannot substitute for analysis of tissue. Both systems can be used together to gather a comprehensive view of RTKs in melanoma.
Insulin-like growth factor receptor 1 (IGF-1R) is over expressed in many tumors and is reported to promote proliferation and motility and prevent apoptosis [13, 35]. It has been suggested that IGF-1R is crucial for the viability of melanoma cells in vitro as well as in vivo [36, 37]. Treatment of melanoma cells with an IGF-1R antibody resulted in growth arrest and apoptosis [36]. Anti-IGF-1R suppressed the autocrine and paracrine proliferation of several cancer cell lines [38]. Additionally, siRNA to IGF-1R strongly inhibits tumor growth in nude mice, suggesting that IGF-1R plays a role in vivo for tumorigenesis [39]. IGF-1 has been shown to be produced by fibroblasts and to act as a paracrine growth factor to stimulate malignant cells that express IGF-1R [40, 41].
There are no published studies addressing whether IGF-1 is an autocrine growth factor in melanomas. In fact, there is a previous report that melanoma cells do not produce IGF-1 [41]. However, here we show IGF-1 mRNA is expressed and secreted by melanoma cells and melanoma cell proliferation decreases in response to antibody blockade of IGF-1. Moreover, phosphorylation of the IGF- 1 receptor is seen in melanoma cells, and this is eliminated by addition of anti-IGF-1 antibodies to the culture medium. Levels of IGF-1 were not measurable in serum-free medium and thus we conclude that melanoma cells are producing and secreting the IGF-1 that is blocked by the IGF-1 deactivating antibody. The results support our proposal that IGF-1 is a novel autocrine growth factor in melanoma that signals through IGF-1R to support proliferation of cells in vitro.
HGF has been implicated in autocrine signaling in melanoma; however the evidence about its role in melanoma growth and proliferation is incomplete. A previous study showed that 6 of 8 melanoma cell lines tested expressed HGF, but in only 2 of 4 cell lines was HGFR activated in the absence of exogenous HGF [23]. To test the hypothesis that HGF is an autocrine factor the two melanoma cell lines were treated with an anti-HGF antibody, which resulted in a decrease in phospho HGFR, phospho MAPK, and phospho AKT. The authors concluded that HGFR activation was autocrine [23]. Other studies have shown that treatment with HGF results in increased proliferation of human melanocytes in vitro [42–44]. Our study with more cell lines shows over 80% of melanomas have activated HGFR, and we found every cell line tested expressed HGF, both in the presence and absence of serum. The discrepancy between the low incidence of HGFR activation seen on the RTK array and the high incidence of activation on WB is likely due to different phosphorylation sites, different antibody affinities and avidities, or a combination of these three. Given the literature available supporting HGF as an autocrine growth factor, we elected to pursue study further. By demonstrating reduced cell proliferation after antibody blockade of its ligand HGF, we strengthen the case that HGFR is activated by an autocrine loop.
MSPR is a member of the MET proto-oncogene family of RTKs that mediates multiple signaling cascades impacting cell motility, adhesion, proliferation, and apoptosis [45–47]. MSPR is expressed in multiple epithelial cancer cell types: NSCLC, hepatocellular carcinomas, pancreatic cancers, and squamous cell carcinomas [45, 48]. We found no reports in the literature of MSPR expression in melanoma cells. However, we discovered MSPR was activated in every melanoma cell line and tumor using the RTK arrays. The ligand for MSPR is MSP (macrophage-stimulating protein; hepatocyte growth factor-like protein HGFL). There are no reports that MSP is an autocrine growth factor in melanoma. Our antibody experiments suggest that melanoma cells do not depend on MSP as an autocrine factor for proliferation. The question remains, how is MSPR activated in every melanoma cell line and tumor? One possible explanation is that MSPR and HGFR heterodimerize, so, autocrine HGF binding to HGFR results in transphosphorylation and activation of MSPR [49].
Further study of RTK signaling in melanomas may be a fruitful area of research for development of therapies. Work to date has led to the successful introduction of therapeutic agents that target the biological activity of RTKs [50–53]. For example, we previously found that VEGF is an autocrine growth factor for melanomas that express VEGFR-2 and that the proliferation of those melanomas was inhibited by the anti-VEGF antibody bevacizumab [8]. Bevacizumab is now currently in melanoma clinical trials (NCT00397982 and others). However, our recent studies have indicated that the previously published prevalence of VEGFR-2 expression on melanomas (~90%) may be an overestimate due to nonspecific antibody staining and that the actual percentage of melanomas that express VEGFR-2 is approximately 7% (unpublished). This may explain the low incidence of activated VEGFR-2 seen in the RTK array. Results from this in vitro study support further preclinical studies on targeting the HGF/HGFR and IGF-1/IGF-1R autocrine pathways as effective treatments of melanoma in vivo.
Supplementary Material
Acknowledgments
We thank the members of the Slingluff laboratory for helpful discussions. We thank Dr. Yongde Bao and the University of Virginia Biomolecular Core Facility for their assistance with the real-time PCR experiments. This work was partly supported by grant CA77584 to Dr. David L. Brautigan from USPHS NCI. Kerrington R. Molhoek, Ph.D. was supported by the American Cancer Society, California Division Campaign for Research 2007 Postdoctoral Fellowship. Amber L. Shada, M.D. was supported by the UVa Cancer Center through the Farrow Fellowship Fund and the NCI Cancer Center Support Grant, P30CA44579. Support was also provided by the NIH/NCI grant R01 CA57653 to Dr. Craig L. Slingluff, Jr. and the University of Virginia Cancer Center Support Grant (NIH/NCI P30 CA44579). Partial support was also provided by a gift from the Commonwealth Foundation for Cancer Research and by the James and Rebecca Craig Foundation.
References
- 1.Balch CM, Buzaid AC, Soong SJ, Atkins MB, Cascinelli N, Coit DG, et al. Final version of the American Joint Committee on Cancer staging system for cutaneous melanoma. J Clin Oncol. 2001;19(16):3635–48. doi: 10.1200/JCO.2001.19.16.3635. [DOI] [PubMed] [Google Scholar]
- 2.Kirkwood JM, Manola J, Ibrahim J, Sondak V, Ernstoff MS, Rao U. A pooled analysis of eastern cooperative oncology group and intergroup trials of adjuvant high-dose interferon for melanoma. Clin Cancer Res. 2004;10(5):1670–7. doi: 10.1158/1078-0432.ccr-1103-3. [DOI] [PubMed] [Google Scholar]
- 3.Lazar-Molnar E, Hegyesi H, Toth S, Falus A. Autocrine and paracrine regulation by cytokines and growth factors in melanoma. Cytokine. 2000;12(6):547–54. doi: 10.1006/cyto.1999.0614. [DOI] [PubMed] [Google Scholar]
- 4.Albino AP. The role of oncogenes and growth factors in progressive melanoma-genesis. Pigment Cell Res. 1992;(Suppl 2):199–218. doi: 10.1111/j.1600-0749.1990.tb00375.x. [DOI] [PubMed] [Google Scholar]
- 5.Shih IM, Herlyn M. Autocrine and paracrine roles for growth factors in melanoma. In Vivo. 1994;8(1):113–23. [PubMed] [Google Scholar]
- 6.Halaban R. Growth factors and melanomas. Semin Oncol. 1996;23(6):673–81. [PubMed] [Google Scholar]
- 7.Rodeck U, Herlyn M. Growth factors in melanoma. Cancer Metastasis Rev. 1991;10(2):89–101. doi: 10.1007/BF00049407. [DOI] [PubMed] [Google Scholar]
- 8.Molhoek KR, Griesemann H, Shu J, Gershenwald JE, Brautigan DL, Slingluff CL., Jr Human melanoma cytolysis by combined inhibition of mammalian target of rapamycin and vascular endothelial growth factor/vascular endothelial growth factor receptor-2. Cancer Res. 2008;68(11):4392–7. doi: 10.1158/0008-5472.CAN-07-5844. [DOI] [PMC free article] [PubMed] [Google Scholar]
- 9.Wang Y, Becker D. Antisense targeting of basic fibroblast growth factor and fibroblast growth factor receptor-1 in human melanomas blocks intratumoral angiogenesis and tumor growth. Nat Med. 1997;3(8):887–93. doi: 10.1038/nm0897-887. [DOI] [PubMed] [Google Scholar]
- 10.Halaban R, Langdon R, Birchall N, Cuono C, Baird A, Scott G, Moellmann G, McGuire J. Basic fibroblast growth factor from human keratinocytes is a natural mitogen for melanocytes. J Cell Biol. 1988;107(4):1611–9. doi: 10.1083/jcb.107.4.1611. [DOI] [PMC free article] [PubMed] [Google Scholar]
- 11.Meier F, Nesbit M, Hsu MY, Martin B, Van Belle P, Elder DE, et al. Human melanoma progression in skin reconstructs: biological significance of bFGF. Am J Pathol. 2000;156(1):193–200. doi: 10.1016/S0002-9440(10)64719-0. [DOI] [PMC free article] [PubMed] [Google Scholar]
- 12.Nesbit M, Nesbit HK, Bennett J, et al. Basic fibroblast growth factor induces a transformed phenotype in normal human melanocytes. Oncogene. 1999;18(47):6469–76. doi: 10.1038/sj.onc.1203066. [DOI] [PubMed] [Google Scholar]
- 13.Shih IM, Herlyn M. Role of growth factors and their receptors in the development and progression of melanoma. J Invest Dermatol. 1993;100(2 Suppl):196S–203S. [PubMed] [Google Scholar]
- 14.Hendrix MJ, Seftor EA, Seftor RE, Kirschmann DA, Gardner LM, Boldt HC, et al. Regulation of uveal melanoma interconverted phenotype by hepatocyte growth factor/scatter factor (HGF/SF) Am J Pathol. 1998;152(4):855–63. [PMC free article] [PubMed] [Google Scholar]
- 15.Natali PG, Nicotra MR, Di Renzo MF, Prat M, Bigotti A, Cavaliere R, Comoglio PM. Expression of the c-Met/HGF receptor in human melanocytic neoplasms: demonstration of the relationship to malignant melanoma tumour progression. Br J Cancer. 1993;68(4):746–50. doi: 10.1038/bjc.1993.422. [DOI] [PMC free article] [PubMed] [Google Scholar]
- 16.Rusciano D, Lin S, Lorenzoni P, Casella N, Burger MM. Influence of hepatocyte growth factor/scatter factor on the metastatic phenotype of B16 melanoma cells. Tumour Biol. 1998;19(5):335–45. doi: 10.1159/000030026. [DOI] [PubMed] [Google Scholar]
- 17.Bellusci S, Moens G, Gaudino G, Comoglio P, Nakamura T, Thiery JP, Jouanneau J. Creation of an hepatocyte growth factor/scatter factor autocrine loop in carcinoma cells induces invasive properties associated with increased tumorigenicity. Oncogene. 1994;9(4):1091–9. [PubMed] [Google Scholar]
- 18.Tamatani T, Hattori K, Iyer A, Tamatani K, Oyasu R. Hepatocyte growth factor is an invasion/migration factor of rat urothelial carcinoma cells in vitro. Carcinogenesis. 1999;20(6):957–62. doi: 10.1093/carcin/20.6.957. [DOI] [PubMed] [Google Scholar]
- 19.Moriyama T, Kataoka H, Koono M, Wakisaka S. Expression of hepatocyte growth factor/scatter factor and its receptor c-Met in brain tumors: evidence for a role in progression of astrocytic tumors (Review) Int J Mol Med. 1999;3(5):531–6. doi: 10.3892/ijmm.3.5.531. [DOI] [PubMed] [Google Scholar]
- 20.Rong S, Bodescot M, Blair D, Dunn J, Nakamura T, Mizuno K, et al. Tumorigenicity of the met proto-oncogene and the gene for hepatocyte growth factor. Mol Cell Biol. 1992;12(11):5152–8. doi: 10.1128/mcb.12.11.5152. [DOI] [PMC free article] [PubMed] [Google Scholar]
- 21.To CT, Tsao MS. The roles of hepatocyte growth factor/scatter factor and met receptor in human cancers (Review) Oncol Rep. 1998;5(5):1013–24. doi: 10.3892/or.5.5.1013. [DOI] [PubMed] [Google Scholar]
- 22.Vande Woude GF, Jeffers M, Cortner J, Alvord G, Tsarfaty I, Resau J. Met- HGF/SF: tumorigenesis, invasion and metastasis. Ciba Found Symp. 1997;212:119–30. doi: 10.1002/9780470515457.ch8. discussion 30–2, 48–54. [DOI] [PubMed] [Google Scholar]
- 23.Li G, Schaider H, Satyamoorthy K, Hanakawa Y, Hashimoto K, Herlyn M. Downregulation of E-cadherin and Desmoglein 1 by autocrine hepatocyte growth factor during melanoma development. Oncogene. 2001;20(56):8125–35. doi: 10.1038/sj.onc.1205034. [DOI] [PubMed] [Google Scholar]
- 24.Molhoek KR, Brautigan DL, Slingluff CL., Jr Synergistic inhibition of human melanoma proliferation by combination treatment with B-Raf inhibitor BAY43-9006 and mTOR inhibitor Rapamycin. J Transl Med. 2005;3:39. doi: 10.1186/1479-5876-3-39. [DOI] [PMC free article] [PubMed] [Google Scholar]
- 25.Yamshchikov GV, Mullins DW, Chang CC, Ogino T, Thompson L, Presley J, Galavotti H, et al. Sequential immune escape and shifting of T cell responses in a long-term survivor of melanoma. J Immunol. 2005;174(11):6863–71. doi: 10.4049/jimmunol.174.11.6863. [DOI] [PubMed] [Google Scholar]
- 26.Darrow TL, Slingluff CL, Jr, Seigler HF. The role of HLA class I antigens in recognition of melanoma cells by tumor-specific cytotoxic T lymphocytes. Evidence for shared tumor antigens. J Immunol. 1989;142(9):3329–35. [PubMed] [Google Scholar]
- 27.Slingluff CL, Jr, Colella TA, Thompson L, Graham DD, Skipper JC, Caldwell J, et al. Melanomas with concordant loss of multiple melanocytic differentiation proteins: immune escape that may be overcome by targeting unique or undefined antigens. Cancer Immunol Immunother. 2000;48(12):661–72. doi: 10.1007/s002620050015. [DOI] [PMC free article] [PubMed] [Google Scholar]
- 28.Zhao Z, Tan Z, Diltz CD, You M, Fischer EH. Activation of mitogen-activated protein (MAP) kinase pathway by pervanadate, a potent inhibitor of tyrosine phosphatases. J Biol Chem. 1996;271(36):22251–5. doi: 10.1074/jbc.271.36.22251. [DOI] [PubMed] [Google Scholar]
- 29.Bennasroune A, Gardin A, Aunis D, Cremel G, Hubert P. Tyrosine kinase receptors as attractive targets of cancer therapy. Crit Rev Oncol Hematol. 2004;50(1):23–38. doi: 10.1016/j.critrevonc.2003.08.004. [DOI] [PubMed] [Google Scholar]
- 30.Pegram M, Slamon D. Biological rationale for HER2/neu (c-erbB2) as a target for monoclonal antibody therapy. Semin Oncol. 2000;27(5 Suppl 9):13–9. [PubMed] [Google Scholar]
- 31.Valentinis B, Baserga R. IGF-I receptor signalling in transformation and differentiation. Mol Pathol. 2001;54(3):133–7. doi: 10.1136/mp.54.3.133. [DOI] [PMC free article] [PubMed] [Google Scholar]
- 32.Schmidt L, Duh FM, Chen F, Kishida T, Glenn G, Choyke P, et al. Germline and somatic mutations in the tyrosine kinase domain of the MET proto-oncogene in papillary renal carcinomas. Nat Genet. 1997;16(1):68–73. doi: 10.1038/ng0597-68. [DOI] [PubMed] [Google Scholar]
- 33.Arighi E, Borrello MG, Sariola H. RET tyrosine kinase signaling in development and cancer. Cytokine Growth Factor Rev. 2005;16(4–5):441–67. doi: 10.1016/j.cytogfr.2005.05.010. [DOI] [PubMed] [Google Scholar]
- 34.Chin L, Merlino G, DePinho RA. Malignant melanoma: modern black plague and genetic black box. Genes Dev. 1998;12(22):3467–81. doi: 10.1101/gad.12.22.3467. [DOI] [PubMed] [Google Scholar]
- 35.Yeh AH, Bohula EA, Macaulay VM. Human melanoma cells expressing V600E B-RAF are susceptible to IGF1R targeting by small interfering RNAs. Oncogene. 2006;25(50):6574–81. doi: 10.1038/sj.onc.1209674. [DOI] [PubMed] [Google Scholar]
- 36.Kanter-Lewensohn L, Dricu A, Wang M, Wejde J, Kiessling R, Larsson O. Expression of the insulin-like growth factor-1 receptor and its anti-apoptotic effect in malignant melanoma: a potential therapeutic target. Melanoma Res. 1998;8(5):389–97. doi: 10.1097/00008390-199810000-00002. [DOI] [PubMed] [Google Scholar]
- 37.Li G, Satyamoorthy K, Meier F, Berking C, Bogenrieder T, Herlyn M. Function and regulation of melanoma-stromal fibroblast interactions: when seeds meet soil. Oncogene. 2003;22(20):3162–71. doi: 10.1038/sj.onc.1206455. [DOI] [PubMed] [Google Scholar]
- 38.Maloney EK, McLaughlin JL, Dagdigian NE, Garrett LM, Connors KM, Zhou XM, et al. An anti-insulin-like growth factor I receptor antibody that is a potent inhibitor of cancer cell proliferation. Cancer Res. 2003;63(16):5073–83. [PubMed] [Google Scholar]
- 39.Resnicoff M, Coppola D, Sell C, Rubin R, Ferrone S, Baserga R. Growth inhibition of human melanoma cells in nude mice by antisense strategies to the type 1 insulin-like growth factor receptor. Cancer Res. 1994;54(18):4848–50. [PubMed] [Google Scholar]
- 40.Satyamoorthy K, Li G, Vaidya B, Kalabis J, Herlyn M. Insulin-like growth factorI-induced migration of melanoma cells is mediated by interleukin-8 induction. Cell Growth Differ. 2002;13(2):87–93. [PubMed] [Google Scholar]
- 41.Satyamoorthy K, Li G, Vaidya B, Patel D, Herlyn M. Insulin-like growth factor-1 induces survival and growth of biologically early melanoma cells through both the mitogen-activated protein kinase and beta-catenin pathways. Cancer Res. 2001;61(19):7318–24. [PubMed] [Google Scholar]
- 42.Halaban R, Rubin JS, Funasaka Y, Cobb M, Boulton T, Faletto D, et al. Met and hepatocyte growth factor/scatter factor signal transduction in normal melanocytes and melanoma cells. Oncogene. 1992;7(11):2195–206. [PubMed] [Google Scholar]
- 43.Imokawa G, Yada Y, Morisaki N, Kimura M. Biological characterization of human fibroblast-derived mitogenic factors for human melanocytes. Biochem J. 1998;330 (Pt 3):1235–9. doi: 10.1042/bj3301235. [DOI] [PMC free article] [PubMed] [Google Scholar]
- 44.Matsumoto K, Tajima H, Nakamura T. Hepatocyte growth factor is a potent stimulator of human melanocyte DNA synthesis and growth. Biochem Biophys Res Commun. 1991;176(1):45–51. doi: 10.1016/0006-291x(91)90887-d. [DOI] [PubMed] [Google Scholar]
- 45.Camp ER, Liu W, Fan F, Yang A, Somcio R, Ellis LM. RON, a tyrosine kinase receptor involved in tumor progression and metastasis. Ann Surg Oncol. 2005;12(4):273–81. doi: 10.1245/ASO.2005.08.013. [DOI] [PubMed] [Google Scholar]
- 46.Danilkovitch-Miagkova A, Leonard EJ. Anti-apoptotic action of macrophage stimulating protein (MSP) Apoptosis. 2001;6(3):183–90. doi: 10.1023/a:1011384609811. [DOI] [PubMed] [Google Scholar]
- 47.Wagh PK, Peace BE, Waltz SE. Met-related receptor tyrosine kinase Ron in tumor growth and metastasis. Adv Cancer Res. 2008;100:1–33. doi: 10.1016/S0065-230X(08)00001-8. [DOI] [PMC free article] [PubMed] [Google Scholar]
- 48.Thomas RM, Toney K, Fenoglio-Preiser C, Revelo-Penafiel MP, Hingorani SR, Tuveson DA, Waltz SE, Lowy AM. The RON receptor tyrosine kinase mediates oncogenic phenotypes in pancreatic cancer cells and is increasingly expressed during pancreatic cancer progression. Cancer Res. 2007;67(13):6075–82. doi: 10.1158/0008-5472.CAN-06-4128. [DOI] [PubMed] [Google Scholar]
- 49.Follenzi A, Bakovic S, Gual P, Stella MC, Longati P, Comoglio PM. Cross-talk between the proto-oncogenes Met and Ron. Oncogene. 2000;19(27):3041–9. doi: 10.1038/sj.onc.1203620. [DOI] [PubMed] [Google Scholar]
- 50.Baselga J, Cortes J. Epidermal growth factor receptor pathway inhibitors. Cancer Chemother Biol Response Modif. 2005;22:205–23. doi: 10.1016/s0921-4410(04)22009-9. [DOI] [PubMed] [Google Scholar]
- 51.Slamon DJ, Leyland-Jones B, Shak S, et al. Use of chemotherapy plus a monoclonal antibody against HER2 for metastatic breast cancer that overexpresses HER2. N Engl J Med. 2001;344(11):783–92. doi: 10.1056/NEJM200103153441101. [DOI] [PubMed] [Google Scholar]
- 52.Ferrara N, Hillan KJ, Novotny W. Bevacizumab (Avastin), a humanized anti-VEGF monoclonal antibody for cancer therapy. Biochem Biophys Res Commun. 2005;333(2):328–35. doi: 10.1016/j.bbrc.2005.05.132. [DOI] [PubMed] [Google Scholar]
- 53.Sihto H, Sarlomo-Rikala M, Tynninen O, Tanner M, Andersson LC, Franssila K, Nupponen NN, Joensuu H. KIT and platelet-derived growth factor receptor alpha tyrosine kinase gene mutations and KIT amplifications in human solid tumors. J Clin Oncol. 2005;23(1):49–57. doi: 10.1200/JCO.2005.02.093. [DOI] [PubMed] [Google Scholar]
Associated Data
This section collects any data citations, data availability statements, or supplementary materials included in this article.