

Abstract
Structural knowledge of telomeric DNA is critical for understanding telomere biology and for the utilization of telomeric DNA as a therapeutic target. Very little is known about the structure of long human DNA sequences that may form more than one quadruplex unit. Here we report a combination of molecular dynamics simulations and experimental biophysical studies to explore the structural and dynamic properties of the human telomeric sequence (TTAGGG)8TT that folds into two contiguous quadruplexes. Five higher order quadruplex models were built combining known single human telomeric quadruplex structures as unique building blocks. The biophysical properties of this sequence in K+ solution were experimentally investigated by means of analytical ultracentrifugation and UV spectroscopy. Additionally, the environments of loop adenines were probed by fluorescence studies using systematic single-substitutions of 2-aminopurine for the adenine bases. The comparison of the experimentally determined properties with the corresponding quantities predicted from the models allowed us to test the validity of each of the structural models. One model emerged whose properties are most consistent with the predictions, and which therefore is the most probable structure in solution. This structure features contiguous quadruplex units in an alternating hybrid-1-hybrid-2 conformation with a highly-ordered interface composed of loop residues from both quadruplexes.
Introduction
Telomeres consist of DNA-protein complexes that protect the ends of the chromosomes from fusion and degradation. Human telomeric DNA contains tandem repeats of the sequence TTAGGG and in all eukaryotic cells the telomeric region is double-stranded for most of its length, but the extreme 3′-end consists of single-stranded G-rich DNA overhangs approximately 200 nt in length1–2. In normal somatic cells telomeres progressively shorten during replication because DNA polymerase cannot fully copy the ends of telomeric DNA (the end replication problem)3. At each replicative cycle, eukaryotic telomeric DNA is shortened until a critical state of senescence is reached and cell death occurs4–5. In cancer, a special cellular reverse transcriptase, telomerase, is activated and maintains the length of telomeres, allowing tumor cells to continue to proliferate6–7. Since cancer cells must maintain their telomeres, any treatment that prevents telomere maintenance is a potential anti-cancer therapeutic8. The exact structure of DNA within telomeres remains an open and important question, particularly the structure of the single-stranded overhang. G-quadruplex structures were detected in vivo at the ends of human chromosomes through the use of a tritiated ligand that binds specifically to quadruplex DNA9 and through detection using a fluorescent carbazole derivative that binds selectively to quadruplex structures10–11. In 1991, Zahler and coworkers found that folding of a telomeric G-rich single strand in a DNA quadruplex structure inhibits in vitro telomerase activity12. Hence, small molecules that stabilize quadruplex structures within the telomere could effectively inhibit telomerase by blocking its binding to its substrate DNA and preventing elongation during replication13.
Current literature studies on G-quadruplexes formed by telomeric DNA and their interaction with pharmacologically interesting molecules are mostly limited to the analysis of the oligonucleotide sequence containing only four TTAGGG repeats, such as the d(TTAGGG)4 sequence or slight variants thereof that are capable of folding into a single quadruplex structure14–17. The human 200nt telomeric overhang contains longer repeats of the TTAGGG sequence that in principle can fold to form several consecutive quadruplexes. Very little is known concerning such multi-quadruplex structures, especially regarding the issue of whether the adjacent G-quadruplexes can stack on each other and how their interactions can affect the folding of each quadruplex unit. In particular, the knowledge of the quadruplex-quadruplex junction architecture could be extremely important for the understanding of telomere biology and for the rational design of a new class of telomeric binding drugs.
The main folding motifs reported for the short four repeat sequences that form three guanine tetrads in K+ solution are hybrid-1 and hybrid-2 which consist of three parallel guanine strands and one antiparallel strand, and the propeller quadruplex consisting of four parallel strands connected by propeller loops16. Very recently a new type of antiparallel quadruplex containing only two guanine tetrads was proposed based on NMR data18.
The hybrid and propeller quadruplexes provide efficient scaffolds for a compact-stacking multi-quadruplex structure of human telomeric DNA. Indeed, the 5′ and 3′-ends of these quadruplex structures point in opposing directions and additional hybrid-type or propeller quadruplexes can be linked end-to-end to form linear multi-quadruplex structures.
It has been reported based solely on a computational study19 of only one possible model that a stable multi-quadruplex structure can form from the propeller-type quadruplex,. However, we recently published preliminary results from a combination of molecular dynamics (MD) simulation and validating experimental approaches suggesting that the (TTAGGG)8TT telomeric sequence does not fold into two propeller-type quadruplexes but more likely forms two quadruplex structures with one having the hybrid-1 conformation and the other having the hybrid-2 conformation (we called this two-quadruplex model “Hybrid-12”)20. This result is significant because if the model is correct it implies that in longer telomeric sequences (containing more than two quadruplexes) there must be additional quadruplex-quadruplex junctions between the hybrid-type folds (such as hybrid-2-hybrid-1 or hybrid-2-hybrid-2). We report here the complete MD and experimental study of several model of the (TTAGGG)8TT telomeric sequence.
Initially, we present an extended MD study describing the dynamic properties of all the possible two-quadruplex models that can be obtained by combining hybrid-1 and hybrid-2 conformations. We named the resulting models: Hybrid-11 (5′-hybrid-1-hybrid-1-3′), Hybrid-22 (5′-hybrid-2-hybrid-2-3′), Hybrid-12 (5′-hybrid-1-hybrid-2-3′), Hybrid-21 (5′-hybrid-2-hybrid-1-3′). A model (named “all-propeller”) containing two propeller quadruplexes (5′-propeller-propeller-3′) was also studied for comparison with the hybrid-based models, despite reports that this propeller form is not the major species in solution21 and this type of multi-quadruplex structure seems improbable. The main structural features of each type of quadruplex-quadruplex junction are discussed. Subsequently, we present the experimental data obtained on the (TTAGGG)8TT telomeric sequence in K+ solution that allowed us to select, among all the possibilities, the most consistent structure in K+ solution. The critical point of our approach was to estimate, from the simulated models, physical properties that could be compared directly to the experimentally determined values, a comparison that tested the validity of the structural models and which allowed us to distinguish between alternate conformational forms in solution. We focused our attention on the hydrodynamic properties of the (TTAGGG)8TT sequence in K+ solution determined by analytical ultracentrifugation (AUC). Also, the solvent accessibility properties of the adenine bases were probed by fluorescence emission intensity and fluorescence quenching experiments using 2-aminopurine substituted oligonucleotides. The comparison of both the sedimentation and fluorescence properties with the corresponding properties predicted by the molecular models are consistent with the existence in solution of a two-quadruplex structure formed by the hybrid-1 quadruplex at the 5′-end and the hybrid-2 quadruplex at the 3′-end (corresponding to the Hybrid-12 model). This result validates our methodological approach and adds to previously limited knowledge of extended structure of telomeres.
Materials and Methods
Molecular Modeling
The two-quadruplex models were built using known single quadruplex structures as unique building blocks. The structures of the different conformations of the basic quadruplex units (hybrid-1, hybrid-2 and propeller quadruplexes) were obtained by using the coordinates of the reported NMR structures (PDB codes 2hy9 and 2jpz) and X-ray structure (PDB code 1kf1). The five two-quadruplex models for the (TTAGGG)8TT structure were generated by manually linking the 3′-end of one quadruplex unit with the 5′-end of the other quadruplex unit while maintaining sequence integrity. In each quadruplex unit two K+ ions were placed between the adjacent G-tetrad planes. In building the all-propeller model the G-tetrad plane of the two quadruplex units were allowed to stack directly on each other via G-tetrad:G-tetrad interactions and one additional K+ ion was placed between the two stacked quadruplexes. For all the hybrid-like models we generated a “stacked” conformation in which the quadruplex units were initially positioned to maximize the base stacking interactions between the loop bases and an “unstacked” conformation in which there were no direct stacking contacts between the loops of the two quadruplex units. Both the “stacked” and “unstacked” conformations were used as starting conformations for an independent MD run and the corresponding MD trajectories are indicated by an “S” or “U” at the end of the trajectory name (see Table 1 for the nomenclature of the MD trajectories).
Table 1.
Model names, descriptions, and main properties of the MD trajectories.
| Model | Quadruplex units | Trajectory Name | Initial conformation for MD trajectories | time (ns) | |
|---|---|---|---|---|---|
| 5′-end | 3′-end | ||||
| Hybrid-12 | Hybrid-1 | Hybrid-2 | Hybrid-12S | Stacked quadruplex units | 10 |
| Hybrid-12U | Unstacked quadruplex units | 50 | |||
| Hybrid-21 | Hybrid-2 | Hybrid-1 | Hybrid-21S | Stacked quadruplex units | 10 |
| Hybrid-21U | Unstacked quadruplex units | 10 | |||
| Hybrid-22 | Hybrid-2 | Hybrid-2 | Hybrid-22S1 | Stacked quadruplex units | 10 |
| Hybrid-22S2 | Stacked quadruplex units | 3 | |||
| Hybrid-22U | Unstacked quadruplex units | 10 | |||
| Hybrid-11 | Hybrid-1 | Hybrid-1 | Hybrid-11S | Stacked quadruplex units | 10 |
| Hybrid-11U | Unstacked quadruplex units | 10 | |||
| all-propeller | propeller | propeller | Propeller-S | Stacked quadruplex units | 10 |
The standard parm99.dat Amber force field was used22–23 and was modified using the frcmod.parmbsc0 parameter file24. The models were solvated in a 10 Å box of TIP3P water by using standard Amber 9.0 leap rules to hydrate the systems and potassium counterions were added for overall charge neutrality. The systems were heated slowly and equilibrated for 250 ps with gradual removal of positional restraints on the DNA following this protocol: (i) minimize water, (ii) 50 ps MD (T=100K) holding DNA fixed (100 kcal/mol Å−1), (iii) minimize water with DNA fixed (100 kcal/mol Å−1), (iv) minimize total system, (v) 50 ps MD (T=100 K) holding DNA fixed (100 kcal/mol Å−1), (vi) 50 ps MD (T=300 K) holding DNA fixed (100 kcal/mol Å−1), (vii) 50 ps MD (T=300 K) holding DNA fixed (50 kcal/mol Å−1), (viii) 50 ps MD (T=300 K) holding DNA fixed (10 kcal/mol Å−1),(ix) 50 ps MD (T=300 K) holding DNA fixed (1 kcal/mol Å−1). After the equilibration phase, an unconstrained production phase was then initiated and continued for 3–50 ns (see Table 1 for details). Production runs of 10 ns after final equilibrium were used to obtain the average structures (200 snapshots in the last 2 ns), which were fully minimized. Simulations were performed in the isothermal isobaric ensemble (P=1 atm, T=300 K). Periodic boundary conditions and the Particle-Mesh-Ewald algorithm were used. A 2.0 fs time step was used with bonds involving hydrogen atoms frozen using SHAKE. Molecular dynamics calculations were carried out with the AMBER program sander. The trajectories were analyzed using the PTRAJ module in AMBER and visualized using the Chimera program25. The hydrodynamic properties of the simulated models were computed using Hydropro526 and the distributions of the sedimentation coefficients were computed over the last 4 ns of each trajectories (400 snapshots in the last 4 ns of simulation). The Solvent Accessible Surface Area (SASA) values were computed using NACCESS 2.1.127 over the last 4 ns of the Hybrid-12S, Hybrid-21S, Hybrid-11S, Hybrid-22S and propeller-S trajectories.
MM-PBSA calculations
The energetic contributions to the stability of each model were computed using the MM_PBSA module in Amber 923. The analysis was performed on the Hybrid-12S, Hybrid-21S, Hybrid-11S, Hybrid-22S and propeller-S trajectories, with all the water molecules and the potassium ions (except the K+ ions inside the G-tetrads) stripped from the trajectories. The same amber force field used for the simulations was used to compute the gas-phase energies of the models, and the models entropies were computed using the NMODE in Amber 923. Solvation free energies were computed as sums of polar and nonpolar contributions using a continuum solvent model using 200 snapshots extracted from the last 4 ns of each production trajectory.
Electrostatic Potential Surfaces
The electrostatic potential derived surfaces were calculated using APBS28 with standard Amber charges and visualized on the molecular surfaces using VMD29 with red and blue values of −10kT/e and +10kT/e, respectively.
Preparation of DNA samples
The DNA oligonucleotides and the fluorescence analogs of the (TTAGGG)8TT were synthesized by IDT (Integrated DNA Technologies, Inc.) and used without further purification. All studies were done in 10 mM potassium phosphate, 100 mM KCl, 0.1 mM EDTA at pH 7.0. Oligonucleotide concentrations were determined from their absorbance measured at 90°C, in the same buffer, using the following molar extinction coefficients: ε(260 nm) = 505600 M−1 cm−1 for the (TTAGGG)8 TT; and 492600 M−1 cm−1 for the 2-aminopurine substituted oligonucleotides. The molar extinction coefficients were calculated by the nearest neighbor model30. The oligonucleotides were dissolved in buffer and then slowly heated in a water bath until the temperature reached 95 °C. The oligonucleotide solutions were allowed to equilibrate for 10 minutes at 95 °C and then were cooled overnight in the water bath. The samples were placed in a 4°C refrigerator for 48 hours before dialysis was performed. Samples were dialyzed using Pierce Slide-A-Lyzer® dialysis cassettes or Slide-A-Lyzer® MINI dialysis units (MWCO 3.5K) in a cold room (4°C). Oligonucleotides were then transferred to microfuge tubes and placed in a 4°C refrigerator until use.
Steady-state fluorescence spectra and quenching experiments
Fluorescence spectra at 20 °C were collected with a JASCO model FP-6500 fluorometer equipped with a Peltier temperature controller. Oligonucleotides were excited at 305 nm with a slit width of 5 nm and emission spectra collected from 320–460 nm. For the acrylamide quenching experiments, aliquots of a 4 M acrylamide stock solution were added to oligonucleotide solutions to span an acrylamide concentration range of 0–0.8 M, with fluorescence data collected using an excitation wavelength of 305 nm and an emission wavelength of 370 nm. Quenching data were analyzed in the form of Stern-Volmer plots in which the ratio of the fluorescence intensities in the presence and absence of quencher (F0/F) are plotted vs. [acrylamide].
Temperature-Dependent UV and Fluorescence Spectroscopy
The thermal stability of DNA folding was assessed by recording the absorbance at 295 nm with increasing temperature using an HP-8452A diode array spectrophotometer equipped with a Peltier temperature controller. Temperature was scanned in the range 10–90 °C at a heating rate of 1.0 °C/min. Fluorescence melting curves were obtained by monitoring fluorescence emission changes at 370 nm over a range of 10 to 90 °C at a heating rate of 1.0 °C/min and using an excitation wavelength of 305 nm and a slit width of 5 nm. Oligonucleotide melting temperatures were determined from first derivative plots of the melting curves.
Sedimentation velocity experiments
Sedimentation experiments were performed on the (TTAGGG)8TT sample at a temperature of 20 °C and a rotor speed of 60,000 rpm using a Beckman Optima XLA analytical ultracentrifuge equipped with absorbance optics and an An60TI rotor. Following loading and before data collection, samples were allowed to equilibrate for one hour after vacuum and temperature had been established. Data were collected at 260 nm as a function of radial position. Each centrifuge cell was scanned sequentially with zero time delay between scans until no further sedimentation was observed. For each sample, data were collected at three loading concentrations of A260(1.2 cm) ~ 0.25, 0.5 and 1. Primary sedimentation data were transferred to the program Sedfit for analysis31–32. Data were analyzed using a continuous c(s) model using a range of 0.5 to 10 S and a confidence level of 0.68 (1 standard deviation). Solution density and viscosity were calculated from buffer composition as 1.00419 g/mL and 1.0030 cP, respectively, using the program Sednterp33. A value of 0.55 mL/g was assumed for the partial specific volume. Fitting was performed using alternating rounds of the simplex and Marquardt-Levenberg algorithms until there was no further decrease in root mean square deviation. Data in the form of c(s) distributions were exported to Origin v7.0 (OriginLab Corporation, Northampton, MA) for graphing.
Results and discussion
Molecular dynamics simulations
Ten independent MD simulations were carried out to explore the possible structures of the human telomeric sequence (TTAGGG)8TT. Four two-quadruplex hybrid-1 and hybrid-2-based models were built starting from the monomeric known structures. One model formed by two stacked propeller-quadruplex was built based on the X-ray crystal structure of the monomeric unit34. Each model contains 50 nucleotides, with nucleotides 1–24 (numbering from the oligonucleotide 5′-end) belonging to the first quadruplex unit and nucleotides 28–50 belonging to the second quadruplex unit where the three nucleotide TTA (nucleotides 25–27) linker represents the connection between the two quadruplexes and maintains sequence integrity. Excluding this linker, each quadruplex has three loops, numbered starting from the 5′-end of each quadruplex (for example, the first loop of the second quadruplex is comprised of residues 31–33). We define two quadruplex units as “interacting” when there is close contact between the residues belonging to the different quadruplex units (excluding the bases of the connecting linker). It should be noted that, in most of the simulations, the bases of the connecting linker partially stack with each other with bases belonging to both quadruplex units. This increases the rigidity of the connecting linker and allows the two quadruplex units to remain close in space along the trajectories although not “interacting” as per our definition. For the models containing hybrid-1 and hybrid-2 we used at least two different starting conformations, one in which the two quadruplex units were interacting (stacked conformation) and another one in which the quadruplex units were not interacting (unstacked conformation). A summary of the models and MD trajectory names, type of quadruplex units forming the two-quadruplex models, starting conformations, and simulation times is provided (Table 1).
The potential, kinetic, and total energies for all the MD trajectories were stable throughout the production dynamics runs indicating system stability over this time period (Supplementary Figure S1). The time evolution of the root mean square deviation (rmsd) for all the simulations with respect to the starting structures was analyzed. For each model, we compared the rmsd from the all-atoms model with the corresponding rmsd of backbone-only atoms and with the rmsd of each quadruplex unit inside the model (Supplementary Figure S2). The rmsd of the all-atoms and backbone-only atoms are higher than that of the individual quadruplex units and in all the simulated models (except the all-propeller model) show high absolute values and high fluctuations over the trajectories. This behavior is because of the relative motion of the two quadruplex units that in several cases evolved into a new conformation vastly different from the starting conformation. However, the individual quadruplex units were stable and maintained integrity during all simulations as evidenced by the small variation of their individual rmsd value over the trajectories. Specifically, for all the models, the G-tetrad core of each quadruplex unit and the network of Hoogsteen hydrogen bonds and G-tetrad stacking interactions were maintained during the simulation time. Further, in all the simulations the K+ ions were retained within the quadruplex units.
Despite the flexibility of each model, we observed for all the stacked trajectories (Hybrid-11S, Hybrid-21S, Hybrid-22S1, Hybrid-12S and propeller-S) the progression to a well maintained final conformation as further suggested by the all-atoms rmsd plots computed with respect to an average structure extracted from the last 2 ns of each trajectory (Figure 2Sc). Particularly, in the last 4 ns of these trajectories we observed that the relative orientation of the two quadruplex units is maintained and no major conformational changes are observed. The average structures computed on the last 2 ns of these trajectories are shown in Figure 1. These conformations were used as representative for each model for further structural comparison. Remarkable differences among overall conformations and in the interface between quadruplexes were observed (Figure 1). For example, it was clearly evident that the Hybrid-12 and Hybrid-21 models are not equivalent. In the Hybrid-12 model there is an interaction between the third loop of the hybrid-1 quadruplex and the second loop of the hybrid-2 quadruplex, whereas in the Hybrid-21 model there is an interaction between the third loops of both quadruplex units. It is also evident that Hybrid-11 and Hybrid-22 structures are quite different from each other and with respect to the mixed-type structure (Hybrid-12 and Hybrid-21). Hybrid-11 shows a bending between the quadruplex units stabilized by a specific interaction between dA residues whereas the Hybrid-22 model does not show any significant interaction between the quadruplex units. Finally, all the hybrid-type structures are different from the all-propeller model that has extensive quadruplex-quadruplex stacking interactions directly mediated by G-tetrads. This is to be expected for models of this type because of the initial stacking of the two propeller quadruplexes to maximize direct G-tetrad:G-tetrad interactions, resulting in a possibly artificially stable form. The all-propeller model is the most compact one with an average 5′-to-3′ distance of 32 Å whereas for all the other models this distance is in the range 42–52 Å (Table S1).
Figure 1.

Representative structures of the five two-quadruplex models. The structures are the time-averaged structures computed over the last 2 ns of the Hybrid-12S, Hybrid-21S, Hybrid-11S, Hybrid-22S and propeller-S trajectories. The G-tetrads bases are shown in green. For clarity the loops bases are not shown. For the Hybrid12, Hybrid-22 and Hybrid-11 models the dT (blue) and dA (red) residues involved in quadruplex-quadruplex interactions are also shown. The strand orientation is shown by the black arrow on the left.
To further explore the difference between all the possible structures, the electrostatic potential-derived molecular surfaces of the models were calculated and visualized (Figure 2). As expected, the electrostatic potential is mainly dominated by the negatively charged DNA backbone for all the structures. However, substantial differences in the shape and potential of the junction regions between the quadruplex units were observed. The all-propeller model appears to have the highest negative potential in the grooves at the quadruplex-quadruplex interface. As each quadruplex-quadruplex junction is a unique conformation, the molecular surfaces are considerably different, which has significant implications for structure-based drug design. For instance, Hybrid-11, because of the bending of the two quadruplex units, presents an accessible planar surface corresponding to an A-triad structural motif that is not present in the other models.
Figure 2.

Electrostatic potentials mapped on the solvent-accessible surfaces are shown for all the structures in Figure 1. Red represents negative regions, white represents neutral regions and blue represents positive regions.
The flexibility of each model and the dynamics of the quadruplex-quadruplex interaction are greatly different amongst the models, with some of the models being more rigid whereas others undergo a major conformational change during the simulation time before reaching a stable conformation. The main properties of each MD simulation are discussed individually in the following sections.
MD simulation of the Hybrid-11 model
The main feature of the Hybrid-11S trajectory is that the initial structure undergoes a major conformational change during the simulation time (Figure 3A). In the initial starting structure, the stacking interactions between the A15 and A33 bases were maximized, thus establishing strong interactions between the second loop of one quadruplex unit and the first loop of the other quadruplex unit (Figure 3A, left). This interaction is completely lost in the first 3 ns of dynamics during which there is a major conformational change of the structure, as shown by the high rmsd variation (Supplementary Figure S2). From 3 ns onwards, a new conformation is observed that is stabilized by an A-triad formed by three coplanar adenine bases (A15, A27 and A45) belonging to the different quadruplex units (Figure 3A, right). These adenine bases mediate the interaction between the second loop of the 5′-quadruplex and the third loop of the 3′-quadruplex. Further, an A-tetrad with the participation of the A33 base to the preexisting A-triad is formed between 3 ns and 4 ns of the trajectory. One characteristic feature of this conformation is the intrinsic bending of 140 degrees with respect to the two quadruplex helical axes (an angle of 180 degrees is defined as a conformation where the two quadruplex axes are parallel to each other and point in the same direction 5′-3′). The simulation was repeated starting from a different conformation (Hybrid-11U) in which the two quadruplex units were not initially interacting (Supplementary Figure S3, left). Interestingly, during this 10 ns trajectory Hybrid-11S converged toward a conformation very similar to the one obtained with the first simulation, thus indicating that it is a particularly stable conformation for the Hybrid-11 model (compare supplementary Figure S3, right with Figure 3A, right).
Figure 3.
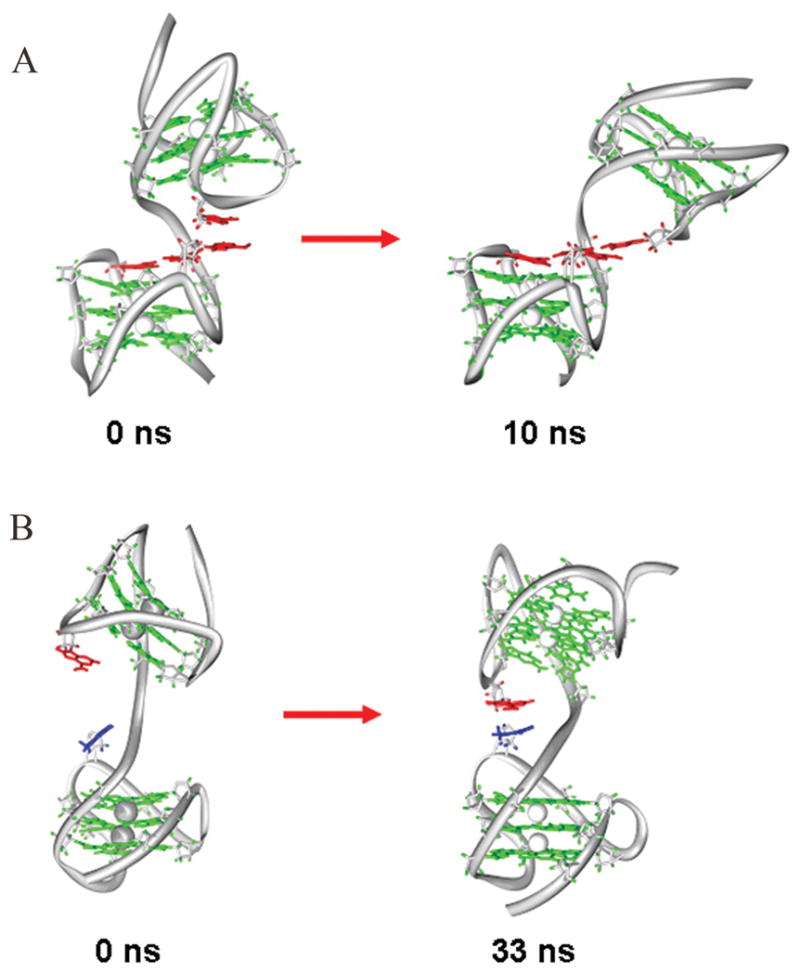
Major conformational changes occurring in MD trajectories. A) Hybrid-11S trajectory: initial (left) and after 10 ns of free MD (right). B) Hybrid-12U trajectory: initial structure (left) and after 33 ns of free MD dynamics (right). Residue colors: green for G-tetrads, red for adenine bases and blue for thymine bases. For clarity, loop residues that are not involved in quadruplex-quadruplex interactions are not shown.
MD simulation of the Hybrid-12 model
The Hybrid-12 average structure over the last 2 ns of dynamics is shown in Figure 1. In the Hybrid-12 model strong stacking interactions form between the third loop of the hybrid-1 quadruplex and the second loop of the hybrid-2 quadruplex. In particular, A15 forms stable stacking interactions with T38 and T25 for 95% of the trajectory. The distance between the centers of T38 and T25 over the trajectory is ~ 4 Å (Figure 4). Among all the hybrid-like models Hybrid-12 has the smallest fluctuations in the all-atom rmsd along the trajectory (Figure S1). This is because of a more stable linkage between the two quadruplex units inside the overall structure.
Figure 4.

Stability of stacking interactions at the quadruplex-quadruplex interface as assessed by the distance between A15 and T38 rings throughout the Hybrid-12S trajectory.
To assess the relevance of this conformation in the possible Hybrid-12 conformational space we carried out a second simulation of the Hybrid-12 model starting from an unstacked conformation in which the two quadruplex units do not interact (Figure 3B, left). In this case a 50 ns simulation was performed to sample greater conformational space. To monitor the formation of a stacked conformation (similar to the one observed in the Hybrid-12S trajectory) we calculated the T38-A15 distance over the trajectory (Supplementary Figure S4). Remarkably, we observed several periods where the third loop of the hybrid-1 quadruplex approached the second loop of the hybrid-2 quadruplex. The initial A15-T38 distance was 15 Å, corresponding to a completely non-interacting unit, and at 32 ns we observed formation of the stacked conformation (Figure 3B, right) with a A15-T38 distance of ~ 4 Å that persisted for more than 2 ns, thus suggesting that this is a possible stable conformation for the Hybrid-12 model.
MD simulation of the Hybrid-21 model
The initially stacked form of Hybrid-21 (Hybrid-21S trajectory) underwent a major conformational change in the first 2 ns of MD in which most of the initial interactions between the two quadruplex units were lost. After 2 ns the hybrid-21 conformation is characterized by a strong hydrogen bond between the N-H group of T44 and the phosphate of the T26. This bond remains stable for 95% of the remaining trajectory and keeps the second loop of the hybrid-1 quadruplex close to the 3′-end of the hybrid-2 quadruplex (Figure 1). Several other hydrogen bonds and stacking interactions also contribute to the inter-quadruplex interactions along the MD trajectory. We observed, from 2 to 5 ns, a stable hydrogen bond between O4 of T43 and N6 of A9 residue and another hydrogen bond between a phosphate oxygen of the T43 residue and the N3 atom of the T19 residue between 1 to 5ns of MD simulation. The concerted loss of these two hydrogen bonds in the interval between 4.5 and 6 ns is responsible for another major conformational change with a variation in the relative quadruplex orientation. This change is the source of the fluctuation observed between 4 and 6 ns in the all-atoms rmsd (Figure S1). We also calculated a trajectory starting with an unstacked conformation in which the two quadruplexes were not interacting (Hybrid-21U trajectory). For the first nanosecond of simulation the two quadruplex units remain close in space because of the stacking interaction between T25 in the connecting linker and T44 of the second quadruplex. This interaction was lost after 1 ns, resulting in greater flexibility of the connecting linker and increasing quadruplex-quadruplex distance. No other interaction between the two quadruplexes was observed for the remaining simulation time. Interestingly the Hybrid-21S and Hybrid-21U trajectories did not converge toward the same conformation. The Hybrid-21S trajectory results in a structure that is more compact and exhibits greater quadruplex-quadruplex interactions. This structure may be more representative of the Hybrid-21 model.
MD simulation of the Hybrid-22 model
In the Hybrid-22 model, we observed that if the conformation of the loops in the individual quadruplex units was preserved, it was not possible to establish good stacking interactions between the two quadruplex units. Therefore, we manually maximized interactions between the linker loop and the two quadruplexes. The starting structure of the Hybrid-22S simulation had a stacking interaction between T25 (base of the linker loop) and T38 (second loop of the quadruplex unit at the 3′-end). However, this interaction was completely lost during the first nanosecond of simulation and was followed by a large change in the relative orientation of the two quadruplex units as shown by the large variation of the rmsd over the first 1 ns of dynamics (Supplementary Figure S2b). For the remaining 9 ns of simulation time the two quadruplex units remain non-interacting and exhibited high relative mobility. There is a correlation between the observed rmsd fluctuations and the changes in the relative orientation of the two quadruplex units as measured by the angle between the two helical axes (Figure 5). Overall for the Hybrid-22 models, the two quadruplex units appear completely independent over most of the simulation time. Again, to test this we ran a 3 ns simulation starting from a different geometry of the Hybrid-22 model (Hybrid-22S2), in which we maximized contact between the second loop of the 5′-end quadruplex and the third loop of the 3′-end quadruplex. We introduced stacking interactions between T38 and A45. This simulation also quickly converges towards a structure in which all the inter-quadruplex interactions are lost (data not shown). To further explore the conformational space of the Hybrid-22 model we ran an MD simulation starting from a random unstacked conformation (Hybrid-22U). No interaction between the two quadruplex units was observed in this trajectory. In summary, all of the simulations suggest that the two hybrid-2 quadruplexes are non-interacting.
Figure 5.

Correlation between the rmsd variation and the relative orientation of the two quadruplex units. The all atom rmsd fluctuations (top) and variations in the angle (θ) between the helical axes of the two quadruplex units (bottom) in the Hybrid-22S1 trajectory.
MD simulation of the all-propeller model
The main features of the simulation of the all-propeller model are fully consistent with those reported from a previous computational study19 on a similar structural model containing 45 nucleotides (5 less then the oligonucleotide simulated in this study). As evident from the rmsd plots, after the initial relaxation of the starting model (first 1 ns), no major conformational changes are observed during the remainder of the trajectory (Figure S2). The lower fluctuations observed for the all-atom rmsd in comparison with the hybrid-like models is because of the higher rigidity of this model in which the quadruplex units directly interact through the large stacking surfaces of two G-tetrads.
Energetics of the multi-quadruplex models
To provide an estimate and comparison of the different models stabilities, we carried out energetic analysis on the “stacked” trajectories (Hybrid-11S, Hybrid-21S, Hybrid-22S1, Hybrid-12S and propeller-S). The energetic contributions to the total absolute free energy for each model are reported in Table 2. The total free energy of each model is given by the sum of the solute free energy and the solvation free energy. The solute free energy is estimated as the sum of the internal energy and the solute entropic term, whereas the solvation free energy is estimated as sums of polar and nonpolar contributions using a continuum solvent representation (see methods for details). As expected, for all the models there is an unfavorable contribution to the free energy from the solute electrostatic energy but this is overcome by the favorable electrostatic component of the solvation free energy. This effect is greater for the all-propeller model, probably because of the greater condensed negative electrostatic potential compared with the other models. Further, a favorable contribution was found for the van der Waals energy for all models. The absolute total entropic terms of the models are similar and in the range 1298.71 and 1317.59 kcal/mol, thus giving a favorable contribution to the total free energy. All of the models have negative absolute total free energy suggesting that all are potentially thermodynamically stable at room temperature. Although the all-propeller model has the greatest negative free energy value it should be noted that this model has one more K+ cation between the stacked quadruplexes and it is inappropriate to directly compare the free energy value with the other models. The hybrid-based models have very similar free energy values close to the error in the free energy calculations. These findings suggests that the free energy barriers between the different two-quadruplex structures are very small which is also consistent with the low free energy barrier reported for the different conformations of the single quadruplex unit folding35.
Table 2.
| Model | Hybrid-11 | Hybrid-22 | Hybrid-12 | Hybrid-21 | all-propeller |
|---|---|---|---|---|---|
| ΔEELE | 7971.7 (155.1) | 7827.7 (137.6) | 7889.6 (104.1) | 8221.76 (111.7) | 8989.0 (122.2) |
| ΔEVDW | −488.7 (16.5) | −536.4 (19.5) | −512.1 (20.2) | −518.8 (19.1) | −496.5 (16.9) |
| ΔEINT | 2423.3 (28.8) | 2464.6 (29.2) | 2459.9 (31.8) | 2420.8 (28.2) | 2414.2 (26.7) |
| ΔEGAS | 9906.4 (154.7) | 9755.8 (133) | 9837.3 (96.6) | 10123.8 (113.4) | 10906.8 (121.2) |
| ΔESOLV-NP | 65.5 (0.8) | 61.8 (1.0) | 64.1 (1.1) | 61.6 (1.2) | 64.6 (0.8) |
| ΔESOLV-ELE | −19303.9 (147.6) | −19133.2 (128.1) | −19201.6 (95.9) | −19507.6 (106.3) | −20367.8 (120.2) |
| ΔESOLV-TOTAL | −19238.4 (148.0) | −19071.4 (128.7) | −19137.5 (96.3) | −19445.9 (106.7) | −20303.2 (120.3) |
| ΔETOTAL-ELE | −11332.2 (20.3) | −11305.6 (23.7) | −11312.1 (19.3) | −11285.8 (21.17) | −11378.8 (35.9) |
| ΔTSTOT | 1310.6 (9.4) | 1294.7 (8.5) | 1301.6 (9.4) | 1298.7 (9.1) | 1317.6 (9.2) |
| ΔGTOTAL | −10439 (29) | −10408 (31) | −10408 (31) | −10427 (34) | −10472 (27) |
ΔEELE = electrostatic energy, ΔEVDW = van der Waals energy, ΔEINT = internal energy, ΔEGAS =ΔEELE + ΔEVDW + ΔEINT, ΔESOLV-NP = non polar contribution to the solvation energy, ΔESOLV-ELE = polar contribution to the solvation energy, ΔESOLV-TOTAL = total solvation energy, ΔETOTAL-ELE = ΔEELE + ΔESOLV-ELE = total electrostatic energy, ΔTSTOT = solute entropy.
The errors are given in parentheses as the standard deviations from the mean value.
All the values are expressed in kcal/mol
Molecular dynamics summary
Several models of higher-order human telomere structures have been suggested16,19,36; however, a detailed MD study has only been published for the propeller conformation. This has limited our current knowledge to only one type of possible quadruplex-quadruplex junction. In the current study we report for the first time MD simulations of several reasonable quadruplex-quadruplex junctions obtained by combining the hybrid-1 and hybrid-2 conformations. The results are significant as they reveal some important general conformational features for each type of quadruplex-quadruplex interface. The hybrid-1-hybrid-1 junction (Hybrid-11 model) has a preferred conformation that introduces bending between the two hybrid-1 quadruplex units. Two consecutive hybrid-2 quadruplexes (Hybrid-22 model) appear not to stack with good inter-quadruplex interactions. Interestingly, in the presence of both the hybrid-1 and hybrid-2 folds, different properties were observed when these two conformations were positioned in alternate order with respect to the polarity of the single strand (Hybrid-12 or Hybrid-21 models). Further, we observed for the Hybrid-11, Hybrid-12, and Hybrid-22 models that trajectories starting from different initial conformations converge towards a similar final conformation, suggesting that these are possible stable conformations for these models.
In the case of the Hybrid-12 model, we observe that starting from an unstacked form, with a trajectory of sufficient length, a stable stacked form can be sampled without any artificial restraints or guidance. This converged stacked form is particularly stable when chosen as a starting conformation of the MD run. This result is particularly significant as this conformation was shown to be the most consistent with the experimentally observed properties (see next section).
Experimental evaluation of the models
To discriminate between the proposed solution models of (TTAGGG)8TT, we compared physical properties predicted by the models with the measured experimental values. This comparison critically tested the validity of the structural models and thereby allowed us to distinguish between the alternate conformational forms.
First we tested the ability of the models to predict the hydrodynamic properties of (TTAGGG)8TT in K+ solution using analytical ultracentrifugation. For this oligonucleotide, we found an experimental sedimentation coefficient s, of 2.99 ± 0.01 S. This value was independent of the loading concentration, suggesting that the DNA does not form intermolecular complexes under these conditions (supplementary Figure S5). In Table 3 we compare the experimentally determined value of the sedimentation coefficient with values calculated from each MD trajectory. Interestingly, the structures corresponding to the Hybrid-12S, Hybrid-21S and propeller-S trajectories show very similar calculated sedimentation coefficients that are close to the experimental value. All of these calculated structures correspond to a compact structure consisting of interacting quadruplex units. The trajectories of the Hybrid-22 (Hybrid-22S and Hybrid-22U) and Hybrid-11 models (Hybrid-11S, Hybrid-11U) have lower sedimentation coefficient values (< 2.9 S) that differ by more than 0.1 S compared with the experimental value. For each model, excluding Hybrid-21, both the “stacked” and “unstacked” trajectories predict very similar sedimentation coefficients. This can be explained by the fact that both trajectories converge toward a similar structure. Interestingly, the Hybrid-21U trajectory predicts the lowest sedimentation coefficient among all the simulations and differs from that predicted from the corresponding “stacked” trajectory (Hybrid-21S). The Hybrid-21U trajectory did not converge toward the Hybrid-21S representative structure but rather toward a structure in which the two quadruplex units are maximally separated, thus indicating that the calculated sedimentation coefficient is a good measure of the compactness of the structure. It should be noted that the experimental sedimentation coefficient is higher than all the computed values. These findings suggest a compact structure of interacting quadruplex units for the (TTAGGG)8TT structure and point toward one of the Hybrid-12, Hybrid-21 or all-parallel models. However, previously we showed that the CD properties of (TTAGGG)8TT sequence in K+ solution were not consistent with an all-propeller model20.
Table 3.
Computed sedimentation coefficients from the MD trajectories*
| Main model and simulation name | Sedimentation Coefficient (svedberg) |
|---|---|
| Hybrid-12 | |
| Hybrid-12S | 2.92 ± 0.06 |
| Hybrid-12U | 2.90 ± 0.08 |
| Hybrid-21 | |
| Hybrid-21S | 2.92 ± 0.07 |
| Hybrid-21U | 2.72 ± 0.08 |
| Hybrid-22 | |
| Hybrid-22S | 2.85 ± 0.06 |
| Hybrid-22U | 2.80 ± 0.05 |
| Hybrid-11 | |
| Hybrid-11S | 2.88 ± 0.08 |
| Hybrid-11U | 2.87 ± 0.07 |
| all-propeller | |
| Propeller-S | 2.95 ± 0.06 |
| Experimental value | 2.99 ± 0.01 |
The reported s values correspond to the maximum of the sedimentation coefficient distributions obtained from the last 4 ns of each MD trajectory and the errors reported are the standard deviation.
Probing the (TTAGGG)8TT structure using the photophysical properties of the 2-AP base
The (TTAGGG)8TT sequence has eight adenine bases, each dA being in a specific loop of the two-quadruplex structure. Figure 6 shows the environment of the adenine bases for each specific model. The environment of the equivalent adenine base in the different topologies differs depending on the folding adopted by the two-quadruplex structure. In particular, different adenine bases are involved in the junction region between the two quadruplexes depending on the model considered. The bases that interact with each adenine residue for each model are summarized in Table 4. In the all-propeller model, all the adenines are equivalent and interact directly with a thymine base whereas in the hybrid-like models the adenines present a different pattern of interactions involving one or two neighboring bases depending on the adenine position and the model. The computed solvent accessible surface area (SASA) values for each dA residue for all the models is reported in Table 5. There is an obvious connection between the environment based on topology and the SASA, for example, adenines involved in more interactions have smaller SASA values.
Figure 6.

Dependence of the local environment of each adenine base on the particular model. The different adenine bases are shown in different colors which indicate the position of the 2-AP substitutions as specified in the sequence at the bottom.
Table 4.
Patterns of the stacking interactions formed by the adenine bases for each model.a
| Model | A3 | A9 | A15 | A21 | A27 | A33 | A39 | A45 |
|---|---|---|---|---|---|---|---|---|
| Hybrid-12 | +G22 | +T8 | +T24 +T38 |
+G18 +T20 |
+G28 +T26 |
+G42 | +G40 +A45 |
+A39 |
| Hybrid-22 | +G4 +T2 |
+G18 | +A21 | +A15 | +G28 +T26 |
+G42 | +G40 | - |
| Hybrid-21 | +G4 +T2 |
+G18 | +G16 | - | +G28 | +T32 | +T50 | +G42 +T44 |
| Hybrid-11 | +G4 +T2 |
+T7 | +T26 | +G18 +T20 |
+G28 +T44 |
- | +T50 | +G46 +T44 |
| all-propeller | +T1 | +T7 | +T13 | +T19 | +T25 | +T31 | +T37 | +T43 |
The base that forms stacking interactions with each particular adenine is specified by the symbol + “base type, base number”. The symbol - means no stacking interactions for that particular adenine base.
Table 5.
Calculated Solvent Accessible Surface Area (Å2) of the dA residues*
| Model | Adenine number | |||||||
|---|---|---|---|---|---|---|---|---|
| A3 | A9 | A15 | A21 | A27 | A33 | A39 | A45 | |
| Hybrid-12 | 145 ± 15 | 242 ± 20 | 135 ± 16 | 150 ± 13 | 142 ± 8 | 190 ± 7 | 140 ± 16 | 242 ± 28 |
| Hybrid-22 | 150 ± 9 | 215 ± 5 | 165 ± 18 | 230 ± 10 | 145 ± 8 | 225 ± 12 | 200 ± 15 | 360 ± 16 |
| Hybrid-21 | 130 ± 20 | 172 ± 8 | 173 ± 12 | 210 ± 15 | 184 ± 15 | 185 ± 17 | 248 ± 14 | 125 ± 8 |
| Hybrid-11 | 174 ± 13 | 215 ± 20 | 164 ± 21 | 150 ± 17 | 120 ± 16 | 285 ± 25 | 233 ± 16 | 135 ± 12 |
| all-propeller | 265 ± 10 | 223 ± 9 | 225 ± 10 | 221 ± 11 | 261 ± 23 | 260 ± 20 | 243 ± 17 | 262 ± 19 |
The reported values are the average over the last 4 ns of each trajectory. The error corresponds to the standard deviation. All the values are in Å2.
These findings suggest that a method sensitive to the adenine environment would be a practical tool for an evaluation of (TTAGGG)8TT folding. We therefore explored the environment of each adenine by quantitative fluorescence studies using systematic single-substitutions to replace each of the eight adenine bases with 2-aminopurine (2-AP). The fluorescence properties of 2-AP are extremely sensitive to local environment (conformation), making this base analogue ideal for distinguishing among the proposed models.
Both steady-state fluorescence and quenching experiments were performed in K+ solutions. The nomenclature of the 2-AP-substituted oligonucleotides is shown in Figure S6. These experiments provide a quantitative measure of the environment of the loop adenines. Figure 7 shows the steady-state fluorescence properties of 2-AP-substituted oligonucleotides for the folded state (at 20 °C) and for the unfolded state (at 95 °C). There are remarkable differences in the fluorescence intensities at 20 °C as a result of the different environments of each 2-AP in the folded state. As expected, similar fluorescence properties are observed for the unfolded oligonucleotides at 95°C, which serves as a control. In the experimental structure, 2-AP fluorescence is most quenched for AP15 and AP39 and least quenched for AP9, AP33, and AP45 (which show very similar fluorescence intensities); AP21 and AP27 show intermediate fluorescence intensities. AP3 (corresponding to the modified oligonucleotide with the 2-AP base situated near the 5′-end of the structure) shows the highest fluorescence intensity.
Figure 7.

Dependence of 2-AP fluorescence on the 2-AP local environment. Steady state fluorescence experiments at 20 °C (left) and 95 °C (right) for all the oligonucleotides containing 2-aminopurine. The colors indicate the position of the 2-aminopurine substitution as shown in Figure 6. The fluorescence spectra at 20 °C (Panel on the left) are from the reference [20].
The trend in fluorescence intensities is consistent with the adenine environment found in Hybrid-12 model (Table 4). In this model, the adenine bases can be qualitatively grouped into two classes based on the different number of stacking interactions: A3, A9, A33 and A45 form stacking interactions with only one other base and have one side exposed to the solvent, whereas A15, A21, A27 and A39 form stacking interactions with two bases and do not appear to be exposed directly to the solvent. The 2-AP-containing oligonucleotides corresponding to the first class of adenine positions (AP3, AP9, AP33 and AP45) have the highest fluorescence intensity, whereas the 2-AP-containing oligonucleotides corresponding to the second class (AP15, AP21, AP27 and AP39) show the lowest fluorescence (Figure 7). We note that none of the other models is compatible with all of these steady-state fluorescence intensities.
The key bases that discriminate between models are A39, which has a low SASA only for the Hybrid-12 model, and A45, which has a low SASA value only for the Hybrid-11 and Hybrid-21 models (Table 5). The finding of high AP45 fluorescence intensity strongly suggests that Hybrid-11 and Hybrid-21 conformations are not representative of the actual structure in solution. On the other hand, the all-propeller model predict very similar fluorescence properties for all the 2-AP bases; this prediction is in direct contrast with our experimental observation, thereby eliminating this model as a possible structure in solution.
To corroborate the steady-state fluorescence results, we performed fluorescence quenching experiments (Figure 8) on all the substituted oligonucleotides, using acrylamide as a collisional quencher. The results of these experiments reflect the accessibility of 2-AP bases to the quenching agent and can be compared with the SASA values (Table 5) computed from the simulated models. The expected trend of 2-AP solvent accessibility for each model and comparison with the results of the quenching experiments is shown in Figure 8. The hybrid-12 model presents the best correlation between the predicted and the observed 2-AP solvent accessibilities. The sum of the squared deviation between the observed and predicted quenching is 0.235 for this model whereas it is in the range 0.335–0.752 for all other models. The predicted SASA pattern for the Hybrid-21, Hybrid-11 and the all-propeller model disagree with the quenching results. It should be noted that the Hybrid-22 SASA pattern appears close to the experimental one, but reveals that this model does not match the experimental behavior, for example it should predict for the A39 base a significantly higher accessibility in comparison with the one predicted for the A27 and A3 bases and this was not observed experimentally.
Figure 8.

Stern-Volmer plots of the collisional quenching of 2-AP fluorescence by acrylamide (first panel, top left) and correlation of computed SASA values (black line) for all the models with the experimental collisional quenching results (red line). The data presented in panel A are from the reference [20].
These results allow us to exclude the Hybrid-11, Hybrid-21, Hybrid-22 and all-propeller models as possible candidates for the (TTAGGG)8TT structure and strongly suggest a structure formed by a hybrid-1 quadruplex unit at the 5′-end and a hybrid-2 quadruplex unit at the 3′-end (corresponding to the Hybrid-12 model) as the major conformation in K+ solution.
Fluorescence melting and UV melting
To gain further insight into the adenine structural properties, we observed the fluorescence melting of each 2-AP modified sequence (Supplementary Figure S7). These melting experiments can monitor local structural events contributing to the overall melting process and can provide additional information about the environment of the adenine residues. The overall melting process of the (TTAGGG)8TT structure was also followed by UV spectroscopy (Supplementary Figure S8). The (TTAGGG)8TT UV-melting curve has a sigmoidal shape and shows a hypochromic effect at 295 nm, consistent with previous reports for similar sequences37. The overall (TTAGGG)8TT melting appears to be monophasic with a Tm of 55 °C. It was only possible to obtain well-defined fluorescence melting curves for the AP15 and AP39 derivatives (Figure 9). As the temperature increased, there is a gradual decrease in the fluorescence intensity up to ~ 40 °C, followed by a sharp increase in intensity in the 40–60 °C temperature range, and a further gradual decrease above 60 °C. These fluorescence changes clearly indicate the environmental changes that 2-AP experiences during temperature-induced unfolding. These findings suggest that these two bases are well-stacked in the folded state and undergo a cooperative transition on melting.
Figure 9.
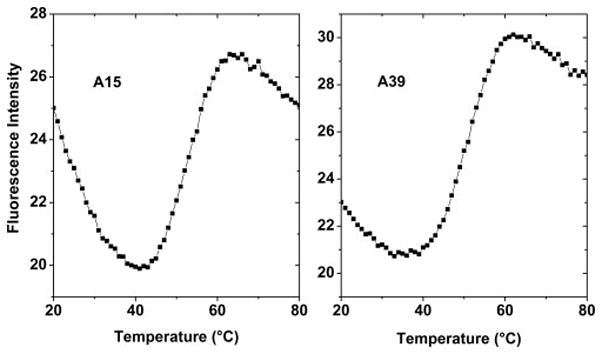
Fluorescence melting curves of AP15 (left) and AP39 (right).
Interestingly, the AP15 and AP39 fluorescence melting curves have an identical Tm of ~ 50 °C that is ~ 5 °C lower than the melting temperature of the entire structure. These findings are consistent with the structural features of the Hybrid-12 model, as both A15 and A39 in this model are positioned between two neighboring bases (Table 4) and are not directly exposed to the solvent. Further, the Hybrid-12 model is the only model that has A15 and A39 close in space (Figure 6), with both located near the quadruplex-quadruplex interface. This provides a likely explanation of their very similar melting behavior. These inter-quadruplex interactions could be lost before melting of the individual quadruplex units, thereby equating to the lower melting temperature (50 °C) observed for AP15 and AP39 melting in comparison with the overall melting temperature (55 °C). It should be noted that the difference in melting temperature values obtained from the different techniques (UV and fluorescence spectroscopy) clearly indicates that the overall melting process is not a two-state process as could be inferred from a consideration of only the UV-melting profile.
Experimental results summary
In summary, all experimental data are consistent with a (TTAGGG)8TT structure in which the first quadruplex unit with respect to the 5′-end is a hybrid-1 quadruplex followed by a hybrid-2 quadruplex (Hybrid-12 model). In particular, the measured sedimentation coefficient of 2.99 ± 0.01 S is very close to the calculated value of 2.92 ± 0.06 S estimated from the Hybrid-12 model and is fully compatible with the compactness of the corresponding structure. The solvent accessibilities of the adenine bases as measured by steady-state and quenching fluorescence experiments are also consistent with those expected for the Hybrid-12 model. Furthermore, in our previous paper, we showed that the CD spectrum of (TTAGGG)8TT in K+ solution is consistent with the presence of both hybrid-1 and hybrid-2 conformations in the overall structure. None of the other models simulated in this study are as fully consistent with the entire set of experimental data.
Insight into the multi-quadruplex structures and their importance in the biology of human telomeres
A number of short DNA telomeric sequences have been reported to form a mixture of hybrid-1 and hybrid-2 conformations in K+ solution, suggesting that the energy barrier between these two conformations is small. It is also known that the relative populations of each conformation depends on the 3′-flanking sequences16. It remains an open question if this behavior is valid for the folding of longer telomeric sequences. In multi-quadruplex formation, quadruplex-quadruplex interactions could play a critical role in determining the specific folding adopted by single quadruplex units and the exact nature of the 3′-flanking bases could play a different role than in shorter telomeric sequences.
Exploring the roles of the longer telomeric DNA folding represents a significant challenge for future studies. We show in the present work that because of the asymmetry of the hybrid-type G-quadruplex structure, four different quadruplex-quadruplex junctions are possible, each characterized by specific shape, electrostatic and dynamic properties. A multi-quadruplex structure formed by only one type of hybrid should have only one type of junction (Hybrid-22 or Hybrid-11). The presence of the Hybrid-12 motif in telomeric sequences with more than two quadruplex units implies the presence of either both the Hybrid-12 and Hybrid-21 junctions. Thus, the existence of the mixed-hybrid multi-quadruplex instead of a mono-hybrid multi-quadruplex could provide a better means to affect protein recognition and regulation of telomere biology. Further, the absolute free energy calculations reported here (Table 3) suggest that the energy barriers between different conformations (Hybrid-11, Hybrid-22, Hybrid12, Hybrid-21 and all-propeller) may be small and thus an equilibrium between different forms could be very sensitive to the local microenvironment as well as to the binding of small molecules to a particular quadruplex-quadruplex junction.
In summary, we provide experimental evidence that the (TTAGGG)8TT sequence preferentially forms a higher-order G-quadruplex structure in which the two quadruplex units have different folding motifs. The two quadruplexes form a characteristic hybrid1-hybrid2 interface stabilized by stacking interactions. The quadruplex-quadruplex junction represents a unique binding site for ligands and could be used for the design of a new class of telomeric-specific DNA drugs.
Supplementary Material
Acknowledgments
This research was funded by the Associazione Italiana per la Ricerca sul Cancro (A.I.R.C. project n° 6255) and by NIH RO1 GM077422 and NIH/NCRR 5P20RR018733.
References
- 1.Blackburn EH. Nature. 1991;350:569–573. doi: 10.1038/350569a0. [DOI] [PubMed] [Google Scholar]
- 2.Rhodes D, Giraldo R. Curr Opin Struct Biol. 1995;5:311–322. doi: 10.1016/0959-440x(95)80092-1. [DOI] [PubMed] [Google Scholar]
- 3.Bryan TM, Cech TR. Curr Opin Cell Biol. 1999;11:318–324. doi: 10.1016/S0955-0674(99)80043-X. [DOI] [PubMed] [Google Scholar]
- 4.Harley CB, Futcher AB, Greider CW. Nature. 1990;345:458–460. doi: 10.1038/345458a0. [DOI] [PubMed] [Google Scholar]
- 5.Allsopp RC, Harley CB. Exp Cell Res. 1995;219:130–136. doi: 10.1006/excr.1995.1213. [DOI] [PubMed] [Google Scholar]
- 6.Wai LK. MedGenMed. 2004;6:19. [PMC free article] [PubMed] [Google Scholar]
- 7.Mondello C, Scovassi AI. Biochem Cell Biol. 2004;82:498–507. doi: 10.1139/o04-048. [DOI] [PubMed] [Google Scholar]
- 8.De Cian A, Lacroix L, Douarre C, Temime-Smaali N, Trentesaux C, Riou JF, Mergny JL. Biochimie. 2008;90:131–155. doi: 10.1016/j.biochi.2007.07.011. [DOI] [PubMed] [Google Scholar]
- 9.Granotier C, Pennarun G, Riou L, Hoffschir F, Gauthier LR, De Cian A, Gomez D, Mandine E, Riou JF, Mergny JL, Mailliet P, Dutrillaux B, Boussin FD. Nucleic Acids Res. 2005;33:4182–4190. doi: 10.1093/nar/gki722. [DOI] [PMC free article] [PubMed] [Google Scholar]
- 10.Chang CC, Wu JY, Chien CW, Wu WS, Liu H, Kang CC, Yu LJ, Chang TC. Anal Chem. 2003;75:6177–6183. doi: 10.1021/ac034789i. [DOI] [PubMed] [Google Scholar]
- 11.Chang CC, Kuo IC, Ling IF, Chen CT, Chen HC, Lou PJ, Lin JJ, Chang TC. Anal Chem. 2004;76:4490–4494. doi: 10.1021/ac049510s. [DOI] [PubMed] [Google Scholar]
- 12.Zahler AM, Williamson JR, Cech TR, Prescott DM. Nature. 1991;350:718–720. doi: 10.1038/350718a0. [DOI] [PubMed] [Google Scholar]
- 13.Sun D, Thompson B, Cathers BE, Salazar M, Kerwin SM, Trent JO, Jenkins TC, Neidle S, Hurley LH. J Med Chem. 1997;40:2113–2116. doi: 10.1021/jm970199z. [DOI] [PubMed] [Google Scholar]
- 14.Burge S, Parkinson GN, Hazel P, Todd AK, Neidle S. Nucleic Acids Res. 2006;34:5402–5415. doi: 10.1093/nar/gkl655. [DOI] [PMC free article] [PubMed] [Google Scholar]
- 15.Lane AN, Chaires JB, Gray RD, Trent JO. Nucleic Acids Res. 2008;36:5482–5515. doi: 10.1093/nar/gkn517. [DOI] [PMC free article] [PubMed] [Google Scholar]
- 16.Dai J, Carver M, Yang D. Biochimie. 2008;90:1172–1183. doi: 10.1016/j.biochi.2008.02.026. [DOI] [PMC free article] [PubMed] [Google Scholar]
- 17.Pagano B, Mattia CA, Giancola C. Int J Mol Sci. 2009;10:2935–2957. doi: 10.3390/ijms10072935. [DOI] [PMC free article] [PubMed] [Google Scholar]
- 18.Lim KW, Amrane S, Bouaziz S, Xu W, Mu Y, Patel DJ, Luu KN, Phan AT. J Am Chem Soc. 2009;131:4301–4309. doi: 10.1021/ja807503g. [DOI] [PMC free article] [PubMed] [Google Scholar]
- 19.Haider S, Parkinson GN, Neidle S. Biophys J. 2008;95:296–311. doi: 10.1529/biophysj.107.120501. [DOI] [PMC free article] [PubMed] [Google Scholar]
- 20.Petraccone L, Trent JO, Chaires JB. J Am Chem Soc. 2008;130:16530–16532. doi: 10.1021/ja8075567. [DOI] [PMC free article] [PubMed] [Google Scholar]
- 21.Li J, Correia JJ, Wang L, Trent JO, Chaires JB. Nucleic Acids Res. 2005;33:4649–4659. doi: 10.1093/nar/gki782. [DOI] [PMC free article] [PubMed] [Google Scholar]
- 22.Cornell WD, Cieplack P, Bayly CI, Gould IR, Merz KM, Ferguson DM, Spellmeyer DC, Fox T, Caldwell JW, Kollman PA. J Am Chem Soc. 1995;117:5179–5197. [Google Scholar]
- 23.Kollman PA, et al. AMBER 9. University of California; San Francisco, CA: 2004. [Google Scholar]
- 24.Perez A, Marchan I, Svozil D, Sponer J, Cheatham TE, 3rd, Laughton CA, Orozco M. Biophys J. 2007;92:3817–3829. doi: 10.1529/biophysj.106.097782. [DOI] [PMC free article] [PubMed] [Google Scholar]
- 25.Pettersen EF, Goddard TD, Huang CC, Couch GS, Greenblatt DM, Meng EC, Ferrin TE. J Comput Chem. 2004;25:1605–1612. doi: 10.1002/jcc.20084. [DOI] [PubMed] [Google Scholar]
- 26.Garcia De La Torre J, Huertas ML, Carrasco B. Biophys J. 2000;78:719–730. doi: 10.1016/S0006-3495(00)76630-6. [DOI] [PMC free article] [PubMed] [Google Scholar]
- 27.Hubbard SJ, Thornton JM. University College. London: 1993. [Google Scholar]
- 28.Holst MFS. J Comput Chem. 1995;16:337–364. [Google Scholar]
- 29.Humphrey W, Dalke A, Schulten K. J Mol Graph. 1996;14:33–38. 27–38. doi: 10.1016/0263-7855(96)00018-5. [DOI] [PubMed] [Google Scholar]
- 30.Cantor CR, Warshaw MM, Shapiro H. Biopolymers. 1970;9:1059–1077. doi: 10.1002/bip.1970.360090909. [DOI] [PubMed] [Google Scholar]
- 31.Schuck P. Biophys J. 2000;78:1606–1619. doi: 10.1016/S0006-3495(00)76713-0. [DOI] [PMC free article] [PubMed] [Google Scholar]
- 32.Schuck P. National Institutes of Health. Bethesda, MD: 2008. [Google Scholar]
- 33.Hayes DB, Laue T, Philo J. University of New Hampshire. Durham, NH: 2006. [Google Scholar]
- 34.Parkinson GN, Lee MP, Neidle S. Nature. 2002;417:2. doi: 10.1038/nature755. [DOI] [PubMed] [Google Scholar]
- 35.Gray RD, Li J, Chaires JB. J Phys Chem B. 2009;113:2676–2683. doi: 10.1021/jp809578f. [DOI] [PMC free article] [PubMed] [Google Scholar]
- 36.Dai J, Carver M, Punchihewa C, Jones RA, Yang D. Nucleic Acids Res. 2007;35:4927–4940. doi: 10.1093/nar/gkm522. [DOI] [PMC free article] [PubMed] [Google Scholar]
- 37.Yu HQ, Miyoshi D, Sugimoto N. J Am Chem Soc. 2006;128:15461–15468. doi: 10.1021/ja064536h. [DOI] [PubMed] [Google Scholar]
Associated Data
This section collects any data citations, data availability statements, or supplementary materials included in this article.