

Abstract
Photomanipulation (photobleaching, photoactivation, or photoconversion) is an essential tool in fluorescence microscopy. Fluorescence recovery after photobleaching (FRAP) is commonly used for the determination of lateral diffusion constants of membrane proteins, and can be conveniently implemented in confocal laser scanning microscopy (CLSM). Such determinations provide important information on molecular dynamics in live cells. However, the CLSM platform is inherently limited for FRAP because of its inflexible raster (spot) scanning format. We have implemented FRAP and photoactivation protocols using structured illumination and detection in a programmable array microscope (PAM). The patterns are arbitrary in number and shape, dynamic and adjustable to and by the sample characteristics. We have used multi-spot PAM-FRAP to measure the lateral diffusion of the erbB3 (HER3) receptor tyrosine kinase labeled by fusion with mCitrine on untreated cells and after treatment with reagents that perturb the cytoskeleton or plasma membrane or activate co-expressed erbB1 (HER1, the EGF receptor EGFR). We also show the versatility of the PAM for photoactivation in arbitrary regions of interest, in cells expressing erbB3 fused with the photoconvertible fluorescent protein dronpa.
Keywords: dronpa, erbB3, LCoS, diffusion
INTRODUCTION
Programmable Array Microscopy
We define the Programmable Array Microscope (PAM) as an implementation of structured illumination microscopy (Heintzmann, 2006) based on the placement of a spatial light modulator (SLM) in the image plane of a standard fluorescence microscope (Verveer et al., 1998). The SLM provides arbitrary patterns of illumination and conjugate/non-conjugate detection of the corresponding distribution of emitted fluorescence so as to generate optically sectioned images in real time. The SLMs in earlier PAM versions designed for optical sectioning and hyperspectral imaging, respectively, were either a digital micromirror device (DMD) (Hanley et al., 1999a; Heintzmann et al., 2001) or a transmissive liquid crystal display (Hanley et al., 2000; Hanley et al., 1999b). The principles by which the simultaneously acquired images of the conjugate (“on” pixels) and the non-conjugate (“off” pixels) are combined to achieve highly optically sectioned images with up to a 50% duty cycle have been elaborated upon previously (Hanley et al., 1999a; Heintzmann et al., 2001; Verveer et al., 1998) and are patented (Jovin et al., 2000; 2002; 2003).
We have recently developed a second generation PAM prototype based on a ferroelectric liquid-crystal-on-silicon (LCoS) microdisplay and an emCCD camera. The Gen-2 PAM is capable of video rate, real-time sectioned imaging (Hagen et al., 2007). Its inherently versatile nature provides for a variety of imaging modalities besides mere intensity: hyperspectral imaging using Hadamard encoding masks (Hanley et al., 2000; Hanley et al., 1999b; Harwit and Sloane, 1979); frequency domain fluorescence lifetime imaging (FLIM) (Hagen et al., 2007; Hanley et al., 2005); and polarization (anisotropy). For a brief review of PAMs and their applications see Hagen et al. (2007). The experiments reported here were performed with the Gen-2 instrument.
Point-scanning confocal microscopes are important and widespread tools for basic research in the fields of cell biology, genetics, and development. However, these instruments are (increasingly) costly and rely on laser illumination focused to a diffraction-limited spot. In the attempt to counteract the intrinsically low duty cycle (illumination density) and the relatively poor detection efficiency of such systems, one generally resorts to high excitation irradiance. Unfortunately, this strategy causes significant photobleaching during the course of an experiment, particularly if z-sectioning is employed, making long-term measurements difficult if not impossible. In addition, line and/or frame-averaging for noise reduction limit the data acquisition speed to frame rates rarely exceeding 10 Hz. Thus, despite its many virtues the CLSM is not optimal for investigations of live cells, for example those expressing photosensitive GFP-fusion proteins and/or exhibiting dynamic processes occurring at rates significantly faster than those of data recording. The LCoS-based PAM utilizes lamp, LED or laser illumination distributed over the entire scanning area, and emCCD cameras with quantum efficiencies of > 90% and pixel readout rates up to 35 MHz, offering very high detection sensitivity. As a consequence, the PAM exhibits significantly reduced photobleaching while maintaining sustained frame rates of ≥60 Hz.
Multi-Spot FRAP
Numerous photoactivation and photobleaching protocols, e.g. fluorescence recovery after photobleaching (FRAP) constitute important tools in cell biology for studying the kinetics of macromolecular motion, interactions and activity (for reviews, see McNally (2008); Rabut and Ellenberg (2005). We have reported previously experiments with the PAM involving photoconversion (Fulwyler et al., 2005; Hagen et al., 2007). One application explored with the newer LCoS-based PAM is the measurement of lateral diffusion of fluorescent protein-membrane receptor fusion proteins by FRAP. The PAM allows one to simultaneously photobleach any number of spots or arbitrarily shaped regions of interest in/on a cell plasma membrane. These procedures provide a wealth of information, particularly in an imaging context, yielding a detailed view of local variations in density, diffusion and mobility of key biomolecules such as receptors. In contrast, while beam scanning systems can create patterns of spots they do so by strictly sequential means. Some of the current commercial CLSMs suffer in addition from a significant latency in the transition from the photoreaction mode of operation and the subsequent imaging procedure, while the faster Nipkow scanning systems require two separate light sources. In the Gen-2 PAM, the time between photobleaching or photoconversion and imaging can be < 0.5 ms, which combined with ROI multiplexing permits determinations of diffusion and mobility on a cell surface with high spatial and temporal resolution. Furthermore, the PAM concept is compatible with the dynamic generation of photobleaching (photoactivation, photoconversion) patterns based on the sample itself. We are currently exploring such image-guided and adaptive strategies for optical sectioning, and photomanipulation. In short, the PAM is a form of “autonomously intelligent” imaging device.
Photoconversion
The photoconvertible fluorescent protein dronpa (Ando et al., 2004) can be rapidly converted to a fluorescent state by excitation with near-UV light (maximum at 388 nm). The photoisomerized molecule has an absorption peak at 503 nm (Fron et al., 2007), and is visualized by low-light level excitation at 488 nm, resulting in emission at 518 nm. Back-conversion to the dark state is induced by exposure to intense illumination at 488 nm. The protein can cycle in this manner many hundreds of times before irreversible photobleaching occurs. For a recent review of photoconvertible fluorescent proteins and their uses see Lippincott-Schwartz et al. (2008).
erbB3 growth factor receptor
The growth factor receptor examined in this study is erbB3 (Kraus et al., 1989), a member of a ubiquitous signaling family of receptor tyrosine kinases (Warren and Landgraf, 2005). Little is known about the dynamics of erbB3 in the plasma membrane; FRAP studies of this molecule have not been reported. In the present study, we measured the diffusion and mobility of erbB3-mCitrine transfected and cloned in A431 cells, which also express very high levels of endogenous erbB1 (EGFR) (Nagy et al., 2003). The effects of treatment with reagents that perturb the plasma membrane, disrupt the cytoskeleton, or activate erbB1 were explored with the Gen-2 PAM.
MATERIALS AND METHODS
Reagents
Human recombinant EGF was from R&D Systems (Minneapolis, Minnesota). Methyl-β cyclodextrin (MβCD) was from Sigma-Aldrich (Munich, Germany). Kabiramide C (KabC) was a kind gift of Gerard Marriott.
Cell lines
A431 cells stably transfected with erbB3-mCitrine or erbB3-dronpa were maintained in DMEM with 10% fetal calf serum.
Live cell imaging
Cells were typically starved (0.1% FCS) overnight before imaging. Live cell imaging was performed in Tyrode’s buffer with 20 mM glucose and 0.1 % BSA in LabTek (Nunc, Wiesbaden, Germany) 8-well chambered coverglass slides. Imaging was performed at 30 °C using an objective heater (HLS-8x0.8p, with mTCII controller, Cell MicroControls, Norfolk, VA). Cell treatments included MβCD (1% in DMEM for 30 min at 23 °C), KabC (20 nM in DMEM for 20 min at 30 °C), or EGF (3 nM in Tyrode’s buffer with 20 mM glucose and 0.1 % BSA for 5-15 min at 30 °C).
PAM
The PAM is a stand-alone module featuring as the SLM a ferroelectric liquid-crystal-on silicon (LCoS) device (SXGA-R2D, Forth Dimension Displays, Dunfermline, Scotland). This microdisplay has several favorable characteristics for use in the PAM: high fill factor (93%), good contrast (400:1), and a fast liquid crystal switch time (40 μs), these parameters being the manufacturer’s specifications. All of the available 24 binary bitplanes are displayed for the same length of time and at a frequency of 1.44 kHz, corresponding to the 60 Hz (3×8 RGB) video frame rate of the LCoS. Scanning patterns are defined by displaying an RGB-encoded image via a standard computer DVI video interface, and include tiled arrays based on dot lattices, line arrays, or pseudorandom (Sylvester) 1D or 2D sequences (Hanley et al., 1999a; Heintzmann et al., 2001). The PAM can be attached to a camera port of any unmodified fluorescence microscope, in our case an Olympus IX71 (Olympus, Hamburg, Germany). Images are acquired with an emCCD camera (iXon DV885 or DV897, Andor Technology, Belfast, Northern Ireland). The Gen-2 PAM system has been described in more detail elsewhere (Hagen et al., 2007).
In the LCoS-based PAM, an “on” pixel is one in which illumination (and emitted) light is reflected with a π/2 rotation in the plane of polarization, thereby enabling selective passage and sorting through polarizing beam combiners. “Off” pixels reflect light with no change in polarization state. In the limit of sparse illumination patterns, the “conjugate” image relayed to the camera by the “on-pixels” corresponds to the focus-plane confocal data generated by a CLSM, whereas the “non-conjugate” image generated by light relayed to an adjacent area on the same camera corresponds to the out-of-focus light rejected (and thus lost) by the CLSM pinhole. In the case of denser patterns, particularly pseudorandom sequences used by the PAM to achieve a 50% illumination duty cycle (Hanley et al., 1999a; Heintzmann et al., 2001; Verveer et al., 1998), a corrected optical-sectioned image is computed (and displayed) by appropriate duty-cycle dependent combinations of the conjugate and non-conjugate images (Hagen et al., 2007). By virtue of recording both images and discounting transmission losses, all the light emitted by the sample and collected by the objective is employed, a procedure permitting very fast optical sectioning and leading to superior image reconstruction at very low light levels (Verveer et al., 1999). The current optical arrangement, a modified prototype developed together with Cairn Research Ltd. (UK), utilizes an off-axis focusing mirror with an elliptical profile and focal length of 400 mm as the primary optical element. Figure 1 shows the light pathway in the Gen-2 PAM in schematic form. The PAM is coupled to the left output port of the inverted microscope via an Olympus telan lens with a focal length of 211 mm, leading to a 1.9× microscope-to-LCoS magnification. The IX71 has an internal 180 mm tube lens, such that a single 13×13 μm LCoS “on” element corresponds geometrically to a spot of ~0.1 μm using a 60× objective. This value is considerably smaller than the diffraction limit. The fluorescence is descanned by the same LCoS pattern, providing the freedom to select a setting constituting a compromise between the effective pinhole size and desired signal-to-noise ratio. To achieve optimal optical sectioning, one requires that M / NA = 0.4πd0 / λ (Wilson, 1995), where M is the total system magnification, and d0 is the physical size of the pinhole, or in this case, the LCoS element. Assuming a 60×/1.2 NA water immersion objective, and λ = 500 nm, the optimal dot size for scanning in the PAM would be a 2×2 “superpixel.” We typically choose slightly larger dot sizes or line widths for improved signal to noise. These calculations demonstrate a major advantage of the PAM over other multipoint scanning systems, namely the ability to quickly and easily “tune” the effective pinhole size as a function of the sample and of the selection of the scanning elements, such as points and single lines (Wolleschensky et al., 2006) or multiples thereof.
Figure 1.

Schematic representation of the light paths in the LCoS-based programmable array microscope. In reality, the polarizing beam splitter cubes are stacked vertically, allowing use of both polarization states for excitation and emission.
Real-time optical sectioning using on-line image processing
To yield an optically sectioned image corrected for offset due to crosstalk between the numerous virtual apertures, further processing of the conjugate and non-conjugate images is required, either by simple scaled subtraction, or by a combined deconvolution (Heintzmann et al., 2001; Verveer et al., 1998). For image subtraction, the two images are registered by optimizing the 2-dimensional correlation coefficient using a search procedure with a fixed step size. During acquisition, a pre-acquired background image is first subtracted from the image pair. Then, the non-conjugate image is affine transformed to correspond to the conjugate image, applying pre-determined registration parameters. For subpixel transformations, bilinear interpolation is used. The non-conjugate image is then subtracted from the conjugate image, using a weighting factor that is dependent on the duty cycle, dc, of the pattern used for acquisition: (Heintzmann et al., 2001). We also compensate for imperfect polarization contrast in the LCoS and PBS cubes by introducing appropriate scaling coefficients into the above equation. A widefield image involving sums of Iconj and INonConj can also be generated in real-time. The availability of all four images in one display is of great advantage when working with complex samples.
The image transformations and subtraction are performed on a GPU board (Quadro FX 4400 or GeForce 8800 GTX, NVIDIA Corporation, Santa Clara, California) using the BrookGPU library (Buck et al., 2004) with DirectX 9 runtime, or CUDA (Nickolls et al., 2008). CUDA also allows relatively easy implementation of nearly any image processing function, including morphological operations, arbitrary filters, and FFTs. We have developed a selection of image processing functions for CUDA, which can be called upon using the LUA scripting language (Ierusalimschy et al., 1996) for further real time image processing or analysis. By off-loading the image processing to the GPU, the computation time is less than the shortest possible PAM exposure time required for a full scan (presently, 16.6 ms, although an 85 Hz LCoS is available from Forth Dimension Displays allowing a minimum exposure time of 11.8 ms). Interaction with the PAM is thus real-time, i.e. optically-sectioned images are displayed or recorded to disk at any frame rate up to 60 Hz.
RESULTS
Optical sectioning performance
To test the optical sectioning capability of the LCoS-based PAM, we prepared thin fluorescent films on coverslips by spin coating rhodamine 6G in polyvinyl alcohol as previously described (Hanley et al., 1999a). A layer thickness of 10.5 nm was measured by AFM, the tip of which was used to scratch a line in the layer after which the scratch was imaged in tapping mode. The thin fluorescent layer was mounted on a glass slide in air, sealed with nail polish, and imaged using a scanning pattern consisting of a dot lattice, line array, or pseudorandom sequence. Serial z-planes were acquired with a 60×/1.45 NA objective (Olympus PLAPO60XOTIRFM). The average, background-subtracted intensity was then measured in a small region of interest. An example of such data, acquired with an 8 pixel-wide, 24 pixel period (duty cycle 1/3) line scan pattern, is shown in Figure 2a. The FWHM for the conjugate signal, determined by nonlinear curve fitting to a pseudo-Voigt function, was 960 ± 4 nm. This function is a weighted average of Gaussian and Lorentzian distribution curves and includes adjustable parameters for FWHM, offset, peak center and height, as well as the weighting factor. The theoretical FWHM of the axial response for this objective under ideal CLSM conditions is ~310 nm (Toomre and Pawley, 2006), but this limit is rarely if ever achieved in practice. Reported FWHMs of the axial response to thin fluorescent films using CLSMs range from 918 nm to 1195 nm (Brakenhoff et al., 2005), values close to the 960 nm we measured in the PAM. We also calculated the theoretical FWHM of the 8 pixel-wide, 24 pixel period line scan through a thin fluorescent plane using eqs. 2 and 3 from Verveer et al. (1998) and high-NA microscope excitation and emission PSFs computed using a pupil function approach described in Hanser et al. (2004), including vectorial effects. The computed FWHM of 897 nm was close to the measured value, the discrepancy being probably attributable to apodization in the microscope objective by Fresnel losses (Hanser et al., 2004) and small aberrations in the PAM optics, both effects unaccounted for in the treatment.
Figure 2.
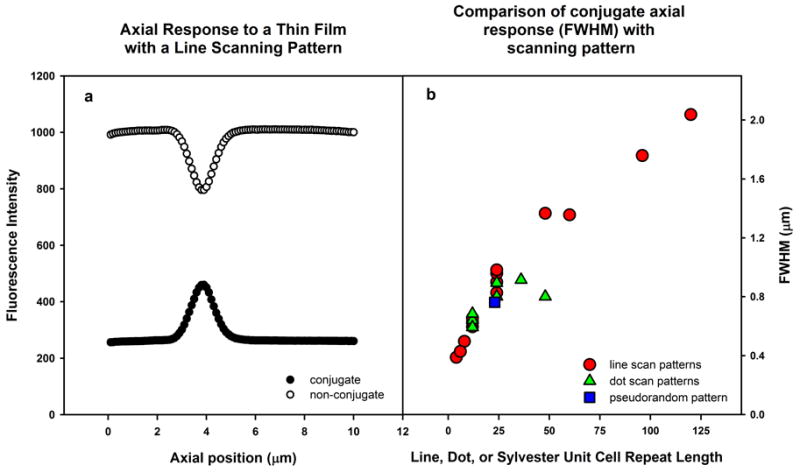
a) Background subtracted, axial response to a thin fluorescent film using a line scanning pattern and 60×/1.45 NA objective. The pattern is denoted 8-24-1. This pattern has lines of 8 pixel thickness, with a period of 24 pixels, and a shift of 1 pixel. The on/off ratio is thus 1/3. Filled circles, conjugate image; open circles, non-conjugate image. The FWHM was determined to be 960 nm. b) Comparison of conjugate axial response (FWHM) to a thin film with various scanning patterns, fitted results. As in the DMD-based PAM the measured FWHM depends on the unit cell repeat length of the pattern used.
Pseudorandom sequences of length 23 were also applied (Hanley et al., 1999a; Heintzmann et al., 2001; Verveer et al., 1998). The basic sequence (11111010110011001010000) was propagated as in (Hanley et al., 1999a; Harwit and Sloane, 1979; Heintzmann et al., 2001) to produce the final 24-bitplane sequence on the microdisplay. Scanning using a Sylvester pattern relies on the concept of aperture correlation (Wilson et al., 1996). These sequences (Harwit and Sloane, 1979) have a 50% duty cycle for “on” pixels and thus increase the structured illumination efficiency (fractional exposure of each pixel) to the highest possible limit. The image acquisition times are reduced accordingly while maintaining good optical sectioning. Figure 2b shows the result of varying the line width and spacing or dot size and repeat-length on optical sectioning performance, and Table 1 presents a summary of optical sectioning parameters including FWHM, offset, and peak height when using a variety of line scanning patterns. These results are very similar to those achieved with the Gen-1 DMD-based PAM (Hanley et al., 1999a; Heintzmann et al., 2001). We compared the conjugate FWHM of various scanning patterns by subtracting the offset, and normalizing. As with the DMD-based PAM (Hanley et al., 1999a; Heintzmann et al., 2001), the offset-subtracted FWHM decreased as the line or dot array patterns become more closely spaced, but the conjugate offset increased. One can adjust the pattern parameters so as to achieve a compromise best suited to a particular sample. For example, a thick, densely stained object will usually require imaging with low offset patterns.
Table 1.
Comparison of conjugate axial response to a thin film using line scanning patterns*.
| line width (pixels) | line period (pixels) | pattern duty cycle | conjugate axial response to thin film FWHM (μm) | conjugate offset | conjugate peak height |
|---|---|---|---|---|---|
| 1 | 4 | 0.25 | 0.40 | 58 | 2 |
| 1 | 8 | 0.13 | 0.50 | 22 | 3 |
| 2 | 6 | 0.33 | 0.43 | 151 | 18 |
| 2 | 12 | 0.17 | 0.60 | 47 | 22 |
| 2 | 24 | 0.08 | 0.83 | 19 | 18 |
| 5 | 12 | 0.42 | 0.63 | 141 | 45. |
| 5 | 24 | 0.21 | 0.90 | 42 | 44 |
| 5 | 60 | 0.08 | 1.36 | 24 | 61 |
| 8 | 12 | 0.67 | 0.66 | 916 | 116 |
| 8 | 24 | 0.33 | 0.96 | 261 | 200 |
| 8 | 48 | 0.17 | 1.37 | 79 | 152 |
| 8 | 96 | 0.08 | 1.76 | 28 | 91 |
| 10 | 24 | 0.42 | 0.98 | 388 | 231 |
60×/1.45 NA oil immersion objective (Olympus PLAPO60XOTIRFM)
An important difference between the LCoS and DMD microdisplays is the reduced higher order diffraction (leading to light loss) generated by the LCoS. The regular patterns of tilted mirrors of the DMD act as a much more efficient diffraction grating than the continuous structure of the active layers of the LCoS. The effects of aperture geometry and source coherence have been investigated theoretically by Taylor and McCabe (Taylor and McCabe, 2002). These authors found that crosstalk between closely spaced apertures can lead to destructive interference, especially using coherent (i.e., laser) sources. They also reported that the FWHM of the axial response decreases as the pattern spacing is reduced. Although the authors based their study on a reflected light microscope, a similar situation applies to the PAM (Hanley et al., 1999a).
Multi-spot FRAP
FRAP measurements are often performed with a CLSM. Here, we present an important variation of the method made possible due to the programmable feature of the PAM, which allows simultaneous photobleaching and recovery measurements in an arbitrary array of spots We first imaged live cells grown in 8-well coverslip chambers with an optical sectioning imaging pattern, typically an 8-pixel wide, 24 pixel period line scanning pattern (see Table 1) for 6-13 s (50 – 100 images), then switched the SLM to a photobleaching pattern while increasing the laser intensity 100-fold by moving the fast, motorized PAM excitation filter wheel from a position loaded with an OD 2 filter to an open position. After photobleaching for typically 1.2 – 6.9 s (this value depended mainly on the available laser power; SLM inter-pattern times are ~1 ms), we resumed imaging with the line pattern, while switching back to the original attenuated laser beam. A series of 100-500 images were then recorded for 20-70 s to define the kinetics of fluorescence recovery. Figure 3 shows an example of such an experiment, in which an array of 24 spots on a cell expressing erbB3-mCitrine was photobleached. Table 2 presents the results of an analysis of the FRAP curves recorded on untreated erbB3-mCitrine cells, and after various treatments including exposure to 1% MβCD, (a reagent that depletes cholesterol from the plasma membrane) for 30 min at 23 °C; addition of 20 nM KabC (a macrolide that binds to the same site on G-actin as gelsolin, resulting in the severing and capping of the (+) end (Tanaka et al., 2003)) for 20 min at 30 °C; or the addition 3 nM EGF for 5-15 min at 30 °C. Imaging was carried out at 30 °C. We measured a mean diffusion constant of 3.6±1.6 ·10-10 cm2/sec for untreated erbB3-citrine cells, with a mobile fraction of 74±15% (n = 141 photobleached spots). Treatment with EGF, KabC, or MβCD increased the diffusion constant to 7.0±2.1, 4.6±1.2, and 6.7±2.7 ·10-10 cm2/sec, respectively. Mobile fractions were relatively unaffected: 79±4%, 67±16%, and 67±25%, respectively (n = 41, 22, 126).
Figure 3.
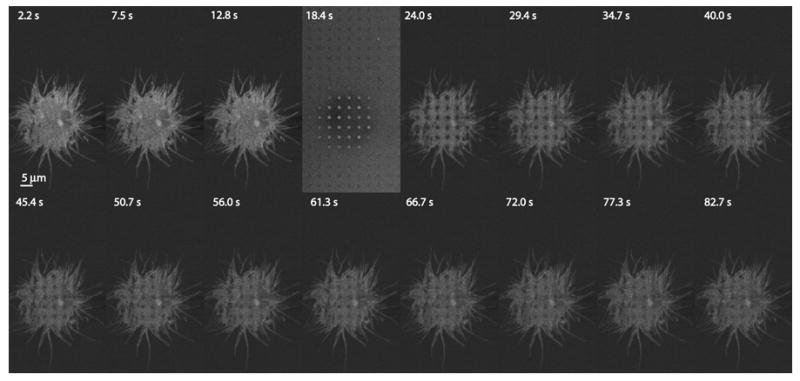
FRAP experiment with the PAM. A431 cells expressing mCitrine-erbB3 were photobleached with a dot array pattern for 6 s, followed by 60 s of imaging. Relatively long photobleaching times were required in this particular case because of the relatively low laser power available. Images were acquired at ~3 s intervals. Bar, 5 μm. Photobleaching occurred 18.4 sec into the experiment. The images have been contrast-stretched for presentation purposes.
Table 2.
Recovered fluorescence recovery parameters for erbB3-Citrine cells under various conditions.
| erbB3-citrine | 1010·D cm2/s | M%* | photobleaching time, s | n† |
|---|---|---|---|---|
| untreated | 1.8 | 80 | 6.5 | 44 |
| 2.1 | 81 | 6.9 | 24 | |
| 4.3 | 67 | 3.3 | 25 | |
| 6.1 | 51 | 1.2 | 7 | |
| 2.7 | 66 | 6.8 | 7 | |
| 4.8 | 78 | 6.8 | 11 | |
| 3.7 | 97 | 3.3 | 23 | |
| mean ± SD | 3.6 ± 1.6 | 74 ± 15 | n = 141 | |
| +EGF‡ | 9.0 | 74 | 3.0 | 8 |
| 7.3 | 82 | 3.2 | 10 | |
| 7.7 | 79 | 3.9 | 15 | |
| 4.1 | 82 | 3.9 | 8 | |
| mean ± SD | 7.0 ± 2.1** | 79 ± 4 | n = 41 | |
| +KabC¶ | 4.7 | 71 | 4.1 | 10 |
| 5.8 | 80 | 4.0 | 5 | |
| 3.4 | 49 | 5.4 | 7 | |
| mean ± SD | 4.6 ± 1.2 | 67 ± 16 | n = 22 | |
| +MβCD§ | 6.1 | 69 | 1.3 | 52 |
| 10.4 | 32 | 3.3 | 50 | |
| 3.8 | 80 | 4.0 | 14 | |
| 6.5 | 88 | 3.1 | 10 | |
| mean ± SD | 6.7 ± 2.7** | 67 ± 25 | n = 126 |
M%, mobile fraction
n, number of spots photobleached and measured for fluorescence recovery on a particular cell.
EGF, epidermal growth factor, 3 nM for 5-15 min at 30 °C.
KabC, Kabiramide C, 20 nM for 20 min at 30 °C.
MβCD, methyl-βcyclodextrin, 1% v/v for 30 min at 23 °C.
significantly different from untreated cells (P ≤ 0.05)
Table 3 lists the photobleaching recovery parameters determined for the 24 individual spots photobleached on the untreated erbB3-mCitrine cell shown in Figure 6. Selected data from Table 3 are plotted in Figure 4. We also performed FRAP experiments at 30 °C on untreated erbB3-mCitrine cells using a Leica SP5 confocal microscope and a 60×/1.4 NA objective. Single 1 μm spots in the cell membrane were photobleached with a 488 nm laser, and detection was at 505-600 nm. The measured diffusion constant was 6.4±3.2·10-10 cm2/sec, with a mobile fraction of 80±21% (n = 11). This mean value for the diffusion constant was somewhat higher than that measured with the PAM but the difference is only barely statistically significant (P = 0.052). As in the PAM experiments, we did not observe a dependence of the diffusion constant on the time of photobleaching, which varied between 0.9 and 6.0 s.
Table 3.
Recovered fluorescence recovery parameters for 24 different photobleached spots on the untreated erbB3-Citrine cell shown in Figure 3.
| Spot number | Signal* | 1010·D cm2/s | M%† | Plot in Figure 4¶ |
|---|---|---|---|---|
| 1 | 11406 | 2.0 | 62 | a |
| 2 | 11580 | 1.5 | 83 | |
| 3 | 11245 | 1.5 | 85 | |
| 4 | 8669 | 2.0 | 90 | |
| 5 | 13595 | 1.4 | 75 | |
| 6 | 10805 | 2.7 | 61 | |
| 7 | 10558 | 1.7 | 78 | |
| 8 | 9468 | 3.7 | 75 | |
| 9 | 10928 | 1.7 | 87 | b |
| 10 | 10484 | 1.3 | 88 | c |
| 11 | 10414 | 1.3 | 90 | d |
| 12 | 8204 | 2.5 | 94 | e |
| 13 | 10095 | 1.5 | 98 | |
| 14 | 8389 | 3.3 | 74 | f |
| 15 | 8521 | 2.1 | 88 | |
| 16 | 9304 | 1.7 | 99 | |
| 17 | 9218 | 3.0 | 77 | |
| 18 | 11356 | 1.8 | 73 | |
| 19 | 10154 | 2.1 | 70 | g |
| 20 | 9515 | 1.6 | 99 | |
| 21 | 9630 | 2.5 | 76 | |
| 22 | 11628 | 2.1 | 60 | |
| 23 | 8708 | 2.5 | 69 | |
| 24 | 10038 | 2.0 | 73 | h |
|
| ||||
| Mean±SD | 10163 ± 1290 | 2.1 ± 0.6 | 80 ± 12 | |
Figure 6.
Photoactivation at 22 °C of dronpa-ErbB3 in a completely arbitrary region of interest, in this case a checkerboard pattern. The optically sectioned image was obtained by scaled subtraction corresponding to the scanning pattern (a Sylvester pattern with repeat length 23) as described in the text. Shown are time points following activation using a blue LED and filter (see text). The first image was taken approximately 200 ms after activation, and each subsequent image after an additional 2.3 s. Each image is an average of 8 26 s cycles of activation and imaging. Images have been contrast-stretched. Bar, 10 μm.
Figure 4.
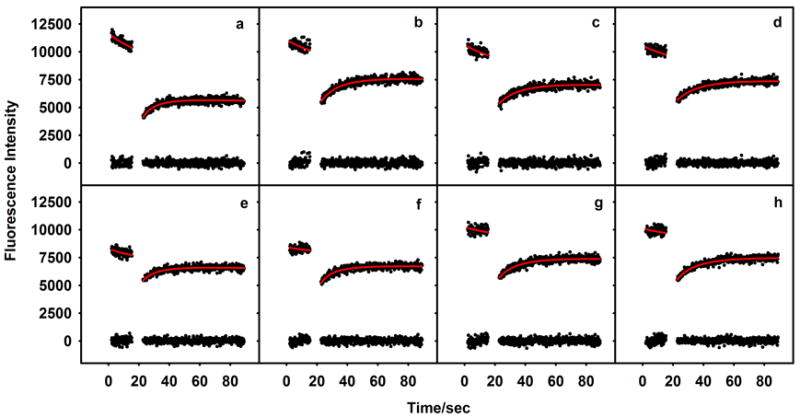
Fluorescence recovery traces with fitted curves and residuals from 8 of the spots photobleached in Figure 7. In some of the spots (a, b) there was appreciable photobleaching of fluorescence due to the low (but finite) intensity laser beam used for monitoring the fluorescence, while in others (f), there little photobleaching was evident. Table 3 reports the diffusion constant and mobility recovered from curve fitting procedures performed on the 8 curves.
Our analysis of the FRAP data takes into account undesirable photobleaching caused by imaging with a laser of low yet finite intensity. We performed the correction by simulation of the recovery kinetics with arbitrary extents of photobleaching and arbitrary beam profiles, an approach that has been described elsewhere (Hagen et al., 2005). Photobleaching during the recovery phase can badly distort recovery kinetics, and traditional analysis methods do not adequately deal with the problem, leading to inaccurate results. Our simulations showed that even moderate monitoring beam photobleaching leads to estimations of diffusion constants that are ~70% too high, while the estimated mobility is ~25% too low (Hagen et al., 2005). For the analysis, it is essential that a sufficient number of pre-bleach images are collected so as to establish the monitoring beam photobleaching rate with confidence. This precaution is commonly overlooked in FRAP experiments, particularly those conducted with CLSMs.
Photoconversion of dronpa in arbitrary regions of interest
In this study we demonstrated a complex pattern of photoconversion implemented with the PAM that cannot be easily (or at all) achieved with other types of more conventional microscopes. Such instruments usually allow definition of one or at most a few simple regions of interest for photobleaching or photoactivation. With the PAM, one can photoconvert molecules in truly arbitrary regions of interest, then quickly switch to one of the optical sectioning patterns described above for imaging diffusion or other processes. The minimum time between photoactivation (or photobleaching, uncaging, etc.) and imaging is currently 980 μs (the time required for the LCoS display to load a new frame), allowing the study of rapidly diffusing or transporting molecules. As the LCoS switching time is only 40 μs, we are currently investigating strategies to reduce even further the time between photoconversion or photobleaching and imaging.
To investigate the use of the PAM for patterned photoactivation, we constructed a fusion protein of dronpa and erbB3 and imaged transfected cells expressing this molecule as follows:
Activation for ~2 s using a Luxeon K2 royal blue LED (Philips Lumileds) with a 442/50 nm bandpass excitation filter and a 460 nm dichroic filter (for combination with the 488 nm imaging laser). We used a variety of activation patterns, including single broad lines, checkerboard-like patterns, and large areas that activated, for example, half of a given cell.
(optional) Reduction of unwanted activation for ~2 s using a pattern complementary to the one used for activation and a 488 nm laser at approximately 50 mW (laser power at PAM input). As this is single photon photoactivation, unwanted activation occurs out of the focal plane.
Imaging using an optically sectioning scanning pattern based on line arrays or pseudorandom sequences for an arbitrary number of images (usually 200 in our case) with an exposure time of 100 ms (leading to 20s of imaging). We attenuated the 488 nm laser to approximately 5mW using a neutral density filter so that back conversion to the dark state would be avoided as long as possible while still achieving adequate signal to noise for imaging. At least 50 - 60 100 ms frames were usable for subsequent diffusion analysis, while the remaining 140 – 150 frames were used to ensure complete back conversion. An adjustable delay between each frame of imaging was used to allow sufficient time for dronpa-erbB3 to diffuse into unactivated parts of the cell.
(optional) Repetition of the activation-imaging cycle for (typically) 10-20 cycles. This procedure permits averaging signals so as to improve the signal to noise ratio. A major virtue of the photochromic process is its reversibility, allowing arbitrary patterns to be generated, erased, or reformed at will, until depletion within the entire cell occurs.
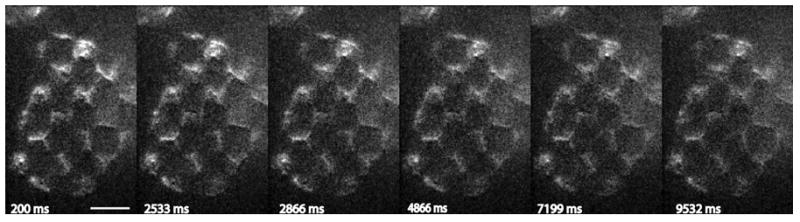
The major advantages of the PAM in such experiments are the minimal time required between activation (or photobleaching in FRAP studies) and imaging, and the elimination of the extra costly equipment required for activation or FRAP studies with Nipkow disk systems. Furthermore, the imaging parameters (activation and imaging duration, light intensity, etc.) are freely adjustable using a scripting interface incorporated into the PAM acquisition and processing software described above. The scripting interface allows users to freely select camera exposure times, gain, and image processing settings on a per channel basis. One can easily construct complex sequences of light exposures for activation and imaging, filter wheel positions, delays, and other experimental parameters. Figure 5 shows the result of a photoactivation experiment in which a small group of cells was photoconverted in the upper half of the image. In this case, the unwanted activation was not reduced according to step 2 above. Each of the images in the gallery (evenly spaced and selected from a 2 s, 40 frame recording) is a time step showing the backconversion of dronpa molecules to the dark state as imaging took place. We repeated the cycle of activation and imaging 10 times, and averaged the images from each 2 s cycle. We did not observe erbB3-dronpa molecules diffusing across the boundary between activated and unactivated areas of the cell, indicating this receptor was largely immobile on the times scales of the experiment (1.4 s of imaging). We note that in the FRAP experiments, the recovery was <15% complete after 1.4 s, making determinations of diffusion difficult. In addition,, these experiments were performed at 22 °C, resulting in slower diffusion than that in the FRAP experiments.
Figure 5.
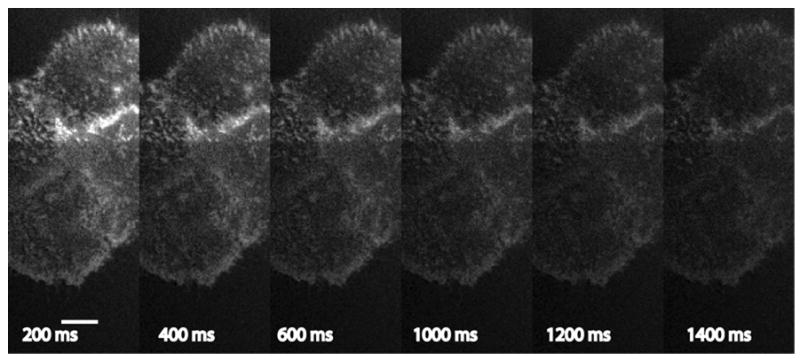
Photoactivation at 20 °C of dronpa-erbB3 in a region of interest, in this case the top half of the group of cells. The image is a subtracted result using a scaling factor for the non-conjugate image corresponding to the scanning pattern used (in this case a Sylvester pattern with repeat length 23) as described in the text. Time points are following activation using a blue LED and filter (see text). The first image was taken ~200 ms after activation and each subsequent image after an additional 50 ms. Shown are the average of images 1, 5, 9, 13, 17, and 21 corresponding to 200 ms, 400 ms, 600 ms, 800 ms, 1000 ms, 1200 ms, and 1400 ms after photoactivation. Each image is an average of 20 2 s cycles of activation and imaging. Images have been contrast-stretched. Bar, 10 μm.
Figure 6 shows a sequence of images at evenly spaced intervals from a 29 s, 200 frame recording of photoactivation in an arbitrary region of interest, in this case a checkerboard pattern. In this experiment, performed at room temperature, we back-converted wrongly activated molecules using a complementary pattern as in step 2 above. The cycle of activation and imaging was repeated 8 times.
DISCUSSION
The PAM renders FRAP experiments much more efficient than previously possible by combining arbitrary patterned photobleaching with optical sectioning. One limitation we faced in such experiments was a limitation on the available laser power, requiring photobleaching times longer than desirable. However, we did not detect a consistent dependence of the measured diffusion constant or fractional mobility on the photobleaching time, and thus do not consider this to have been an issue. We measured similar diffusion and mobility parameters for erbB3-mCitrine using a Leica SP5 confocal microscope, with photobleaching times ranging from 0.9 to 6 s.
The variability in the FRAP results may reflect inherent cellular properties such as local differences in receptor clustering, interactions with other membrane proteins or discrete membrane features (i.e., microdomains). There may also be spatially varying contributions from small vesicles (endosomes, etc.) that are close to the plasma membrane; even in an optically sectioned measurement as the plasma membrane is far thinner than the axial resolution of the microscope. Total internal reflection microscopy offers much higher axial resolution and has been applied in FRAP studies of protein lateral diffusion in plasma membranes (Hagen et al., 2006). However, there is no apparent correlation between signal levels or photobleaching times and the computed diffusion constants and fractional mobilities, as might be expected if there were large effects arising from cytoplasmic vesicles.
Relatively little is known about the dynamics of erbB3 in the plasma membrane. We have studied previously the internalization of erbB3 in cells expressing erbB1 after exposure to EGF (Lidke et al., 2004). Although erbB1 internalized rapidly after binding of the EGF, the distribution of erbB3 was not affected. Our data are consistent with these results in that upon EGF treatment, the diffusion constant of erbB3 increased nearly two-fold, while the mobile fraction remained largely unchanged. As erbB1 is expressed in very high numbers on these cells (>106 molecules/cell), it is possible that erbB3 molecules are able to diffuse more freely as erbB1 is rapidly depleted from the membrane. This process could temporarily reduce crowding and result in faster diffusion without mobilizing large fractions of the receptor population. Our data are also consistent with the absence of erbB1-erbB3 heterodimers; one would otherwise have anticipated a larger change in diffusion or mobility had erbB3 clustering (e.g. heterodimerization) with erbB1 been drastically affected.
Evidence of erbB3 involvement with cholesterol-dependent lipid microdomains (lipid rafts) is mostly indirect. It has previously been shown that crosslinking of GM1 by the B subunit of cholera toxin mobilizes erbB2 out of rafts, and reduces erbB2-erbB3 heterodimerization (Nagy et al., 2002). The Authors speculated that CTX treatment separates erbB2 but not erbB3 from lipid rafts. It is also known that in neurons, only erbB3 is capable of interacting with the shorter, lipid-raft-associated isoform of the sensory and motor neuron-derived factor (SMDF; a type III NRG-1 isoform). Our data are consistent with erbB3 localization in rafts, as MβCD treatment led to an increase in the diffusion constant of erbB3. If erbB3 is indeed localized in rafts, it is likely that, in cells expressing large numbers of this receptor, self-association occurs in the lipid microdomains. Disruption of the latter with MβCD would be expected to reduce the number and sizes of erbB3-mCitrine clusters.
Heregulin, a ligand of erbB3, regulates cytoskeleton reorganization (Adam et al., 1998). Thus, we also investigated the possible involvement of erbB3 with the cytoskeleton by disrupting actin using KabC. The change in diffusion compared to the other treatments was small (see Table 2). The lack of a large effect of KabC on erbB3 lateral diffusion was unexpected and requires further investigation.
OUTLOOK
The PAM offers great potential for applications in the emerging area of “intelligent microscopy”, involving computer-adaptive or user interactive imaging modes in which both the user and computer interact dynamically with the PAM, using image information to generate new scanning patterns on the fly. In the context of FRAP or photoconversion experiments, the high-speed switching capabilities of the LCoS display are very useful. Given adequate illumination intensity, one could conceivably utilize a single bitplane to establish a pattern of photoactivation or photobleaching, followed by optically sectioned imaging. The time between photoconversion or photobleaching and imaging could then be <0.4 ms, the interval between successive LCoS bitplanes in the case of 60 Hz frame rate devices.
Acknowledgments
This study was supported by the European Union FP6 STREP project “Fluoromag.” G. M. H. was also supported by grants from the Grant Agency of the Czech Academy of Sciences (AV0Z5011050), and from the Ministry of Education, Youth, and Sports of the Czech Republic (MSM0021620806 and LC535). This work was also supported in part by grant RR023156 to B.G.B. from the National Institutes of Health. Preparation of the manuscript, analysis of data, and the FRAP experiment using the Leica SP5 CLSM were all performed by G. M. H. at his current address. We acknowledge the contributions of numerous individuals during the years of development of the PAM instrument.
References
- Adam L, Vadlamudi R, Kondapaka SB, Chernoff J, Mendelsohn J, Kumar R. Heregulin regulates cytoskeletal reorganization and cell migration through the p21-activated kinase-1 via phosphatidylinositol-3 kinase. J Biol Chem. 1998;273:28238–28246. doi: 10.1074/jbc.273.43.28238. [DOI] [PubMed] [Google Scholar]
- Ando R, Mizuno H, Miyawaki A. Regulated fast nucleocytoplasmic shuttling observed by reversible protein highlighting. Science. 2004;306:1370–1373. doi: 10.1126/science.1102506. [DOI] [PubMed] [Google Scholar]
- Brakenhoff GJ, Wurpel GWH, Jalink K, Oomen L, Brocks L, Zwier JM. Characterization of sectioning fluorescence microscopy with thin uniform fluorescent layers: Sectioned imaging property or SIP charts. J Microsc. 2005;219:122–132. doi: 10.1111/j.1365-2818.2005.01504.x. [DOI] [PubMed] [Google Scholar]
- Buck I, Foley T, Horn D, Sugerman J, Fatahalian K, Houston M, Hanrahan P. Brook for GPUs: Stream computing on graphics hardware. ACM Trans Graph. 2004;23:777–786. [Google Scholar]
- Fron E, Flors C, Schweitzer G, Habuchi S, Mizuno H, Ando R, DeSchryver FC, Miyawaki A, Hofkens J. Ultrafast excited-state dynamics of the photoswitchable protein Dronpa. J Am Chem Soc. 2007;129:4870–4871. doi: 10.1021/ja069365v. [DOI] [PubMed] [Google Scholar]
- Fulwyler M, Hanley QS, Schnetter C, Young IT, Jares-Erijman EA, Arndt-Jovin DJ, Jovin TM. Selective photoreactions in a programmable array microscope (PAM): Photoinitiated polymerization, photodecaging, and photochromic conversion. Cytometry A. 2005;67A:68–75. doi: 10.1002/cyto.a.20174. [DOI] [PubMed] [Google Scholar]
- Hagen GM, Caarls W, Thomas M, Hill A, Lidke KA, Rieger B, Fritsch C, van Geest B, Jovin TM, Arndt-Jovin DJ. Biological applications of an LCoS-based programmable array microscope. Proc SPIE. 2007;6441:64410S1–12. [Google Scholar]
- Hagen GM, Roess DA, Barisas BG. Fluorescence photobleaching recovery using total internal reflection interference fringes. Anal Biochem. 2006;356:30–35. doi: 10.1016/j.ab.2006.04.044. [DOI] [PubMed] [Google Scholar]
- Hagen GM, Roess DA, de León GC, Barisas BG. High probe intensity photobleaching measurement of lateral diffusion in cell membranes. J Fluoresc. 2005;15:873–882. doi: 10.1007/s10895-005-0012-5. [DOI] [PubMed] [Google Scholar]
- Hanley QS, Lidke KA, Heintzmann R, Arndt-Jovin DJ, Jovin TM. Fluorescence lifetime imaging in an optically sectioning programmable array microscope (PAM) Cytometry A. 2005;67A:112–118. doi: 10.1002/cyto.a.20177. [DOI] [PubMed] [Google Scholar]
- Hanley QS, Verveer PJ, Arndt-Jovin DJ, Jovin TM. Three-dimensional spectral imaging by hadamard transform spectroscopy in a programmable array microscope. J Microsc. 2000;197:5–14. doi: 10.1046/j.1365-2818.2000.00665.x. [DOI] [PubMed] [Google Scholar]
- Hanley QS, Verveer PJ, Gemkow M, Arndt-Jovin DJ, Jovin TM. An optical sectioning programmable array microscope implemented with a digital micromirror device. J Microsc. 1999a;196:317–331. doi: 10.1046/j.1365-2818.1999.00602.x. [DOI] [PubMed] [Google Scholar]
- Hanley QS, Verveer PJ, Jovin TM. Spectral imaging in a programmable array microscope by hadamard transform fluorescence spectroscopy. Appl Spectrosc. 1999b;53:1. doi: 10.1046/j.1365-2818.2000.00665.x. [DOI] [PubMed] [Google Scholar]
- Hanser BM, Gustafsson MGL, Agard DA, Sedat JW. Phase-retrieved pupil functions in wide-field fluorescence microscopy. J Microsc. 2004;216:32–48. doi: 10.1111/j.0022-2720.2004.01393.x. [DOI] [PubMed] [Google Scholar]
- Harwit M, Sloane NJA. Hadamard transform optics. New York: Academic Press; 1979. p. 249. [Google Scholar]
- Heintzmann R. Structured illumination methods. In: Pawley JB, editor. Handbook of biological confocal microscopy. 3. New York: Springer Science+Business Media, LLC; 2006. pp. 265–279. [Google Scholar]
- Heintzmann R, Hanley QS, Arndt-Jovin D, Jovin TM. A dual path programmable array microscope (PAM): Simultaneous acquisition of conjugate and non-conjugate images. J Microsc. 2001;204:119–135. doi: 10.1046/j.1365-2818.2001.00945.x. [DOI] [PubMed] [Google Scholar]
- Ierusalimschy R, deFigueiredo LH, Filho WC. Lua - an extensible extension language. Softw Pract Exper. 1996;26:635–652. [Google Scholar]
- Jovin TM, Hanley QS, Verveer PJ. Confocal spectroscopy system and method. 6,128,077 United States patent. 2000
- Jovin TM, Hanley QS, Verveer PJ. Programmable spatially light modulated microscope and microscopy. 6,399,935 United States patent. 2002
- Jovin TM, Hanley QS, Verveer PJ. Programmable spatially light modulated microscope and microscopy method. EP0911667B1 European patent. 2003
- Kraus MH, Issing W, Miki T, Popescu NC, Aaronson SA. Isolation and characterization of erbB3, a third member of the erbB/epidermal growth factor receptor family: Evidence for overexpression in a subset of human mammary tumors. Proc Natl Acad Sci U S A. 1989;86:9193–9197. doi: 10.1073/pnas.86.23.9193. [DOI] [PMC free article] [PubMed] [Google Scholar]
- Lidke DS, Nagy P, Heintzmann R, Arndt-Jovin DJ, Post JN, Grecco HE, Jares-Erijman EA, Jovin TM. Quantum dot ligands provide new insights into erbB/HER receptor-mediated signal transduction. Nat Biotech. 2004;22:198. doi: 10.1038/nbt929. [DOI] [PubMed] [Google Scholar]
- Lippincott-Schwartz J, Patterson GH, Kevin FS. Methods in cell biology. Academic Press; 2008. Fluorescent proteins for photoactivation experiments; pp. 45–61. [DOI] [PubMed] [Google Scholar]
- McNally JG. Quantitative FRAP analysis of molecular binding dynamics in vivo. Methods Cell Biol. 2008;85:329–351. doi: 10.1016/S0091-679X(08)85014-5. [DOI] [PubMed] [Google Scholar]
- Nagy P, Arndt-Jovin DJ, Jovin TM. Small interfering RNAs suppress the expression of endogenous and GFP-fused epidermal growth factor receptor (erbB1) and induce apoptosis in erbB1-overexpressing cells. Exp Cell Res. 2003;285:39–49. doi: 10.1016/s0014-4827(02)00050-2. [DOI] [PubMed] [Google Scholar]
- Nagy P, Vereb G, Sebestyen Z, Horvath G, Lockett SJ, Damjanovich S, Park JW, Jovin TM, Szollosi J. Lipid rafts and the local density of erbB proteins influence the biological role of homo- and heteroassociations of erbB2. J Cell Sci. 2002;115:4251–4262. doi: 10.1242/jcs.00118. [DOI] [PubMed] [Google Scholar]
- Nickolls J, Buck I, Garland M, Skadron K. Scalable parallel programming with CUDA. ACM Queue. 2008;6:40–53. [Google Scholar]
- Rabut G, Ellenberg J. Photobleaching techniques to study mobility and molecular dynamics of proteins in live cells: FRAP, iFRAP and FLIP. In: Goldman RD, Spector DL, editors. Live cell imaging: A laboratory manual. Cold Spring Harbor: Cold Spring Harbor Laboratory Press; 2005. pp. 101–127. [DOI] [PubMed] [Google Scholar]
- Tanaka J, Yan Y, Choi J, Bai J, Klenchin V, Rayment I, Marriott G. Biomolecular mimicry in the actin cytoskeleton: Mechanisms underlying the cytotoxicity of kabiramide C and related macrolides. Proc Natl Acad Sci U S A. 2003;100:13851–6. doi: 10.1073/pnas.2233339100. [DOI] [PMC free article] [PubMed] [Google Scholar]
- Taylor CM, McCabe EM. Effects of source coherence and aperture array geometry on optical sectioning strength in direct-view microscopy. J Opt Soc Am A. 2002;19:1406–1416. doi: 10.1364/josaa.19.001406. [DOI] [PubMed] [Google Scholar]
- Toomre D, Pawley JB. Disk-scanning confocal microscopy. In: Pawley JB, editor. Handbook of biological confocal microscopy. 3. New York: Springer Science+Business Media, LLC; 2006. pp. 221–238. [Google Scholar]
- Verveer PJ, Gemkow MJ, Jovin TM. A comparison of image restoration approaches applied to three-dimensional confocal and wide-field fluorescence microscopy. J Microsc. 1999;193:50–61. doi: 10.1046/j.1365-2818.1999.00421.x. [DOI] [PubMed] [Google Scholar]
- Verveer PJ, Hanley QS, Verbeek PW, vanVliet LJ, Jovin TM. Theory of confocal fluorescence imaging in the programmable array microscope (PAM) J Microsc. 1998;189:192–198. [Google Scholar]
- Warren CM, Landgraf R. Signaling through erbB receptors: Multiple layers of diversity and control. Cell Signal. 2005;18:923–933. doi: 10.1016/j.cellsig.2005.12.007. [DOI] [PubMed] [Google Scholar]
- Wilson T. The role of the pinhole in confocal imaging system. In: Pawley J, editor. Handbook of biological confocal microscopy. 2. New York: Plenum Press; 1995. pp. 167–182. [Google Scholar]
- Wilson T, Juskaitis R, Neil MAA, Kozubek M. Confocal microscopy by aperture correlation. Opt Lett. 1996;23:1879–1881. doi: 10.1364/ol.21.001879. [DOI] [PubMed] [Google Scholar]
- Wolleschensky R, Zimmermann B, Kempe M. High-speed confocal fluorescence imaging with a novel line scanning microscope. J Biomed Opt. 2006;11:064011. doi: 10.1117/1.2402110. [DOI] [PubMed] [Google Scholar]