

Abstract
High levels of Escherichia coli were frequently detected in tropical soils in Hawaii, which present important environmental sources of E. coli to water bodies. This study systematically examined E. coli isolates from water and soil of several watersheds in Hawaii and observed high overall genotypic diversity (35.5% unique genotypes). In the Manoa watershed, fewer than 9.3% of the observed E. coli genotypes in water and 6.6% in soil were shared between different sampling sites, suggesting the lack of dominant fecal sources in the watershed. High temporal variability of E. coli genotypes in soil was also observed, which suggests a dynamic E. coli population corresponding with the frequently observed high concentrations in tropical soils. When E. coli genotypes detected from the same sampling events were compared, limited sharing between the soil and water samples was observed in the majority of comparisons (73.5%). However, several comparisons reported up to 33.3% overlap of E. coli genotypes between soil and water, illustrating the potential for soil-water interactions under favorable environmental conditions. In addition, genotype accumulation curves for E. coli from water and soil indicated that the sampling efforts in the Manoa watershed could not exhaust the overall genotypic diversity. Comparisons of E. coli genotypes from other watersheds on Oahu, Hawaii, identified no apparent grouping according to sampling locations. The results of the present study demonstrate the complexity of using E. coli as a fecal indicator bacterium in tropical watersheds and highlight the need to differentiate environmental sources of E. coli from fecal sources in water quality monitoring.
INTRODUCTION
The use of Escherichia coli as a fecal indicator organism is contingent upon the validity of the assumption that its presence in the natural environment is the result of a recent fecal contamination. Many studies have challenged the validity of fecal indicator organism use by demonstrating the ability of E. coli to survive for extended periods of time and even grow in various secondary habitats, including soils (6, 8, 18), sediments (1, 4, 16), beach sands (17, 32, 33), and aquatic vegetations (7, 22). E. coli cells from these environmental sources may enter into water bodies when conditions are favorable for such transport, thus complicating water quality monitoring and regulatory efforts.
The ability of E. coli to survive in various environments may be attributable to its vast genetic diversity, as high genetic diversity generally improves the species' adaptability and resistance to environmental changes (28). Based on the 22 E. coli genome sequences completed to date, it is estimated that at least 42,500 gene families exist within the E. coli species (29). At the subspecies or strain level, the enormous genetic diversity of E. coli is manifested by the presence of numerous distinct E. coli genotypes. Using various DNA fingerprinting techniques, including repetitive extragenic palindromic PCR (rep-PCR) (11, 19), ribotyping (2, 9), and pulsed-field gel electrophoresis (PFGE) (27), microbial source tracking studies have detected a large number of distinct genetic profiles (i.e., genotypes) in commensal E. coli isolates from different animal hosts.
The genetic diversity of E. coli isolates in various environments in different geographic and climatic regions has also been investigated. Studies on soil in the Great Lakes region have generally reported a limited diversity of E. coli (8, 18); persistent soil E. coli populations detected in a Lake Michigan watershed were clustered into three main genetic groups based on rep-PCR DNA fingerprinting analysis (8), and 86, 46, and 85% of soil E. coli isolates from three sampling sites within a Lake Superior watershed belonged to the same genotypes (18).
Higher genotypic diversity was often observed in stream or river water than in soil. A survey in a Canadian watershed detected 7,325 unique genotypes out of 21,307 E. coli isolates (34.4% uniqueness) from river water (24). Another study in two central Texas lakes detected 175 unique genotypes out of 555 isolates (31.5% uniqueness) (10). Despite the numerous aforementioned studies into environmental E. coli diversity, few studies have attempted to investigate E. coli genotypic diversity in both soil and water of the same watershed. Furthermore, most previous studies were conducted in watersheds of temperate or subtropical climates.
Hawaii's tropical soils have long been suspected as important sources of E. coli to stream waters due to the consistent presence of high levels of E. coli (13, 15). Although the transport of E. coli from soil to water can be expected during rainfall-derived runoff events when eroded soil particles enter stream water (13), interactions between stream bank soil and water under dry weather conditions are less straightforward. In the absence of surface runoff, E. coli cells from soil would need to go through a multiprocess transport pathway through the vadose zone and soil-water interface to reach stream water.
Given the high genotypic diversity of E. coli (24), tracking environmental E. coli through such a complex pathway is experimentally challenging and requires an innovative approach. In one approach used in microbial source tracking studies, dominant E. coli genotypes from contaminated bodies of water are compared with host-specific libraries to infer potential host sources (19, 34). In the present study, we propose a similar approach involving the comparison of dominant E. coli genotypes in stream bank soil and water at the same location, which could also be used to assess the relative importance of stream bank soil as a potential source of E. coli to water.
The overall goal of this study was to examine the genotypic diversity of E. coli in the soil and water of watersheds in Hawaii's tropical climate. Environmental E. coli isolates were obtained from sampling sites in the forest and urban reaches of the Manoa watershed, and spatial and temporal variations of E. coli genotypes detected within the watershed were investigated. To assess the potential of soil as a source of E. coli to stream water, E. coli genotypes detected in stream bank soil and stream water at the same locations were compared and used to infer potential soil-water interactions. Furthermore, E. coli genotypes from three additional watersheds on the island of Oahu, Hawaii, were obtained and compared with those from the Manoa watershed.
MATERIALS AND METHODS
Sampling sites.
Field sampling efforts were performed in the Manoa, Opaeula, Waikele, and Kahana watersheds, which are located at different regions on the island of Oahu, Hawaii (Fig. 1A). The Manoa watershed is a typical urban Oahu stream that starts in the forest of the Koolau Mountain Range, passes through the residential community of Manoa Valley, and finally discharges via the Ala Wai Canal into the ocean. The stream has a total length of approximately 3 miles and a total drainage area of 4,000 acres. Soil and water samples for E. coli isolation were collected at six sampling sites, three in the forest region and three in the urban region, along the stream (Fig. 1B). The global positioning system (GPS) coordinates for the six sampling sites are as follows: for site A, 21°20′33.20′′N and 157°47′57.70′′W; for site B, 21°20′18.82′′N and 157°48′00.24′′W; for site C, 21°20′07.66′′N and 157°47′58.12′′W; for site D, 21°18′48.56′′N and 157°48′23.81′′W; for site E, 21°18′26.44′′N and 157°48′31.73′′W; and for site F, 21°17′34.38′′N and 157°48′47.53′′W. The three other Oahu watersheds were also sampled but to a lesser extent than the Manoa watershed. The Waikele watershed is located on the west side of Oahu and drains upstream forest, agricultural, and urban lands over its 5-mile length. The GPS coordinates for the Waikele sampling sites are as follows: 21°23′06.06′′N and 158°00′46.18′′W, 21°24′06.89′′N and 158°00′55.22′′W, 21°27′53.03′′N and 158°01′19.71′′W, 21°28′40.88′′N and 158°00′31.05′′W, and 21°28′04.44′′N and 157°57′21.52′′W. The Opaeula watershed is located on the north side of Oahu and drains upstream forest and downstream agricultural lands, and the GPS coordinates for the sampling sites are 21°34′50.53′′N and 158°06′01.43′′W and 21°18′48.56′′N and 157°48′23.81′′W. The Kahana watershed is located on the windward (northeast) side of Oahu and consists primarily of forest that receives significantly more precipitation than the other watersheds. The GPS coordinates for the Kahana sampling site are 21°32′14.90′′N and 157°53′05.68′′W.
Fig. 1.
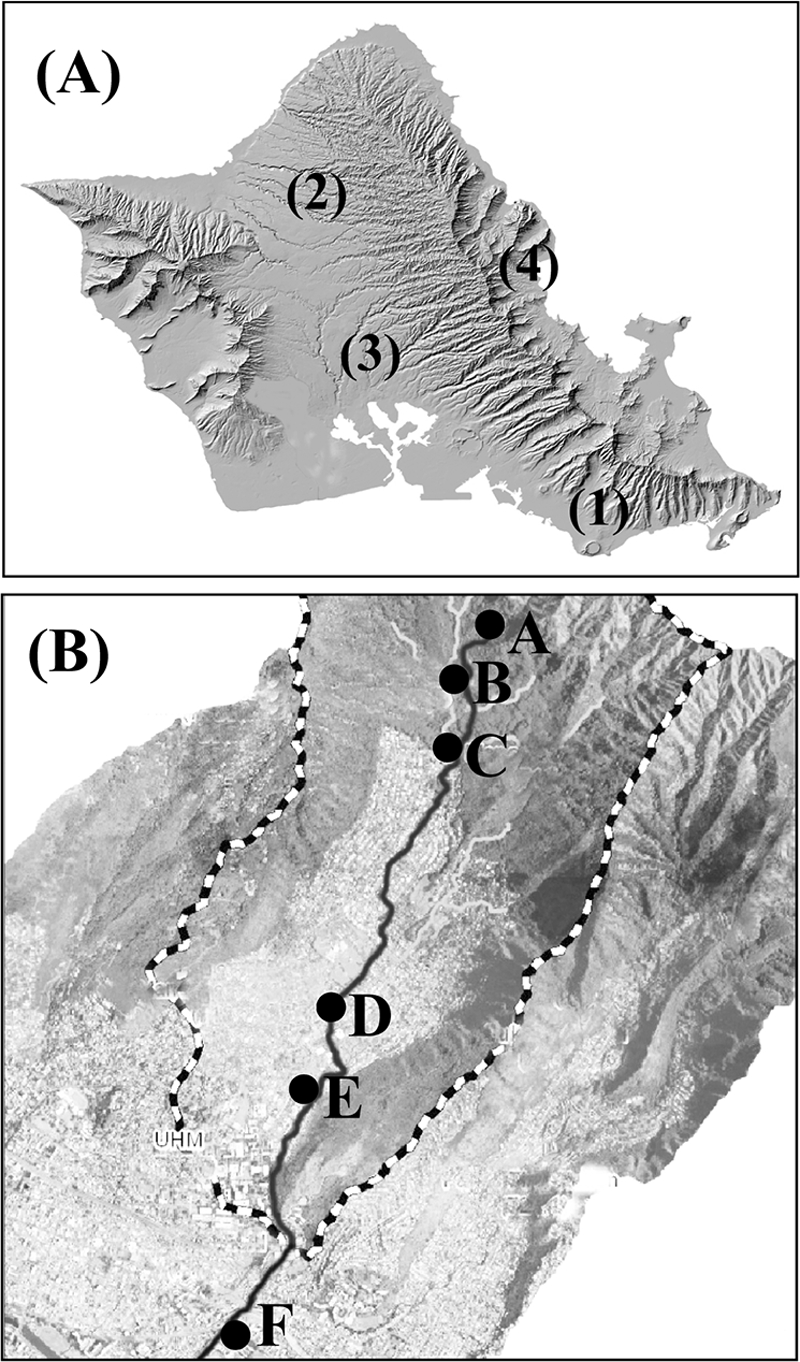
Geographic locations of Manoa (1), Opaeula (2), Waikele (3), and Kahana (4) watersheds on the island of Oahu, Hawaii (map modified from the USGS [http://hawaii.wr.usgs.gov/oahu/]) (A) and sampling sites in the Manoa watershed (map from the Hawaii Statewide GIS Program) (B). Sites A, B, and C are in the rainforest, while sites D, E, and F are in the urban region.
E. coli isolation.
Stream water samples (1 liter in sterile propylene bottles) were collected directly from flowing water by standing on the stream bank. Soil samples were collected at four different distances (i.e., 0, 1, 3, and 5 m) from the stream bank at each sampling site. At each location, about 200 g of surface soil (i.e., 0 to 4 cm from the surface after removing surface debris) was collected using a clean shovel (i.e., wiped with 70% ethanol and air dried) and then stored in sterile plastic bags. The water and soil samples were stored in the dark at 4°C and processed immediately (for water samples) or within 24 h (for soil samples). Soil samples were first extracted using ammonium phosphate buffer (APB) to release soil E. coli cells in a procedure based on previously described techniques for tropical soils (20). Ten milliliters of the soil extract supernatant was filtered through sterile GN-6 membranes (Pall Life Science, Port Washington, NY) and then incubated to selectively grow E. coli using the modified membrane thermotolerant E. coli agar (mTEC) method (31). Stream water samples were filtered directly through the membranes and then placed onto modified mTEC agar for the growth of E. coli (31). Presumptive E. coli colonies on modified mTEC agar plates were randomly picked and streaked onto LB agar for purification. The authenticity of the E. coli isolates was then verified by indole–methyl red–Voges-Proskauer–citrate (IMViC) tests, which resulted in verification ratios higher than 95%, and the verified E. coli isolates were used in subsequent genotypic analysis. E. coli isolates obtained from soil samples collected at the four distances at each sampling location were grouped together to collectively represent the soil of that sampling location. The E. coli isolates were stored in Hogness modified freezing medium (HMFM) and frozen at −80°C.
rep-PCR DNA fingerprinting.
Genomic DNA fingerprinting of E. coli isolates was performed using a procedure described by Dombek et al. (11). Briefly, fresh E. coli cells were grown overnight on LB agar and then gently treated with 0.05 N NaOH to release total genomic DNA. The total genomic DNA in solution was separated from cell debris by centrifugation at 250 rpm for 10 min. The supernatants containing total genomic DNA were used as templates in PCR amplification for rep-PCR DNA fingerprinting (11). Following amplification, the PCR amplicons were electrophoresed, and the gel images were obtained using a Typhoon scanner (GE Health, Piscataway, NJ) and processed with GelCompar II software package (Applied Maths, Kortrijk, Belgium).
Genotype clustering and identification.
The DNA banding pattern for each isolate (i.e., fingerprint) was normalized for intergel comparisons using an external DNA size marker (DNA Hyperladder I; Bioline, Taunton, MA) that was loaded into end lanes of each gel. A standard reference strain, E. coli ATCC 25922, was also run in each electrophoresis gel as an internal control to determine gel-to-gel variations. All fingerprint images were loaded into a database and processed using GelCompar II. Dendrograms were created based on Pearson's correlation unweighted-pair group method using arithmetic averages.
The identification of unique E. coli genotypes was based on a cutoff value established by DNA fingerprints of the internal control strain E. coli ATCC 25922. When rep-PCR fingerprints of the ATCC 25922 strain from repeated analyses in all gels were compared in a dendrogram, fingerprints clustered with an 80% similarity. This 80% cutoff value was used to subsequently cluster environmental E. coli isolates into different genotypes; a cluster of E. coli isolates with an 80% or higher dendrogram similarity was regarded as one genotype, while an isolate that did not cluster with any other E. coli isolates based on the 80% cutoff was given its own genotype.
Analysis of E. coli genotypes.
To compare E. coli isolates spatially, rep-PCR DNA fingerprints were used in analyses of genotype dendrogram clustering and identification as described above. After the total number of unique E. coli genotypes was calculated, the distribution of the genotypes and their respective occurring frequencies in water and soil samples from each sampling site were determined. The temporal comparison of genotypes at each sampling site was conducted similarly to the spatial comparison. The rep-PCR DNA fingerprints of E. coli isolates at all sampling sites over the sampling period were used in a single clustering analysis to identify unique genotypes. Then, the level of reoccurrence of particular genotypes at the same sampling sites at different sampling dates was determined.
To construct genotype accumulation curves, the unique genotypes and their abundances (i.e., how many isolates share the same genotypes) were calculated and then processed using EcoSim 700 software (14). To estimate the sharing of E. coli genotypes between soil and water at individual sampling sites, the number of genotypes found in both soil and water was divided by the total number of genotypes to calculate the ratio of overlap. The rep-PCR DNA fingerprints of E. coli isolates from different watersheds were compared using principal-component analysis (PCA). The DNA banding patterns of all isolates to be analyzed were used together to generate a banding character matrix using GelCompar II software, and the matrix was then analyzed to identify principal components using StatistiXL add-in software (Kalamunda, Australia) for Microsoft Excel.
RESULTS
E. coli isolates from Hawaii watersheds.
E. coli isolates were obtained from the soil and water of four watersheds on the island of Oahu, Hawaii (Table 1). In the Manoa watershed, two sampling schemes were utilized to assess the spatial and temporal variations of E. coli genotypes. To determine spatial variation, 146 and 136 E. coli isolates were obtained from water and soil samples, respectively, collected on 15 May 2009. Temporal variation was determined by obtaining additional, smaller numbers of E. coli isolates per sample during five subsequent Manoa sampling events, which yielded a total of 494 and 144 E. coli isolates from soil and water samples, respectively. E. coli isolates were also obtained from three other watersheds on the island of Oahu on single sampling events and at either single or multiple sampling sites (Table 1). Overall, 459 isolates from water samples and 810 isolates from soil samples were obtained and used in this study.
Table 1.
E. coli isolates collected from Manoa and other Hawaiian watersheds
| Watershed (no. of sampling sites) | Sampling event(s): date(s) (mo/day/yr) | No. of isolates per site |
Total no. of isolates |
||
|---|---|---|---|---|---|
| Water | Soil | Water | Soil | ||
| Manoa (6) | Single: 5/15/2009 | 10–31 | 8–37 | 146 | 136 |
| Multiple: 6/8/2009, 8/31/2009, 10/14/2009, 12/21/2009, 2/24/2010 | 3–6 | 5–26 | 144 | 494 | |
| Opaeula (2) | Single: 4/29/2010 | 30 | 25 | 60 | 50 |
| Waikele (5) | Single: 9/30/2009 | 10 | 25 | 50 | 130 |
| Kahana (1) | Single: 4/29/2010 | 59 | 59 | ||
Spatial variation of E. coli genotypes in the Manoa watershed.
The 146 E. coli isolates from stream water were analyzed by rep-PCR DNA fingerprinting and then grouped into 75 unique genotypes based on cluster analysis. The distribution of genotypes among the six sampling sites and their detection frequencies (i.e., the number of isolates per genotype) at different sites are shown in Fig. 2.
Fig. 2.

Distribution of the total 75 unique E. coli genotypes from water (x axis) and their detection frequencies (y axis) at the six sampling sites (sites A to F).
The E. coli isolates from stream water showed considerable spatial variation in genotype regardless of land use. There were no genotypes detected at more than one forest sampling site, and only two genotypes (i.e., 2.6% of 75) were detected at more than one urban sampling site. Overall, there were seven genotypes (9.3% of 75) shared between the urban and forest sites (i.e., appearance in at least one forest site and one urban site). The genotypic distribution of each sample appears to include a few dominant genotypes and a larger number of rare genotypes. Although some genotypes (e.g., genotype 51 at site F) exhibited high detection frequencies and appeared to be the dominant genotypes at the sampling sites, the majority of genotypes (82.7%) were represented by two or fewer isolates. Furthermore, the dominant genotypes from the different sampling sites did not overlap, which further illustrates the large spatial variation of E. coli genotypes in the stream water.
The 136 E. coli isolates obtained from stream bank soil were also analyzed by DNA fingerprinting and subsequently grouped into 61 unique genotypes. Similarly to observations in stream water, E. coli in soil also exhibited considerable spatial variation in the observed genotypes. The two different land uses did not significantly affect the genotypic diversity (Fig. 3). There were four E. coli genotypes (i.e., 6.6% of 61) detected at more than one forest soil site, while there were no genotypes shared among the urban soil sites. Of the 61 unique genotypes, no genotype was shared between the urban and forest soil sites. The E. coli genotypes detected in soil appeared to have slightly higher detection frequencies than those in water. Overall, 54.1% of genotypes were represented by two or fewer isolates. Some of the genotypes were likely present in the soil at high levels as indicated by high isolation frequencies. For example, at site F, genotypes 35 and 43 were represented by 7 and 8 isolates, respectively (Fig. 3).
Fig. 3.

Distribution of the total 61 unique E. coli genotypes from soil (x axis) and their detection frequencies (y axis) at the six sampling sites (sites A to F).
Temporal variation of E. coli genotypes.
E. coli isolates were obtained from water and soil samples collected at five additional sampling dates during a 9-month period in the Manoa watershed (Table 1). The E. coli isolates were fingerprinted and clustered to identify unique genotypes (Table 2). The frequencies of obtaining a unique E. coli genotype, as indicated by ratios of genotypes versus isolates, were 0.64 for isolates from water, 0.43 to 0.48 for isolates from forest soil sites, and 0.44 to 0.46 for isolates from urban soil sites, which are similar to the frequencies observed in the spatial investigation. E. coli genotypes were subsequently categorized into five groups (i.e., groups 1, 2, 3, 4, and 5 [Table 2]) based on their detection during the five different sampling dates, and the distributions of the genotypes in the five groups were calculated to illustrate temporal variation (Table 2). For the isolates from water, 86.7% of genotypes were detected at only one sampling, 12.2% were detected at two different samplings, and no genotypes appeared more than two times over the five sampling dates. The overlap of genotypes detected in soil was slightly lower because individual sampling sites were considered separately. The ratios of genotypes detected twice over the six sampling dates ranged from 3.4 to 7.3% for forest soil sites and 2.9 to 5.1% for urban soil sites, indicating no significant difference between the two land uses. At only one site (urban site F) was one genotype detected during three different sampling dates. The small percentages of E. coli genotypes detected during more than one sampling date in water or in soil at the same site (2.9 to 12.2%) indicate a strong temporal variation of the observed E. coli genotypes in the Manoa watershed.
Table 2.
Temporal variation of E. coli genotypes in Manoa stream water and bank soil
| Site | Frequency (ratio of genotypes/isolates) | % genotypes detected at multiple sampling eventsb |
||
|---|---|---|---|---|
| Group 1 | Group 2 | Group 3 | ||
| Water (overall)a | 0.64 | 86.7 | 12.2 | 0 |
| Soil | ||||
| Site A | 0.46 | 96.6 | 3.4 | 0 |
| Site B | 0.48 | 92.7 | 7.3 | 0 |
| Site C | 0.43 | 94.4 | 5.6 | 0 |
| Site D | 0.46 | 94.9 | 5.1 | 0 |
| Site E | 0.44 | 97.1 | 2.9 | 0 |
| Site F | 0.44 | 93.3 | 3.3 | 3.3 |
Water E. coli isolates from all six sampling sites were pooled in the analysis.
Group 4 and group 5 have zero values, as no genotypes were detected during more than three sampling events.
Sharing of E. coli genotypes between soil and water.
To assess the potential of soil as a source of E. coli to stream water, E. coli isolates from stream bank soil and water from the Manoa watershed were compared to determine the extent of genotypic sharing. An example comparison of rep-PCR DNA fingerprints of E. coli isolates from soil and water of one sampling site during one sampling is shown in Fig. 4. After unique genotypes were identified, a ratio of genotypic overlap was calculated for each sampling site by dividing the number of identical genotypes in stream bank soil and stream water by the overall number of genotypes (Table 3). This comparison between soil and water genotypes was performed for all sampling events. In general, there appeared to be a limited overlap of E. coli genotypes between stream bank soil and stream water. Out of a total of 34 valid comparisons, 14 had a value of 0, indicating no overlap of E. coli genotypes, and 11 comparisons had values between 0 and 0.100. There were nine comparisons that had values equal to or greater than 0.10, two of which had values equal to 0.333 (i.e., 33.3% of the unique E. coli genotypes found at that site during a particular sampling event were isolated from both water and soil samples). The sharing of genotypes between soil and water did not appear to be related to land use, as no distinct patterns were detected between forest sites A, B, and C and urban sites D, E, and F.
Fig. 4.

Example dendrogram showing the genetic relatedness of E. coli isolates from soil and water at Manoa site F based on their rep-PCR DNA fingerprints. The dashed vertical line indicates the cutoff value for identifying unique genotypes.
Table 3.
Ratios of shared genotypes between soil and water at individual sampling sites and on individual dates
| Sampling site | Ratio on indicated sampling date (mo/day/yr) |
|||||
|---|---|---|---|---|---|---|
| 5/15/2009 | 6/8/2009 | 8/31/2009 | 10/14/2009 | 12/21/2009 | 2/24/2010 | |
| A | 0.038 | 0 | 0.071 | 0.043 | 0.059 | 0 |
| B | 0.040 | 0.091 | 0.222 | 0 | 0 | NAWa |
| C | 0 | 0.333 | 0.056 | 0.100 | 0 | NASb |
| D | 0.031 | 0 | 0.143 | 0 | 0 | 0.100 |
| E | 0.095 | 0 | 0 | 0 | 0 | 0.067 |
| F | 0.118 | 0.333 | 0 | 0.067 | 0.125 | 0.111 |
NAW, no E. coli isolated from stream water.
NAS, no E. coli isolated from soil.
E. coli genotypic diversity in Hawaii's tropical watersheds.
Out of 630 soil and 290 water E. coli isolates from the Manoa watershed, a total number of 327 unique genotypes were identified. Genotype accumulation curves for isolates from both water and soil did not result in asymptotes (Fig. 5A), indicating that the number of isolates examined reflects only a fraction of total E. coli diversity. When all E. coli isolates from the Manoa watershed were combined to construct a rank abundance curve, a fairly even distribution of genotypes was observed (Fig. 5B). Of those genotypes, the three most abundant contained 26, 23, and 18 isolates, representing only 7.3% of the total number of E. coli isolates. The remaining 291 genotypes contained five or fewer isolates, and 153 of those genotypes were represented by a single isolate.
Fig. 5.

Accumulation curves for E. coli genotypes isolated from stream water and soil (A), and rank abundance curve for the pooled water and soil E. coli isolates (B).
E. coli isolates from three additional watersheds located at different regions on the island of Oahu were obtained and compared with those observed in the Manoa watershed (Table 1). Fifty and 130 E. coli isolates from the soil of Opaeula and Waikele watersheds were grouped into 18 and 51 unique genotypes, corresponding to 36.0% and 39.2% uniqueness, respectively. The rep-PCR fingerprints of soil E. coli isolates from Opaeula (50 isolates), Waikele (130 isolates), and Manoa (667 isolates) were clustered using principal-component analysis (PCA). The first two principal components (i.e., PC1 and PC2) were used to illustrate genotypic relatedness. The soil E. coli genotypes from the Opaeula watershed and the Waikele watershed did not group separately and did not separate from the much larger genotype library of the Manoa watershed (Fig. 6A).
Fig. 6.

Clustering of E. coli isolates obtained from soil (A) and water (B) from different watersheds, based on principal-component analysis of rep-PCR DNA fingerprints. Symbols in the foreground denote Waikele (open triangle), Opaeula (open square), and Kahana (open circle) watersheds, and the symbol in the background denotes the Manoa watershed (gray circle).
E. coli isolates from water (50 from Waikele stream, 60 from Opaeula stream, and 59 from Kahana stream) were grouped into 25, 25, and 31 unique genotypes, corresponding to 50.0%, 41.7%, and 52.5% unique recovery, respectively. The E. coli genotypes isolated from stream water in the three watersheds were compared with each other and also compared with those found in the Manoa watershed by using PCA analysis (Fig. 6B). Like the soil E. coli isolates, water E. coli isolates in the relatively small libraries of the Waikele, Opaeula, and Kahana watersheds did not cluster separately by watershed and did not separate from the E. coli genotypes of the Manoa stream.
DISCUSSION
The tropical soil and water of Hawaii's watersheds contain high levels of E. coli, which was often attributed to the particular geographic and climatic features of the Hawaii islands (6, 13, 15). Numerous recent studies, however, have indicated that the survival and even growth of E. coli in the environment are also widespread in other temperate and subtropical regions, where E. coli was found to persist in soils (6, 8, 18), sediments (1, 4, 16), beach sands (17, 32, 33), and aquatic vegetation (7, 22). To further understand the source, fate, and implications for water quality regulation, environmental E. coli isolates from temperate regions have been genetically characterized to observe various levels of genotypic diversity (8, 18, 24, 25). Although the environmental genotypic diversity of E. coli has been well studied in temperate regions, it appears that studies in tropical climates have yet to be conducted. In the present study, a large number of environmental E. coli isolates were systematically obtained from Hawaii's tropical watersheds to study the spatial and temporal variations and overall genotypic diversities of E. coli in both water and soil.
Although E. coli is one of the most widely used fecal indicator bacteria, the genotypic diversity of E. coli in water has traditionally received little attention because current water quality standards are based primarily on concentrations. Recent discoveries of environmental reservoirs of E. coli (1, 4, 6, 13) have prompted the need for an improved understanding of the genotypic diversity of E. coli in natural waters.
In the present study, it was observed that the genotypic composition of E. coli from tropical stream water is similar to that found in studies conducted in temperate regions (8, 18, 21). Individual water samples from the Manoa watershed usually contained several dominant genotypes with high abundances and a large number of rare genotypes with lower abundances (Fig. 2). The present study also showed that the overall genotypic diversity of E. coli in Manoa stream water was very large, as the 290 E. coli isolates from the Manoa stream water covered only a fraction of the overall E. coli genotypic diversity. High genotypic diversity in water is in agreement with previous studies in temperate regions, where much larger E. coli isolate libraries could not sample environmental E. coli diversity to saturation (24).
Interestingly, this study observed considerable genotypic variability in water samples collected within 2 h of each other and from sites located no more than 2 miles apart along the Manoa stream. This spatial variation differs from results of studies in temperate regions, where the same dominant E. coli genotypes were observed at different locations in rivers affected by agricultural (24) and urban (25) land uses. A possible explanation for the high spatial variation in Manoa stream water could be the lack of dominant point fecal sources along the stream. Instead, E. coli cells of different genotypes enter the stream water at different locations from nonpoint sources. Potential nonpoint sources of E. coli in the Manoa watershed include sewer leakages, domesticated pets, wild birds, and other animals, which are found throughout the watershed. Alternatively, environmental E. coli sources, such as soil, may very well contribute E. coli to stream water, as high levels of E. coli consistently exist in the tropical soil of the Manoa watershed, even in the more pristine forest regions (D. K. Goto and T. Yan, submitted for publication).
The genotypic diversity of E. coli in the stream bank soil was also very high and comparable to that of E. coli in water (Fig. 3). This is significantly different from results of studies in temperate regions, which have shown less E. coli genotypic diversity in soil than in water (8, 18). Persistent soil E. coli populations detected in a Lake Michigan watershed were clustered into only three main genetic groups based on rep-PCR DNA fingerprinting analysis (8). A Lake Superior watershed study identified 86, 46, and 85% of E. coli isolates from three sampling sites as belonging to the same genotypes (18).
E. coli concentrations in the tropical soil of Hawaii are often observed to be significantly greater than those in temperate soils (5, 15, 26). A recent study detected up to 106.26 CFU of E. coli per 100 g soil in forest soil of the Manoa watershed (Goto and Yan, submitted). Given the increasing evidence supporting E. coli as an autochthonous member of the soil microbial community, it may be reasonable to expect a mechanistic linkage between the high concentration and the high genotypic diversity in tropical soil. Hawaii's tropical soils contain nutrients sufficient to support the growth of E. coli (6), while warm temperatures are known to promote the growth of E. coli in soil environments (18).
In this study, E. coli genotypes in soil also exhibited large spatial and temporal variations. Although the spatial variation of E. coli genotypes in soil was expected because of the heterogeneity of soil environments, it was interesting to observe that even dominant E. coli genotypes changed over time at the same sampling locations. This temporal variation of E. coli genotypes in soil differs from previous observations in temperate regions, where certain E. coli genotypes have been found to persist over long periods of time (8, 18). The temporal variation of E. coli genotypes in soil may also be associated with the high abundance of E. coli in the tropical soils of Hawaii (6, 15; Goto and Yan, submitted) and the ability of soils to support the growth of environmental E. coli strains (6). The overall high concentrations of E. coli in soil permit the presence of a large number of rare genotypes that could grow readily when soil conditions change and subsequently lead to a shift in dominant E. coli genotypes (1, 3).
Hawaii's tropical soils have long been suspected as important sources of E. coli to stream waters because of the presence of high levels of E. coli (13, 15). The present study showed that the comparison of predominant E. coli genotypes can provide valuable information about overlaps of genotypes between stream bank soil and water. Although the high overall genotypic diversity of environmental E. coli prohibits sampling to saturation (24), the sample sizes in this study should permit the assumption that the observed genotypes represented the dominant E. coli genotypes at the sampling locations.
The sharing of detected genotypes between stream bank soil and water in the present study was generally limited. Overall, 73.5% of the comparisons showed a genotypic overlap below 10%. Considering the high spatial variations (i.e., low spatial overlaps) observed in the Manoa watershed (Fig. 2 and 3), the low overlap ratios between stream bank soil and water do not automatically indicate the lack of interactions. On the other hand, 9 out of 34 comparisons had values equal to or larger than 10%, while two comparisons observed 33.3% of common E. coli genotypes in both water and soil (Table 3). Although the relatively high genotypic overlaps occurred much less frequently (26.5%) and more often between water and soil near water, they illustrate the potential of genotype sharing between stream bank soil and water. It remains to be determined whether such genotypic similarity is a direct result of E. coli exchange between stream bank soil and water. Further research considering the soil-water hydrological interactions and groundwater contributions is needed to fully understand the potential of soil as a reservoir of E. coli to water.
Another factor that may affect the genetic diversity of E. coli in the environment is land use. It is widely observed that urban and agricultural land uses are often associated with higher levels of environmental E. coli (12, 23, 30) than forest land uses (30; Goto and Yan, submitted). Studies performed at different watersheds have indicated that water affected by urban land use (25) may contain lower E. coli genotypic diversity than water affected by agricultural land use (10, 24). However, a study of the effect of different land uses on the genotypic diversity of E. coli in the same watershed, which theoretically should provide more-meaningful comparisons, has not been attempted before. The Manoa watershed includes urban and forest land uses within a very short geographic distance, providing for a model system for studying the effects of urban and forest land uses on the genetic diversity of environmental E. coli within the same watershed. The present study showed that the genotypic diversity of environmental E. coli in soil and water was not significantly affected by different land uses in the Manoa watershed. A potential explanation for this phenomenon may be the lack of dominant fecal sources in both urban and forest regions of the Manoa stream, which should be considered when extrapolating findings to other watersheds.
In summary, the present study observed high genotypic diversity of environmental E. coli isolates from stream water and bank soil in Hawaii's tropical watersheds. The high spatial variations of E. coli genotypes in stream water suggest a lack of dominant point sources of E. coli in the Manoa watershed during samplings, further indicating the importance of differentiating point and nonpoint E. coli sources in water quality monitoring. The high temporal variations of E. coli genotypes in soil indicate a dynamic E. coli population in tropical soil, which corresponds to the often observed high E. coli concentrations. Further research into the relationship between high genotypic diversity and high abundance of E. coli in tropical soils would provide insight about the survival strategy of E. coli in soil environments. The present study also illustrated the feasibility of using a genotypic comparison approach to assess the sharing of E. coli between environmental soil and water habitats and in part demonstrated that soil can be an important contributor of E. coli to stream water under certain conditions. Taken together, the present study further questions the use of the mere concentration of E. coli in water as an indicator of fecal contamination in tropical environments and highlights the need to holistically consider various factors, including E. coli genotypic diversity, watershed conditions, and the presence of secondary E. coli sources, in water quality monitoring and assessment.
ACKNOWLEDGMENTS
We thank Lavane Kim, Fan Feng, and Ross Nakahara for their assistance in sampling and sample processing and Bunnie Yoneyama for her technical support in the laboratory.
This material is based upon work supported by the Cooperative State Research, Education, and Extension Service, U.S. Department of Agriculture, under agreement no. 2009-35102-05212 (to T.Y.).
Footnotes
Published ahead of print on 22 April 2011.
REFERENCES
- 1. Anderson K. L., Whitlock J. E., Harwood V. J. 2005. Persistence and differential survival of fecal indicator bacteria in subtropical waters and sediments. Appl. Environ. Microbiol. 71:3041–3048 [DOI] [PMC free article] [PubMed] [Google Scholar]
- 2. Anderson M. A., Whitlock J. E., Harwood V. J. 2006. Diversity and distribution of Escherichia coli genotypes and antibiotic resistance phenotypes in feces of humans, cattle, and horses. Appl. Environ. Microbiol. 72:6914–6922 [DOI] [PMC free article] [PubMed] [Google Scholar]
- 3. Brennan F. P., Abram F., Chinalia F. A., Richards K. G., O'Flaherty V. 2010. Characterization of environmentally persistent Escherichia coli isolates leached from an Irish soil. Appl. Environ. Microbiol. 76:2175–2180 [DOI] [PMC free article] [PubMed] [Google Scholar]
- 4. Byappanahalli M., Fowler M., Shively D., Whitman R. 2003. Ubiquity and persistence of Escherichia coli in a midwestern coastal stream. Appl. Environ. Microbiol. 69:4549–4555 [DOI] [PMC free article] [PubMed] [Google Scholar]
- 5. Byappanahalli M., Fujioka R. 2004. Indigenous soil bacteria and low moisture may limit but allow faecal bacteria to multiply and become a minor population in tropical soils. Water Sci. Technol. 50:27–32 [PubMed] [Google Scholar]
- 6. Byappanahalli M. N., Fujioka R. S. 1998. Evidence that tropical soil environment can support the growth of Escherichia coli. Water Sci. Technol. 38:171–174 [Google Scholar]
- 7. Byappanahalli M. N., Shively D. A., Nevers M. B., Sadowsky M. J., Whitman R. L. 2003. Growth and survival of Escherichia coli and enterococci populations in the macro-alga Cladophora (Chlorophyta). FEMS Microbiol. Ecol. 46:203–211 [DOI] [PubMed] [Google Scholar]
- 8. Byappanahalli M. N., Whitman R. L., Shively D. A., Sadowsky M. J., Ishii S. 2006. Population structure, persistence, and seasonality of autochthonous Escherichia coli in temperate, coastal forest soil from a Great Lakes watershed. Environ. Microbiol. 8:504–513 [DOI] [PubMed] [Google Scholar]
- 9. Carson C. A., Shear B. L., Ellersieck M. R., Asfaw A. 2001. Identification of fecal Escherichia coli from humans and animals by ribotyping. Appl. Environ. Microbiol. 67:1503–1507 [DOI] [PMC free article] [PubMed] [Google Scholar]
- 10. Casarez E. A., Pillai S. D., Di Giovanni G. D. 2007. Genotype diversity of Escherichia coli isolates in natural waters determined by PFGE and ERIC-PCR. Water Res. 41:3643–3648 [DOI] [PubMed] [Google Scholar]
- 11. Dombek P. E., Johnson L. K., Zimmerley S. T., Sadowsky M. J. 2000. Use of repetitive DNA sequences and the PCR to differentiate Escherichia coli isolates from human and animal sources. Appl. Environ. Microbiol. 66:2572–2577 [DOI] [PMC free article] [PubMed] [Google Scholar]
- 12. Doran J. W., Linn D. M. 1979. Bacteriological quality of runoff water from pastureland. Appl. Environ. Microbiol. 37:985–991 [DOI] [PMC free article] [PubMed] [Google Scholar]
- 13. Fujioka R. S., Tenno K., Kansako S. 1988. Naturally occurring faecal coliforms and faecal streptococci in Hawaii's freshwater streams. Toxic. Assess. 3:613–630 [Google Scholar]
- 14. Gotelli N. J., Entsminger G. L. 2004. EcoSim: null models software for ecology, version 7. Acquired Intelligence, Inc., and Kesey-Bear, Burlington, VT [Google Scholar]
- 15. Hardina C. M., Fujioka R. S. 1991. Soil: the environmental source of Escherichia coli and enterococci in Hawaii's streams. Environ. Toxicol. Water Qual. 6:185–195 [Google Scholar]
- 16. Hood M. A., Ness G. E. 1982. Survival of Vibrio cholerae and Escherichia coli in estuarine waters and sediments. Appl. Environ. Microbiol. 43:578–584 [DOI] [PMC free article] [PubMed] [Google Scholar]
- 17. Ishii S., Hansen D. L., Hicks R. E., Sadowsky M. J. 2007. Beach sand and sediments are temporal sinks and sources of Escherichia coli in Lake Superior. Environ. Sci. Technol. 41:2203–2209 [DOI] [PubMed] [Google Scholar]
- 18. Ishii S., Ksoll W. B., Hicks R. E., Sadowsky M. J. 2006. Presence and growth of naturalized Escherichia coli in temperate soils from Lake Superior watersheds. Appl. Environ. Microbiol. 72:612–621 [DOI] [PMC free article] [PubMed] [Google Scholar]
- 19. Johnson L. K., et al. 2004. Sample size, library composition, and genotypic diversity among natural populations of Escherichia coli from different animals influence accuracy of determining sources of fecal pollution. Appl. Environ. Microbiol. 70:4478–4485 [DOI] [PMC free article] [PubMed] [Google Scholar]
- 20. Kingsley M. T., Bohlool B. B. 1981. Release of Rhizobium spp. from tropical soils and recovery for immunofluorescence enumeration. Appl. Environ. Microbiol. 42:241–248 [DOI] [PMC free article] [PubMed] [Google Scholar]
- 21. Kon T., Weir S. C., Howell E. T., Lee H., Trevors J. T. 2007. Genetic relatedness of Escherichia coli isolates in interstitial water from a Lake Huron (Canada) beach. Appl. Environ. Microbiol. 73:1961–1967 [DOI] [PMC free article] [PubMed] [Google Scholar]
- 22. Ksoll W. B., Ishii S., Sadowsky M. J., Hicks R. E. 2007. Presence and sources of fecal coliform bacteria in epilithic periphyton communities of Lake Superior. Appl. Environ. Microbiol. 73:3771–3778 [DOI] [PMC free article] [PubMed] [Google Scholar]
- 23. Larned S. T., Scarsbrook M. R., Snelder T. H., Norton N. J., Biggs B. J. F. 2004. Water quality in low-elevation streams and rivers of New Zealand: recent state and trends in contrasting land-cover classes. N. Z. J. Mar. Freshwater Res. 38:347–366 [Google Scholar]
- 24. Lyautey E., et al. 2010. Distribution and diversity of Escherichia coli populations in the South Nation river drainage basin, eastern Ontario, Canada. Appl. Environ. Microbiol. 76:1486–1496 [DOI] [PMC free article] [PubMed] [Google Scholar]
- 25. McLellan S. L. 2004. Genetic diversity of Escherichia coli isolated from urban rivers and beach water. Appl. Environ. Microbiol. 70:4658–4665 [DOI] [PMC free article] [PubMed] [Google Scholar]
- 26. Oshiro R., Fujioka R. 1995. Sand, soil, and pigeon droppings: sources of indicator bacteria in the waters of Hanauma Bay, Oahu, Hawaii. Water Sci. Technol. 31:251–254 [Google Scholar]
- 27. Parveen S., Hodge N. C., Stall R. E., Farrah S. R., Tamplin M. L. 2001. Phenotypic and genotypic characterization of human and nonhuman Escherichia coli. Water Res. 35:379–386 [DOI] [PubMed] [Google Scholar]
- 28. Rauch E. M., Bar-Yam Y. 2004. Theory predicts the uneven distribution of genetic diversity within species. Nature 431:449–452 [DOI] [PubMed] [Google Scholar]
- 29. Snipen L., Almøy T., Ussery D. W. 2009. Microbial comparative pan-genomics using binomial mixture models. BMC Genomics 10:385. [DOI] [PMC free article] [PubMed] [Google Scholar]
- 30. Traister E., Anisfeld S. C. 2006. Variability of indicator bacteria at different time scales in the Upper Hoosic River watershed. Environ. Sci. Technol. 40:4990–4995 [DOI] [PubMed] [Google Scholar]
- 31. U.S. EPA. 2002. Method 1603: Escherichia coli (E. coli) in water by membrane filtration using modified membrane thermotolerant Escherichia coli agar (modified mTEC). Office of Water, U.S. EPA, Washington, DC.
- 32. Whitman R. L., Nevers M. B. 2003. Foreshore sand as a source of Escherichia coli in nearshore water of a Lake Michigan beach. Appl. Environ. Microbiol. 69:5555–5562 [DOI] [PMC free article] [PubMed] [Google Scholar]
- 33. Yamahara K. M., Layton B. A., Santoro A. E., Boehm A. B. 2007. Beach sands along the California coast are diffuse sources of fecal bacteria to coastal waters. Environ. Sci. Technol. 41:4515–4521 [DOI] [PubMed] [Google Scholar]
- 34. Yan T., Sadowsky M. J. 2007. Determining sources of fecal bacteria in waterways. Environ. Monit. Assess. 129:97. [DOI] [PubMed] [Google Scholar]