

Abstract
BACKGROUND
The application of pharmacogenetic results requires demonstrable correlations between a test result and an indicated specific course of action. We developed a computational decision-support tool that combines patient-specific genotype and phenotype information to provide strategic dosage guidance. This tool, through estimating quantitative and temporal parameters associated with the metabolism- and concentration-dependent response to warfarin, provides the necessary patient-specific context for interpreting international normalized ratio (INR) measurements.
METHODS
We analyzed clinical information, plasma S-warfarin concentration, and CYP2C9 (cytochrome P450, family 2, subfamily C, polypeptide 9) and VKORC1 (vitamin K epoxide reductase complex, subunit 1) genotypes for 137 patients with stable INRs. Plasma S-warfarin concentrations were evaluated by VKORC1 genotype (−1639G>A). The steady-state plasma S-warfarin concentration was calculated with CYP2C9 genotype–based clearance rates and compared with actual measurements.
RESULTS
The plasma S-warfarin concentration required to yield the target INR response is significantly (P < 0.05) associated with VKORC1 −1639G>A genotype (GG, 0.68 mg/L; AG, 0.48 mg/L; AA, 0.27 mg/L). Modeling of the plasma S-warfarin concentration according to CYP2C9 genotype predicted 58% of the variation in measured S-warfarin concentration: Measured [S-warfarin] = 0.67(Estimated [S-warfarin]) + 0.16 mg/L.
CONCLUSIONS
The target interval of plasma S-warfarin concentration required to yield a therapeutic INR can be predicted from the VKORC1 genotype (pharmacodynamics), and the progressive changes in S-warfarin concentration after repeated daily dosing can be predicted from the CYP2C9 genotype (pharmacokinetics). Combining the application of multivariate equations for estimating the maintenance dose with genotype-guided pharmacokinetics/pharmacodynamics modeling provides a powerful tool for maximizing the value of CYP2C9 and VKORC1 test results for ongoing application to patient care.
A rapid and accurate computational method for modeling the anticipated response to a drug in a specific patient would provide health care practitioners with a basis for establishing individualized therapeutic strategies. In principle, pharmacogenetics provides a mechanism-based approach for optimizing the selection and dosing of medications for a specific individual (1). As with other diagnostic tests in laboratory medicine, the application of pharmacogenetics results to general health care requires demonstrable correlations between a test result and an indicated specific course of action by a health care professional. The oral anticoagulant warfarin, one of few examples in which a genetic basis for variation in both pharmacokinetic and pharmacodynamic behavior has been identified, serves as an excellent example for proof of principle for this approach.
As of 2004, according to Wysowski et al. (2), nearly 31 million Americans had been prescribed warfarin on an outpatient basis. The correct maintenance dose for an individual cannot be anticipated a priori; it ranges from <1 mg/day to >20 mg/day (median, approximately 5 mg/day). The recommended approach to initiating dosing is to begin with doses between 5 mg and 10 mg for the first 1–2 days, with subsequent dosing based on the response of the international normalized ratio (INR)7 (3). The greatest risk for bleeding events occurs during the initiation phase of therapy (4, 5). Adverse events associated with warfarin therapy are common (6), with incidences of 17.3% among patients 65 years of age and older (7) and 6.2% among the general population (8).
Recent efforts have identified 2 genes, CYP2C98 (cytochrome P450, family 2, subfamily C, polypeptide 9) and VKORC1 (vitamin K epoxide reductase complex, subunit 1), that have been estimated to account for 35%–40% of the variation in the warfarin dose requirement (9-12). The clearance of S-warfarin is diminished in the presence of the CYP2C9*2 and CYP2C9*3 alleles (13-15). With a decreased clearance, standard daily dosing leads to an increase in the S-warfarin concentration and an increase in the time required to reach the steady state. Furthermore, individuals with variant CYP2C9 alleles will require lower maintenance dosages and will demonstrate a delayed transition to a stable response following dosage adjustments. Failure to recognize this delay will lead to misinterpretation of INR measurements (16). The −1639G>A single-nucleotide polymorphism in the VKORC1 gene is correlated with decreased VKORC1 expression (17) and a lower therapeutic interval for the steady-state plasma S-warfarin concentration (12). Consequently, patients with the VKORC1 −1639GG genotype tend to require higher doses than patients with the GA or AA genotype (12). Genetic differences in CYP2C9 and VKORC1 combined with such patient factors as age, body weight, and sex account for 45%–61% of the variation in the daily maintenance dose of warfarin. These factors have been used to derive mathematical equations for estimating the patient’s maintenance dose (12, 18-30). Although the prospective application of such equations has yielded some improvement in patient outcomes in a limited number of studies (18, 31), they have failed to provide clear and ongoing guidance for the use of such information during the various stages of warfarin therapy. To present a dynamic approach for guiding warfarin therapy based on CYP2C9 and VKORC1 genotyping, our group has conceived of a personalized medicine interface tool (PerMIT:warfarin). This tool calculates the estimated maintenance dose, graphically displays the predicted progression of plasma S-warfarin concentrations from the initiation of therapy to the steady state with reference to the VKORC1-estimated target and the steady-state S-warfarin concentration, thereby providing a time-based estimate of the INR response. Our goals were to confirm our previous observation that the relationship between the blood S-warfarin concentration and the response measured by the INR depends on the VKORC1 −1639G>A genotype, to design a dynamic decision-support tool, and to validate the accuracy of this tool through testing of an independent population data set.
Materials and Methods
PATIENTS
The 142 predominantly Caucasian outpatients enrolled in this study were receiving maintenance warfarin therapy and had stable INR values between 2.0 and 3.0. Stable therapy was defined by the care provider and in general involved consistent therapeutic INR measurements without the necessity for a dosage modification over a period of >2 weeks. Five patients were excluded from the analysis. We excluded 3 of these patients because their volume of distribution (VD) for S-warfarin exceeded the 97th percentile of their population and led us to question the accuracy of the data for these patients. The VD for 1 patient was <0.038 L/kg, and the values for the other 2 patients were >0.45 L/kg. We excluded the remaining 2 patients on the basis of their CYP2C9*1/*5 genotype. The remaining 137 patients were used in the final analysis. Patients were followed at the Barnes–Jewish Hospital’s Blood Thinner Clinic in St. Louis, Missouri. The Investigational Review Board of the Washington University School of Medicine approved this protocol. All patients provided written informed consent in accordance with the Declaration of Helsinki.
Age, sex, height, weight, lean body weight (LBW), body surface area (BSA), VD, and warfarin dose were recorded for each patient (Table 1). BSA was calculated with the formula of Dubois and Dubois: BSA = 0.20247 × (height)0.725 × (weight)0.425 (32). The VD of S-warfarin was calculated as follows: VD = warfarin dose × weight−1 × [plasma S-warfarin]−1. LBW was calculated for male and female individuals as follows: LBWmale = (1.10 × weight) − {128 × [weight2/(100 × height)2]}; LBWfemale = (1.07 × weight) − {148 × [weight2/(100 × height)2]} (33).
Table 1.
Demographics of the study population.a
| Sex, n | |
| Male | 80 (58%) |
| Female | 57 (42%) |
| Age, years | 75 (67–80) |
| Weight, kg | 80 (68–94) |
| Height, m | 1.7 (1.6–1.8) |
| LBW, kg | 56 (47–65) |
| BSA, m2 | 1.9 (0.25) |
| Warfarin dose, mg/day | 4.4 (3–6) |
| VD of S-warfarin, L/kg | 0.10 (0.070–0.14) |
Data not normally distributed according to the Kolmogorov–Smirnov test for normality are presented as the median (25th–75th percentiles). BSA data were normally distributed and are presented as the mean (SD).
GENOTYPING
Each sample was genotyped for single-nucleotide polymorphisms in the CYP2C9 (*2, rs1799853; *3, rs1057910; *5; *6; *11) and VKORC1 (−1639G>A, rs9923231) genes as previously described (34).
MEASUREMENT OF PLASMA S-WARFARIN CONCENTRATION
Plasma S-warfarin concentrations were measured by HPLC with ultraviolet detection (35). The interval of assay linearity for both warfarin enantiomers was 0.1–5.0 mg/L, CVs were <15% at 0.5 mg/L and 2.0 mg/L, and the S-warfarin limit of quantification was 0.1 mg/L.
MODELING OF PLASMA S-WARFARIN CONCENTRATION
Plasma S-warfarin concentration was modeled with the following equations (36):
- The initial peak following the first dose,
- The minimum concentration just before the next dose,
- The subsequent maximum concentration after each successive dose,
Cmax initial is the initial peak concentration; Cmax is the peak concentration subsequent to the initial peak; Cmin is the trough concentration; s is the fraction of S-warfarin and is equal to 0.5; f is the bioavailability and is equal to 1; VD is the apparent VD and is set to 0.1 L/kg; kg is the weight in kilograms; λ is the dose interval; and t1/2 is the mean elimination half-life of S-warfarin (set for each CYP2C9 genotype according to results described in multiple published reports: CYP2C9*1/*1, 30 h; CYP2C9*1/*2, 38 h; CYP2C9*1/*3, 51 h; CYP2C9*2/*2, 61 h; CYP2C9*2/*3, 76 h; CYP2C9*3/*3, 203 h). For the CYP2C9*1/*1 genotype, the mean S-warfarin clearance rate is 0.314 L/h, which corresponds to a mean elimination half-life of approximately 30 h. The mean S-warfarin elimination half-lives in patients with CYP2C9 variant alleles were derived from the percent reduction in metabolic clearance for each genotype, as described by Caraco et al. (31) and from supporting evidence of Hamberg et al. (37) and others (13, 14, 23, 38).
STATISTICAL ANALYSIS
Statistical analysis was performed with SigmaStat® 3.5 statistical software (Systat Software). Because the age, weight, height, LBW, warfarin dose, and VD data failed the Kolmogorov–Smirnov test for normality, these data were presented as the median and the interquartile range (25th–75th percentiles). The BSA data passed the Kolmogorov–Smirnov test for normality and were therefore presented as the mean and SD. Because the data for steady-state plasma S-warfarin concentration vs VKORC1 genotype failed the test for normality, we performed Kruskal–Wallis 1-way ANOVA on ranks followed by the Dunn method of adjustment for pairwise multiple comparisons.
Results
Seven different genotypes were detected among the patients evaluated for the CYP2C9 polymorphism; however, the 2 patients with the CYP2C9*1/*5 genotype were not included in the final analysis. Seventy patients were homozygous for the reference allele (*1/*1), and 61 patients carried only 1 of the variant alleles (n = 44 for *1/*2; n = 17 for *1/*3). Five patients were homozygous for variant alleles (n = 4 for *2/*2; n = 1 for *3/*3). One patient was compound heterozygous (*2/*3). Patients also were genotyped for the VKORC1 G>A polymorphism at position −1639. Fifty-five patients were homozygous for the reference allele (GG, 40%), 66 patients were heterozygous for the variant (AG, 48%), and 16 patients were homozygous for the variant (AA, 12%).
RELATIONSHIP BETWEEN VKORC1 −1639 GENOTYPE AND PLASMA S-WARFARIN CONCENTRATION
The median plasma S-warfarin concentration was 0.68 mg/L (interquartile range, 0.56–0.89) for the GG genotype, 0.48 mg/L (interquartile range, 0.39–0.62) for the AG genotype, and 0.27 mg/L (interquartile range, 0.15–0.42) for the AA genotype (Fig. 1). A Kruskal–Wallis 1-way ANOVA on ranks revealed statistically significant differences (P < 0.001) between all of the VKORC1 −1639 genotypes with respect to plasma S-warfarin concentration. As expected, individuals with the VKORC1 −1639GG genotype required a significantly higher daily maintenance S-warfarin dose (5.2 mg/day) than the AG genotype (4.1 mg/day) and the AA genotype (2.4 mg/day). There were no statistically significant differences (P = 0.057) among the VKORC1 −1639 genotypes with respect to S-warfarin clearance (data not shown).
Fig. 1. Therapeutic plasma S-warfarin concentration according to VKORC1 −1639G>A genotype.
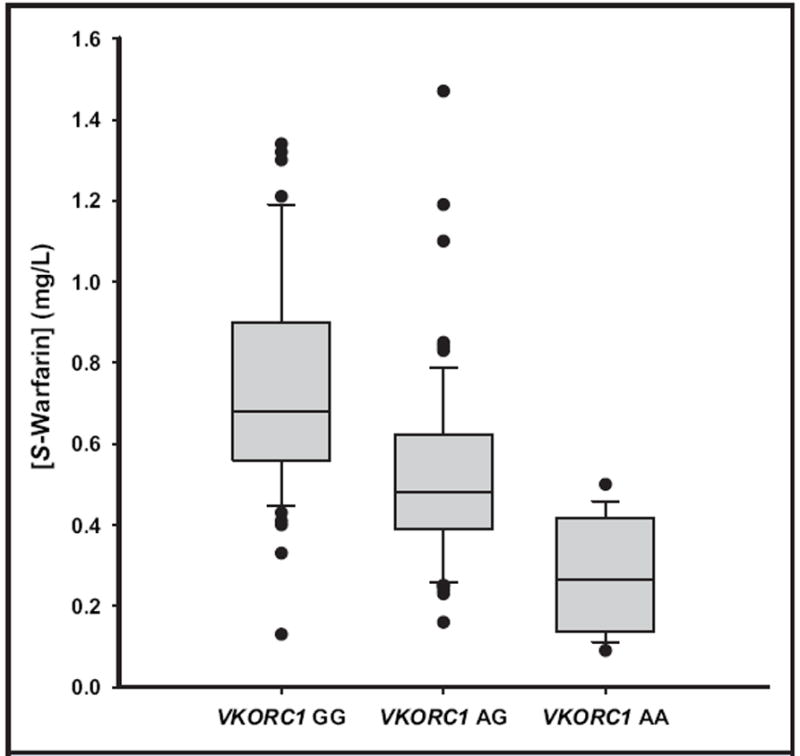
Outliers are marked by closed circles. The boundary of the box closer to zero indicates the 25th percentile, the line within the box marks the median, and the boundary of the box farther from zero indicates the 75th percentile. Whiskers above and below the box indicate the 90th and 10th percentiles. Kruskal–Wallis 1-way ANOVAs on ranks revealed statistically significant differences in mean plasma S-warfarin concentrations between all VKORC1 −1639 genotypes (P < 0.001).
ESTIMATING THE WARFARIN MAINTENANCE DOSE
We previously used multiple regression analysis to develop an equation for estimating the mean daily warfarin maintenance dose on the basis of VKORC1 −1639 and CYP2C9 genotypes, age, sex, and body weight that accounted for up to 61% of the variance in warfarin maintenance dose (12, 39). We calculated the daily warfarin maintenance doses for each patient in this cohort and compared them with actual recorded mean daily maintenance doses. Linear regression analysis of the correlation between the estimated and actual recorded mean daily maintenance doses produced a slope of 0.72 [standard error of the estimate (Sy∣x), 0.053; P < 0.0001], and a y intercept of 1.4 mg/day (Sy∣x, 0.053 mg/day; P < 0.0001). The actual warfarin maintenance dose was positively correlated with the estimated warfarin maintenance dose (r = 0.76; Fig. 2). Fifty-eight percent of the variance in the actual daily dose was explained by the variance displayed in the estimated mean daily dose (i.e., r2 = 0.58).
Fig. 2. Correlation between actual warfarin dosing and predicted dosing.
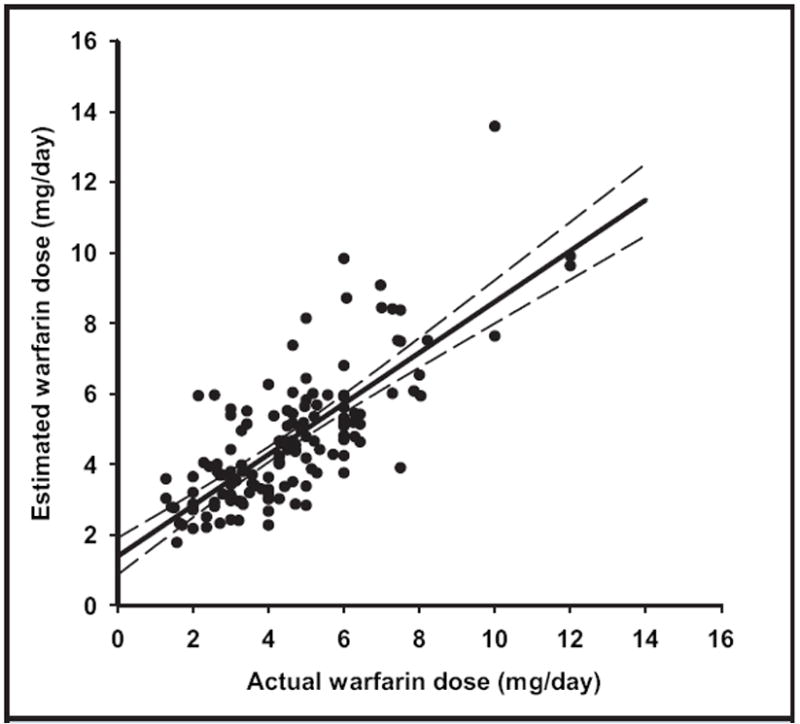
The actual daily maintenance dose was plotted against the estimated maintenance dose for 137 patients [Zhu et al. (12)]. Indicated are data (closed circles), the regression line (solid line), and the 95% prediction interval (dashed lines). Estimated S-warfarin dose = 0.72(Actual warfarin dose) + 0.14 mg/day; r2 = 0.58.
COMPARISON OF THE ESTIMATED AND MEASURED PLASMA S-WARFARIN CONCENTRATIONS
We next assessed the reliability of modeling the plasma S-warfarin concentration based on S-warfarin elimination adjusted for the CYP2C9 genotype (13-15, 23). The estimated plasma S-warfarin concentration was analyzed by its correlation with the measured plasma S-warfarin concentration at the time of a therapeutic INR. Ordinary linear regression analysis produced a slope of 0.67 (Sy∣x, 0.059; P < 0.0001) and a y intercept of 0.16 mg/L (Sy∣x, 0.038 mg/L; P < 0.0001), with an r2 value of 0.58 (Fig. 3). The mean absolute difference between estimated and measured concentrations is 0.14 mg/L, and 58% of the estimated values are within 25% of the measured values.
Fig. 3. Comparison of measured and estimated plasma S-warfarin concentrations.
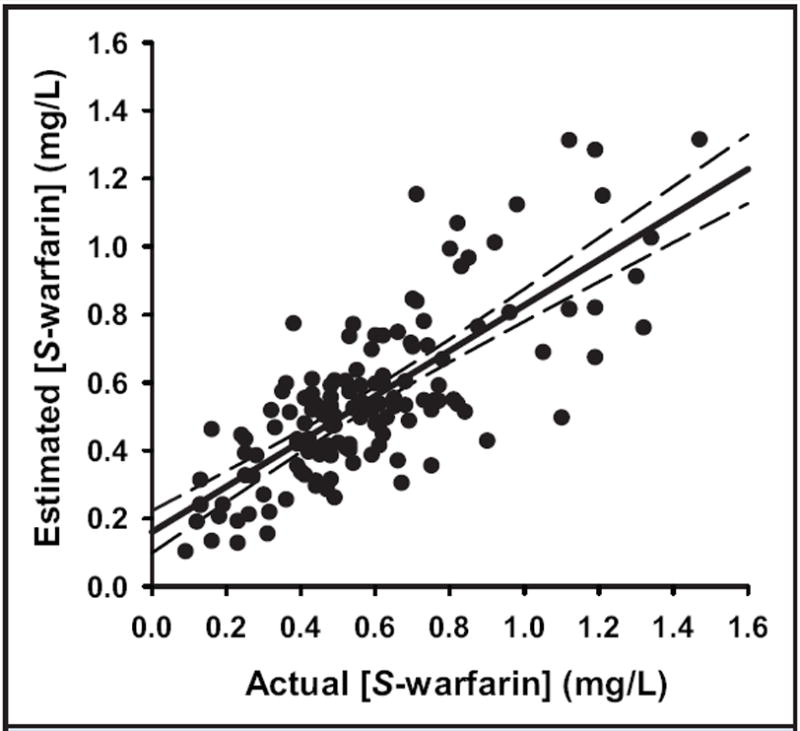
The measured plasma S-warfarin concentration was plotted against the estimated concentration for 137 patients. The estimated concentration, calculated as described in Materials and Methods, is that occurring after 20 continuous days of dosing at the mean daily maintenance dose recorded for each patient. Indicated are the data (closed circles), the regression line (solid line), and the 95% CI (dashed lines). Estimated [S-warfarin] = 0.67 (Actual [S-warfarin]) + 0.16 mg/L; r2 = 0.58.
CASE STUDIES
We have modeled the predicted S-warfarin concentration–time profile with respect to the warfarin daily-dosing history and INR response of a 40-year-old African American woman with the CYP2C9*1/*3 and VKORC1 −1639AG genotype, which were published in a case report by LaSala et al. (40). Fig. 4A illustrates the history of the measured INR response along with the plasma concentrations of S-warfarin estimated with our PerMIT model incorporating the S-warfarin t1/2 associated with CYP2C9*1/*3. On the basis of this individual’s clinical and genetic characteristics, we estimated the mean daily maintenance dose to be 3.5 mg/day. This patient’s therapeutic target S-warfarin concentration estimated from her VKORC1 −1639AG genotype is 0.48 mg/L (interquartile range, 0.39–0.62 mg/L) (Fig. 2). The reported dosing history for this patient is presented in Table 2. The predicted target concentration range for this patient is exceeded within the first two 5-mg doses, whereas overdosing of this patient is not revealed by INR monitoring until an INR of 3.3 is obtained on day 8. Note that the INR measurement made on day 8 is before the estimated time to reach the steady state, and although this measurement is slightly above the target INR interval (2.0–3.0), it underestimates the degree of overdosing, which is not fully reflected until the INR measurement of 5.3 is made on day 20. Of interest is that although the dose had been decreased 5 days earlier, the INR obtained on day 20 has continued to increase from 4.9. The INR thus serves as a poor indicator with respect to the eventual impact of the preceding dosage change because this measurement again was made before a steady-state S-warfarin concentration was achieved at the adjusted dosage. This illustration demonstrates the value of interpreting INR measurements in light of the temporal status of the plasma S-warfarin concentration and demonstrates the delay in INR response relative to changing plasma S-warfarin concentrations. This example illustrates the difficulties in managing patients that can occur when the pharmacokinetic and pharmacodynamic characteristics of the patient are unknown.
Fig. 4. Graphical representation of the output for the clinical decision–support tool.
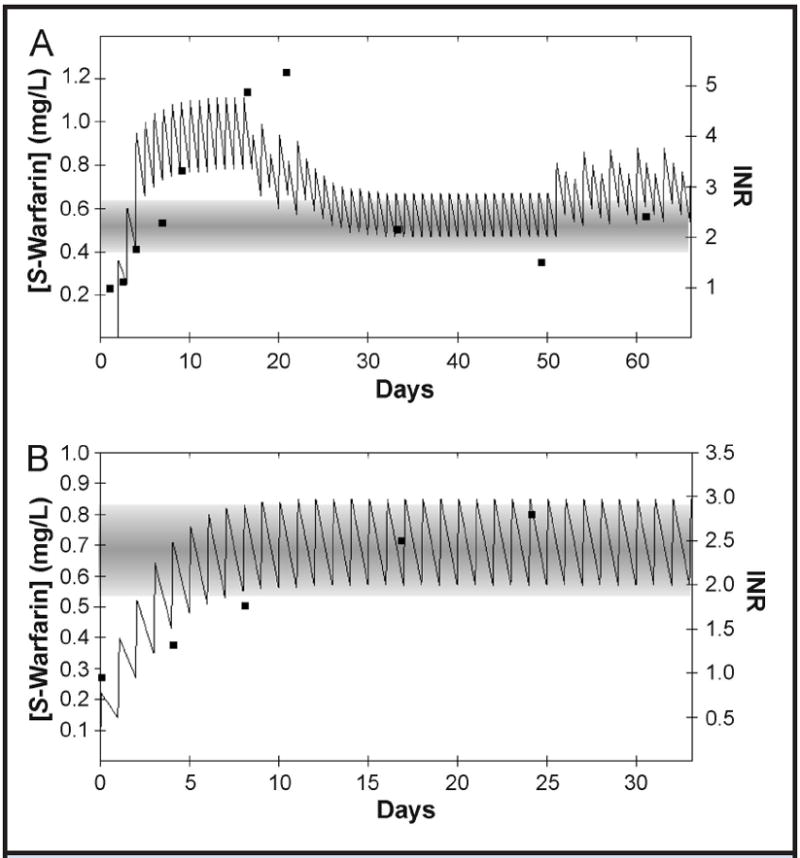
(A), Model of a patient’s course of S-warfarin therapy as described by LaSala et al. (40). (B), Model of a patient’s course of therapy as managed by one of the authors (B.F. Gage). In each panel, the closed squares represent the patient’s measured INR values (right y axis). The plotted solid line represents the estimated plasma S-warfarin concentration (left y axis), which is based on the patient’s warfarin dosage and CYP2C9 genotype and calculated with our clinical decision–support model. The horizontal shaded band represents the target therapeutic interval of S-warfarin concentration according to the individual’s VKORC1 genotype.
Table 2.
Actual dosing schedules described in case reports.
| Dosing | |
|---|---|
| Case 1. Guided by INR monitoring only (Fig. 4A) | |
| Day 1 | 0 mg |
| Day 2 | 5 mg |
| Day 3 | 7.5 mg |
| Days 4–9 | 5 mg |
| Days 10–16 | 5 mg |
| Days 17–22 | Alternating: 5 and 2.5 mg |
| Days 23–48 | 3 mg |
| Days 49–90 | Alternating: 3, 3, and 5 mg |
| Case 2. Guided by INR monitoring and genotype (Fig. 4B) | |
| Day 1 | 5 mg |
| Days 2–3 | 6 mg |
| Days 4–8 | 7 mg |
| Days 9–22 | 7 mg |
In contrast, the case illustrated in Fig. 4B demonstrates the prospective application of this approach to avoid overcompensation in dosing. A 55-year-old in-patient was referred to our anticoagulation clinic for genotyping and warfarin management after he had experienced a pulmonary embolism. The patient was 180 cm (71 in) tall and weighed 118 kg. Before genotyping, he had received 4 warfarin doses (5, 6, 6, and 7 mg), and his INR was 1.39 early the next morning. The patient’s genotype was CYP2C9*1/*2 and VKORC1 −1639GG. We anticipated the pharmacokinetic delay in reaching the steady state from the CYP2C9*1*2 genotype and the pharmacodynamic resistance from the VKORC1 −1639GG genotype. After receiving five 7-mg doses (8 doses total), the patient presented to our clinic with an INR of 1.7. From a clinical point of view, we would have increased his warfarin dose, but because we knew that his warfarin concentrations were still rising (Fig. 4B), we continued dosing at 7 mg/day. We checked the INR after 6 more doses, and it was 2.0. We continued S-warfarin administration at 7 mg/day, and his INR was 2.5 after 8 additional doses. His subsequent mean INR values (still at 7 mg/day) were 2.83. Thus, our understanding of this patient’s status allowed us to avoid unnecessarily increasing the dose and thereby avoided further readjustment. This scenario illustrates one of many potential scenarios in which both the dosing and the monitoring practice can be strategically guided by placing the dosing and response information into the appropriate temporal context for the individual patient.
Discussion
Our overall aim was to validate the mathematical models chosen to support our clinical decision–support tool. We developed the model at one institution (University of Louisville) and validated it with data from another (Washington University School of Medicine). The critical characteristics evaluated were the relationship between the VKORC1 −1639G>A genotype and the plasma S-warfarin concentration under stable therapeutic conditions, estimation of the maintenance dose in an independent data set, and pharmacokinetic modeling of the plasma concentration of S-warfarin based on adjustments for the CYP2C9 genotype.
In an earlier report (12), we described a trend for increased plasma S-warfarin concentrations with the number of VKORC1 −1639G alleles; however, until the present study we lacked sufficient numbers of patients to demonstrate a statistically significant difference between each of the 3 VKORC1 genotypes. In the current study, we have confirmed our original observation (12) and have demonstrated significant different median plasma S-warfarin concentrations for each of the VKORC1 genotypes. The data obtained from each cohort yielded similar measures of the therapeutic plasma S-warfarin concentration for each of the 3 genotypes: VKORC1 −1639GG [mean (SD) of original study, 0.73 mg/L (0.33 mg/L); median (interquartile range) of current study, 0.68 mg/L (0.56–0.89 mg/L)], VKORC1 −1639AG [original, 0.54 mg/L (0.21 mg/L); current, 0.48 mg/L (0.39–0.62 mg/L)], and VKORC1 −1639AA [original, 0.48 mg/L (0.04 mg/L); current, 0.27 mg/L (0.15–0.42 mg/L)]. The observed consistency is important because it provides mechanistic evidence for the effect of this polymorphism on warfarin requirements. Furthermore, these data begin to describe a “therapeutic” interval for plasma concentrations of S-warfarin for patients whose VKORC1 −1639G>A genotype is known and whose target INR is between 2.0 and 3.0.
Also described in our earlier report (12) is the development of an equation for estimating the warfarin maintenance dose from clinical and genetic factors, which was subsequently validated (39). In this independent data set, this equation accounted for 58% of the variation in warfarin maintenance dose while demonstrating a minimal negative proportional bias (slope, 0.72) and a positive constant bias of 0.14 mg/L. This equation has subsequently been modified and introduced into PerMIT to include correction factors for both smoking and alternative target INR intervals. These changes do not alter the dosage estimates for the 2 cases described above because both patients were treated with a target INR of 2.5 and because neither patient was reported to use nicotine.
An important aspect of this tool is the ability to model the anticipated plasma S-warfarin concentrations after repeated dosing. To accomplish this functionality, we used traditional single-compartment, multiple-dose pharmacokinetic equations (36) driven by published values of S-warfarin clearance and elimination half-lives for each CYP2C9 genotype (31, 38). We evaluated the accuracy of this tool by comparing the calculated plasma concentration of S-warfarin to the measured S-warfarin concentration for each individual. We found the accuracy of plasma S-warfarin estimates to be comparable to the accuracy of maintenance dose estimation (r2 = 0.58). The importance of this observation is that these data support the utility of published measures of S-warfarin elimination t1/2 values for the respective CYP2C9 genotypes for incorporation into a linear pharmacokinetic model. Such models are well-established techniques for describing the sequential peak and trough concentrations of drugs caused by multiple dosing. Therefore, we can be fairly confident that the resulting drug-concentration profile generated by our tool is a reasonable approximation of the actual S-warfarin blood concentrations in each of our patients.
This data set has several limitations that should be mentioned. The validation data set is predominantly from a Caucasian population, and thus its accuracy for use with other ethnic groups cannot be assumed beyond previously demonstrated similarities or differences. Patients who took alternating doses of warfarin would have introduced random error into the measurement of the therapeutic plasma concentrations of S-warfarin, and data regarding the number of hours between the last warfarin dose and measurement of warfarin concentration were not available.
These data serve to demonstrate the feasibility of accurately modeling values of the plasma S-warfarin concentration after multiple dosing. The importance of this characteristic to a clinical decision–support tool is the mapping of the temporal changes in concentration as dosing progresses toward the steady state. This function serves the purpose of guiding both the dosing and monitoring processes and has the additional value of guiding strategies during periods in which dosing may be either accidentally or purposely suspended.
This tool is not intended to replace INR monitoring or the professional judgment of experienced clinicians, but it is intended to create an interactive framework in which the influence of genetic variation can be managed in a proactive and ongoing fashion beyond providing an estimate of a maintenance dose at a single point in time. We have demonstrated that the configuration of this tool provides an estimate of the individual’s mean daily maintenance dose, in addition to estimates of the plasma S-warfarin concentrations obtained from the actual dosing history of the patient. Finally, we have reproduced and strengthened our original finding that the steady-state S-warfarin concentration in plasma required to elicit a therapeutic INR (range, 2.0–3.0), may be estimated from knowledge of the VKORC1 −1639G>A genotype.
Acknowledgments
The authors thank Michael Brier for his valuable input regarding interpretation of the pharmacokinetic data.
Employment or Leadership: K.K. Reynolds, Vice President, Laboratory Operations, PGxl Laboratories; R. Valdes, Jr., President, PGxl Laboratories.
Consultant or Advisory Role: M.W. Linder, PGxl Laboratories; R. Valdes, Jr., PGxl Laboratories.
Stock Ownership: M.W. Linder, PGxl Laboratories; R. Valdes, Jr., PGxl Laboratories. Both M.W. Linder and R. Valdes, Jr. hold equity interest in PGxl Laboratories.
Honoraria: None declared.
Research Funding: NIH grants K23 AA014232, R44 HL090055, and R01 HL074724. B.F. Gage, Osmetech; C. Eby, Osmetech.
Expert Testimony: C. Eby, patent dispute involving Barr Pharmaceuticals.
Other: The University of Louisville has applied for patents based on the approach reported here for broad clinical applications of pharmacogenetic diagnostics (filing no. 60/798,855; May 9, 2006) (M.W. Linder and R. Valdes, Jr., inventors). An exclusive option to license this technology has been granted to PGxl Laboratories, LLC, Louisville, KY (http://www.permitwarfarin.com).
Role of Sponsor: The funding organizations played no role in the design of study, choice of enrolled patients, review and interpretation of data, or preparation or approval of manuscript.
Footnotes
Author Contributions: All authors confirmed they have contributed to the intellectual content of this paper and have met the following 3 requirements: (a) significant contributions to the conception and design, acquisition of data, or analysis and interpretation of data; (b) drafting or revising the article for intellectual content; and (c) final approval of the published article.
Nonstandard abbreviations: INR, international normalized ratio; VD, volume of distribution; LBW, lean body weight; BSA, body surface area; Sy∣x standard error of the estimate.
Human genes: CYP2C9, cytochrome P450, family 2, subfamily C, polypeptide 9; VKORC1, vitamin K epoxide reductase complex, subunit 1.
Authors’ Disclosures of Potential Conflicts of Interest: Upon manuscript submission, all authors completed the Disclosures of Potential Conflict of Interest form. Potential conflicts of interest:
References
- 1.Linder MW, Prough RA, Valdes R., Jr Pharmacogenetics: a laboratory tool for optimizing therapeutic efficiency. Clin Chem. 1997;43:254–66. [PubMed] [Google Scholar]
- 2.Wysowski DK, Nourjah P, Swartz L. Bleeding complications with warfarin use: a prevalent adverse effect resulting in regulatory action. Arch Intern Med. 2007;167:1414–9. doi: 10.1001/archinte.167.13.1414. [DOI] [PubMed] [Google Scholar]
- 3.Ansell J, Hirsh J, Hylek E, Jacobson A, Crowther M, Palareti G. Pharmacology and management of the vitamin K antagonists: American College of Chest Physicians Evidence-Based Clinical Practice Guidelines (8th Edition) Chest. 2008;133:160S–98S. doi: 10.1378/chest.08-0670. [DOI] [PubMed] [Google Scholar]
- 4.Landefeld CS, Beyth RJ. Anticoagulant-related bleeding: clinical epidemiology, prediction, and prevention. Am J Med. 1993;95:315–28. doi: 10.1016/0002-9343(93)90285-w. [DOI] [PubMed] [Google Scholar]
- 5.Landefeld CS, Goldman L. Major bleeding in out-patients treated with warfarin: incidence and prediction by factors known at the start of outpatient therapy. Am J Med. 1989;87:144–52. doi: 10.1016/s0002-9343(89)80689-8. [DOI] [PubMed] [Google Scholar]
- 6.Merli GJ, Tzanis G. Warfarin: What are the clinical implications of an out-of-range-therapeutic international normalized ratio? J Thromb Thrombolysis. 2008;27:293–9. doi: 10.1007/s11239-008-0219-9. [DOI] [PubMed] [Google Scholar]
- 7.Budnitz DS, Shehab N, Kegler SR, Richards CL. Medication use leading to emergency department visits for adverse drug events in older adults. Ann Intern Med. 2007;147:755–65. doi: 10.7326/0003-4819-147-11-200712040-00006. [DOI] [PubMed] [Google Scholar]
- 8.Budnitz DS, Pollock DA, Weidenbach KN, Mendelsohn AB, Schroeder TJ, Annest JL. National surveillance of emergency department visits for outpatient adverse drug events. JAMA. 2006;296:1858–66. doi: 10.1001/jama.296.15.1858. [DOI] [PubMed] [Google Scholar]
- 9.D’Andrea G, D’Ambrosio RL, Di Perna P, Chetta M, Santacroce R, Brancaccio V, et al. A polymorphism in the VKORC1 gene is associated with an interindividual variability in the dose-anticoagulant effect of warfarin. Blood. 2005;105:645–9. doi: 10.1182/blood-2004-06-2111. [DOI] [PubMed] [Google Scholar]
- 10.Sanoski CA, Bauman JL. Clinical observations with the amiodarone/warfarin interaction: dosing relationships with long-term therapy. Chest. 2002;121:19–23. doi: 10.1378/chest.121.1.19. [DOI] [PubMed] [Google Scholar]
- 11.Wadelius M, Chen LY, Downes K, Ghori J, Hunt S, Eriksson N, et al. Common VKORC1 and GGCX polymorphisms associated with warfarin dose. Pharmacogenomics J. 2005;5:262–70. doi: 10.1038/sj.tpj.6500313. [DOI] [PubMed] [Google Scholar]
- 12.Zhu Y, Shennan M, Reynolds KK, Johnson NA, Herrnberger MR, Valdes R, Jr, Linder MW. Estimation of warfarin maintenance dose based on VKORC1 (−1639 G>A) and CYP2C9 genotypes. Clin Chem. 2007;53:1199–205. doi: 10.1373/clinchem.2006.078139. [DOI] [PubMed] [Google Scholar]
- 13.Linder MW, Looney S, Adams JE, 3rd, Johnson N, Antonino-Green D, Lacefield N, et al. Warfarin dose adjustments based on CYP2C9 genetic polymorphisms. J Thromb Thrombolysis. 2002;14:227–32. doi: 10.1023/a:1025052827305. [DOI] [PubMed] [Google Scholar]
- 14.Scordo MG, Pengo V, Spina E, Dahl ML, Gusella M, Padrini R. Influence of CYP2C9 and CYP2C19 genetic polymorphisms on warfarin maintenance dose and metabolic clearance. Clin Pharmacol Ther. 2002;72:702–10. doi: 10.1067/mcp.2002.129321. [DOI] [PubMed] [Google Scholar]
- 15.Takahashi H, Echizen H. Pharmacogenetics of warfarin elimination and its clinical implications. Clin Pharmacokinet. 2001;40:587–603. doi: 10.2165/00003088-200140080-00003. [DOI] [PubMed] [Google Scholar]
- 16.Reynolds KK, Valdes R, Jr, Hartung BR, Linder MW. Individualizing warfarin therapy. Per Med. 2007;4:11–31. doi: 10.2217/17410541.4.1.11. [DOI] [PubMed] [Google Scholar]
- 17.Yuan HY, Chen JJ, Lee MT, Wung JC, Chen YF, Charng MJ, et al. A novel functional VKORC1 promoter polymorphism is associated with inter-individual and inter-ethnic differences in warfarin sensitivity. Hum Mol Genet. 2005;14:1745–51. doi: 10.1093/hmg/ddi180. [DOI] [PubMed] [Google Scholar]
- 18.Anderson JL, Horne BD, Stevens SM, Grove AS, Barton S, Nicholas ZP, et al. Randomized trial of genotype-guided versus standard warfarin dosing in patients initiating oral anticoagulation. Circulation. 2007;116:2563–70. doi: 10.1161/CIRCULATIONAHA.107.737312. [DOI] [PubMed] [Google Scholar]
- 19.Caldwell MD, Berg RL, Zhang KQ, Glurich I, Schmelzer JR, Yale SH, et al. Evaluation of genetic factors for warfarin dose prediction. Clin Med Res. 2007;5:8–16. doi: 10.3121/cmr.2007.724. [DOI] [PMC free article] [PubMed] [Google Scholar]
- 20.Carlquist JF, Horne BD, Muhlestein JB, Lappe DL, Whiting BM, Kolek MJ, et al. Genotypes of the cytochrome P450 isoform, CYP2C9, and the vitamin K epoxide reductase complex subunit 1 conjointly determine stable warfarin dose: a prospective study. J Thromb Thrombolysis. 2006;22:191–7. doi: 10.1007/s11239-006-9030-7. [DOI] [PubMed] [Google Scholar]
- 21.Gage BF, Eby C, Johnson JA, Deych E, Rieder MJ, Ridker PM, et al. Use of pharmacogenetic and clinical factors to predict the therapeutic dose of warfarin. Clin Pharmacol Ther. 2008;84:326–31. doi: 10.1038/clpt.2008.10. [DOI] [PMC free article] [PubMed] [Google Scholar]
- 22.Gage BF, Eby C, Milligan PE, Banet GA, Duncan JR, McLeod HL. Use of pharmacogenetics and clinical factors to predict the maintenance dose of warfarin. Thromb Haemost. 2004;91:87–94. doi: 10.1160/TH03-06-0379. [DOI] [PubMed] [Google Scholar]
- 23.Herman D, Locatelli I, Grabnar I, Peternel P, Stegnar M, Mrhar A, et al. Influence of CYP2C9 polymorphisms, demographic factors and concomitant drug therapy on warfarin metabolism and maintenance dose. Pharmacogenomics J. 2005;5:193–202. doi: 10.1038/sj.tpj.6500308. [DOI] [PubMed] [Google Scholar]
- 24.Kimura R, Miyashita K, Kokubo Y, Akaiwa Y, Otsubo R, Nagatsuka K, et al. Genotypes of vitamin K epoxide reductase, gamma-glutamyl carboxylase, and cytochrome P450 2C9 as determinants of daily warfarin dose in Japanese patients. Thromb Res. 2007;120:181–6. doi: 10.1016/j.thromres.2006.09.007. [DOI] [PubMed] [Google Scholar]
- 25.Miao L, Yang J, Huang C, Shen Z. Contribution of age, body weight, and CYP2C9 and VKORC1 genotype to the anticoagulant response to warfarin: proposal for a new dosing regimen in Chinese patients. Eur J Clin Pharmacol. 2007;63:1135–41. doi: 10.1007/s00228-007-0381-6. [DOI] [PubMed] [Google Scholar]
- 26.Sconce EA, Khan TI, Wynne HA, Avery P, Monkhouse L, King BP, et al. The impact of CYP2C9 and VKORC1 genetic polymorphism and patient characteristics upon warfarin dose requirements: proposal for a new dosing regimen. Blood. 2005;106:2329–33. doi: 10.1182/blood-2005-03-1108. [DOI] [PubMed] [Google Scholar]
- 27.Tham LS, Goh BC, Nafziger A, Guo JY, Wang LZ, Soong R, Lee SC. A warfarin-dosing model in Asians that uses single-nucleotide polymorphisms in vitamin K epoxide reductase complex and cytochrome P450 2C9. Clin Pharmacol Ther. 2006;80:346–55. doi: 10.1016/j.clpt.2006.06.009. [DOI] [PubMed] [Google Scholar]
- 28.Voora D, Eby C, Linder MW, Milligan PE, Bukaveckas BL, McLeod HL, et al. Prospective dosing of warfarin based on cytochrome P-450 2C9 genotype. Thromb Haemost. 2005;93:700–5. doi: 10.1160/TH04-08-0542. [DOI] [PubMed] [Google Scholar]
- 29.Wadelius M, Chen LY, Eriksson N, Bumpstead S, Ghori J, Wadelius C, et al. Association of warfarin dose with genes involved in its action and metabolism. Hum Genet. 2007;121:23–34. doi: 10.1007/s00439-006-0260-8. [DOI] [PMC free article] [PubMed] [Google Scholar]
- 30.Wen MS, Lee M, Chen JJ, Chuang HP, Lu LS, Chen CH, et al. Prospective study of warfarin dosage requirements based on CYP2C9 and VKORC1 genotypes. Clin Pharmacol Ther. 2008;84:83–9. doi: 10.1038/sj.clpt.6100453. [DOI] [PubMed] [Google Scholar]
- 31.Caraco Y, Blotnick S, Muszkat M. CYP2C9 genotype-guided warfarin prescribing enhances the efficacy and safety of anticoagulation: a prospective randomized controlled study. Clin Pharmacol Ther. 2008;83:460–70. doi: 10.1038/sj.clpt.6100316. [DOI] [PubMed] [Google Scholar]
- 32.DuBois D, Dubois EF. A formula to estimate the approximate surface area if height and weight be known. Arch Intern Med. 1916;17:863–71. [Google Scholar]
- 33.James WPT, editor. DHSS/MRC Group on Obesity Research. Research on obesity: a report of the DHSS/MRC group. London: H.M.S.O; 1976. p. 94. compiler. [Google Scholar]
- 34.Millican EA, Lenzini PA, Milligan PE, Grosso L, Eby C, Deych E, et al. Genetic-based dosing in orthopedic patients beginning warfarin therapy. Blood. 2007;110:1511–5. doi: 10.1182/blood-2007-01-069609. [DOI] [PMC free article] [PubMed] [Google Scholar]
- 35.Henne KR, Gaedigk A, Gupta G, Leeder JS, Rettie AE. Chiral phase analysis of warfarin enantiomers in patient plasma in relation to CYP2C9 genotype. J Chromatogr B Biomed Sci Appl. 1998;710:143–8. doi: 10.1016/s0378-4347(98)00099-1. [DOI] [PubMed] [Google Scholar]
- 36.Schumacher GE. Therapeutic drug monitoring. Norwalk, CT: Appleton & Lange; 1995. pp. xii–684. [Google Scholar]
- 37.Hamberg AK, Dahl ML, Barban M, Scordo MG, Wadelius M, Pengo V, et al. A PK-PD model for predicting the impact of age, CYP2C9, and VKORC1 genotype on individualization of warfarin therapy. Clin Pharmacol Ther. 2007;81:529–38. doi: 10.1038/sj.clpt.6100084. [DOI] [PubMed] [Google Scholar]
- 38.Takahashi H, Kashima T, Nomoto S, Iwade K, Tainaka H, Shimizu T, et al. Comparisons between in-vitro and in-vivo metabolism of (S)-warfarin: catalytic activities of cDNA-expressed CYP2C9, its Leu359 variant and their mixture versus unbound clearance in patients with the corresponding CYP2C9 genotypes. Pharmacogenetics. 1998;8:365–73. doi: 10.1097/00008571-199810000-00001. [DOI] [PubMed] [Google Scholar]
- 39.Wu AH, Wang P, Smith A, Haller C, Drake K, Linder M, Valdes R., Jr Dosing algorithm for warfarin using CYP2C9 and VKORC1 genotyping from a multi-ethnic population: comparison with other equations. Pharmacogenomics. 2008;9:169–78. doi: 10.2217/14622416.9.2.169. [DOI] [PubMed] [Google Scholar]
- 40.LaSala A, Bower B, Windemuth A, White CM, Kocherla M, Seip R, et al. Integrating genomic based information into clinical warfarin (Coumadin) management: an illustrative case report. Conn Med. 2008;72:399–403. [PMC free article] [PubMed] [Google Scholar]