Abstract
Background
Understanding change in health and illness over time is central to creating and evaluating interventions for individuals, families, and populations. The term health trajectory is a succinct and useful way to describe change in health status over time.
Objectives
To define the notion of a health trajectory; comment on the usefulness and current status of health trajectory research for nursing science and practice; and identify and illustrate key elements of theory, design, and statistical models for health trajectory research.
Approach
Constructs in theory about individual change are summarized, synthesized with characteristics of longitudinal design and statistical models for change, and discussed in light of current and emerging health care priorities and trends in nursing research.
Recommendations
Health trajectory research is person-focused and congruent with the person-centered emphasis of nursing practice. The contribution of nursing science to the overall effort to improve health will be enhanced when change over time is explicit in nursing theory, longitudinal designs are used, and contemporary statistical approaches for modeling change in health status are incorporated into research plans.
Keywords: health trajectory, applied longitudinal data analysis, nursing theory, change
The pattern of health over time is called a health trajectory. As suggested in the conceptual framework for the Minnesota Center for Health Trajectory Research (Wyman & Henly, 2011), health over time results from multiple factors operating in nested genetic, biological, behavioral, social, cultural, environmental, political, and economic contexts that change as a person develops. Understanding the course and causes of change in health over time allows anticipation of those at greatest risk for adverse trajectories and events, enhances understanding of factors that influence change in health over time, and permits examination of the effects of interventions on the trajectory, including identification of for whom and at what point in the trajectory interventions are most effective. Thus, knowledge about the course and causes of change in health status over time creates the possibility for control by influencing the trajectory itself. Self-care and the actions of health professionals, including nurses, can be directed at all levels of the nested system to impact health over time as a positive resource for life (WHO, 1986).
Explaining variation in health behaviors and illness responses and evaluating the effectiveness of existing and novel health interventions at individual, family, group and population levels are at the core of nursing research. Time and context are essential factors but rarely have been considered explicitly in theory, design, or statistical models used in nursing science.
Since publication of Laird and Ware’s (1982) seminal paper on use of random-effects models for longitudinal data, advances in statistical modeling and computing (Muthén & Muthén, 2000; Raudenbush & Bryk, 2002) have opened new vistas for designing longitudinal studies, modeling data obtained from them, and interpreting results about change. With a valid health indicator whose values change systematically over time, a sensible metric for marking time, and three or more waves of data (Singer & Willett, 2003, p. 9), these statistical models can be used to describe health course and identify the naturally covariant and deliberate intervention factors that influence personal trajectories (Raudenbush, 2005). As a result, development of a person-focused nursing science congruent with the person-centered heart of nursing practice is now possible (Henly, 2007).
The purposes of this paper are to: (a) define the notion of a health trajectory; (b) comment on the usefulness and current status of health trajectory research for nursing science and practice; and (c) identify and illustrate key elements of theory, design, and statistical models for health trajectory research. The paper provides background for the primary reports that appear in this supplement and serves as a resource for the community of scientists as they advance nursing research by incorporating a health trajectory perspective.
What is a Health Trajectory?
Definition
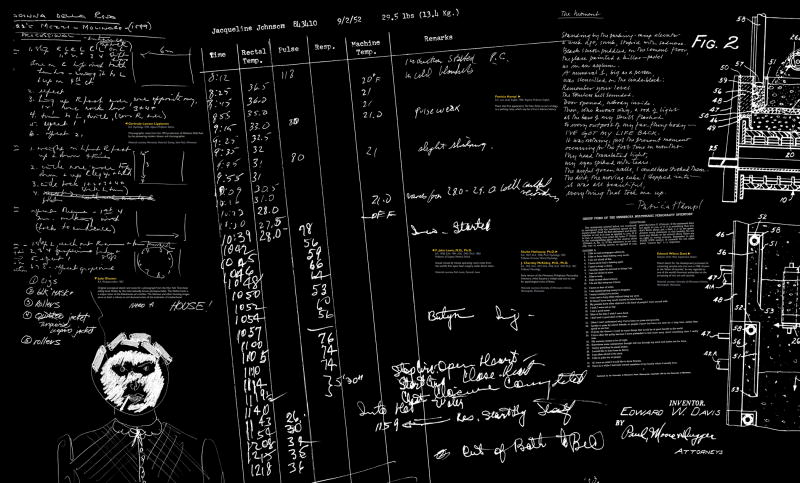
As the pattern of health over time, the notion of a health trajectory reflects common use of the term trajectory as the flight path of an object, including the forces that act on it to link location with time. Trajectories are characterized by an initial point (value at some time defined as 0) and form (shape defined by a mathematical function), rate of change (speed), and change in rate (acceleration). Taken together, a theoretically justified health trajectory that fits the data in a statistical sense provides information about health status at any specified time, including an endpoint of interest. A health trajectory describes the dynamic (changing) course of health and illness. A health trajectory shows the values of an indicator of health status expressed as a function of time. As examples, the trajectory of rectal temperature for the first patient to undergo open heart surgery under direct visualization is shown in Figure 1 (Bolman & Black, 2003) and trajectories of pain at bedtime over the first postoperative week in a sample of 30 surgical patients who had same-day procedures at a Veterans Administration Medical Center are shown in Figure 2 (Busch, 2002).
Figure 1.
The trajectory of rectal temperature during cooling for the world’s first open heart surgery under direct visualization, completed at the University of Minnesota in 1952, as celebrated on the Wall of Discovery on the campus Scholars Walk. The simple method of hypothermia was used to stop the heart and maintain a bloodless, motionless field long enough for the surgeon to complete the operation. The expected overall trajectory was curvilinear: from a normal value at outset, temperature was decreased with refrigerated blankets and maintained at 28° C (82.4° F) throughout the procedure, after which re-warming in a water bath continued until temperature reached 36° C (96.8° F). (Photo courtesy of LA ink. Used with permission).
Figure 2.
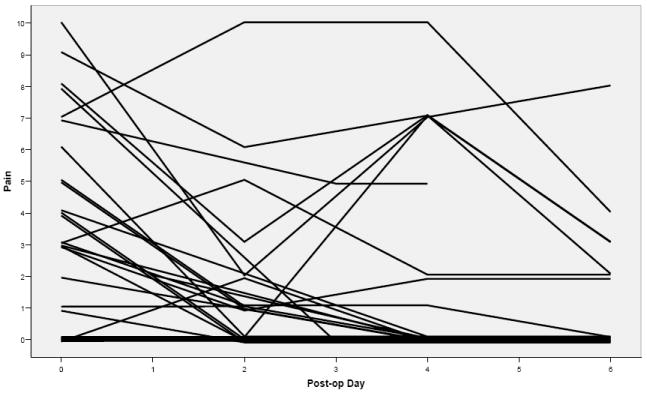
Trajectories of reported pain at bedtime by 30 veterans over the first postoperative week (from Busch, 2002). Each line on the graph represents the experience of one subject. The entire range of the scale was represented on the night of surgery. Most showed a downward pattern and were pain-free after 1 week. Others experienced a variable course and 3 (10%) continued to rate pain at 2 or more on the 6th postoperative evening. Trajectories are jiggered (a small random component was added to distinguish cases with the same trajectory); the thick tracing near the pain score of 0 represented 10 cases on the day of surgery and 24 on postoperative day 6.
Temporal Language and Time-dependent Data
The language of clinical practice is suffused with temporality: The baby is off to a healthy start. The patient is going downhill fast. After a rocky post-op course, the patient was pain-free at discharge. When he exercised regularly, glucose levels decreased and stabilized. She recovered quickly after the nurse lifted her spirits. The baby’s family felt dysfunctional after the premature birth, but communication improved as time went on. Increasing prevalence of the flu seemed to create a lingering sense of anxiety in the country. These examples emphasize the health experience of an individual person, family, or population-as-a-whole over some relevant interval of time.
Time-dependent data are ubiquitous and important in health services. Early U.S. nursing leader Linda Richards believed that nurses should approach their work with “eyes ever open to detect the slightest change” (as cited in Baer, 1985, p. 37); Richards’ invention of the written bedside record to document the health course of hospitalized patients over time, including their responses to nursing actions, reflected her belief in the importance of identifying, understanding, and acting on trends in health status during acute illness. The health history, obtained by interview or written self-report and maintained in medical records, is a key mechanism for obtaining information relevant to creating explanations (diagnoses) for current complaints and making effective and acceptable treatment plans to manage illness and optimize health over time.
Indeed, diary recordkeeping itself is now recognized as one of the most successful approaches to assessment and intervention for many health and illness concerns. For example, keeping records of food intake and exercise activities in light of personal behavioral goals is a recommended component of a weight loss plan (National Heart, Lung, and Blood Institute, 2000); daily self-report diaries to document bladder functioning are used to understand dysfunctional mechanics (National Institute of Diabetes and Digestive and Kidney Diseases, n.d.); and sleep diaries are used to assess sleep-wake patterns in the evaluation of insomnia complaints (Sateia, Doghramji, Hauri, & Morin, 2000). Real-time data capture using telemetry, wearable computers, and ecological momentary assessment creates time-tagged intensive longitudinal data with potential to understand manifestations of health and illness in natural settings (Chatterjee & Price, 2009). At the website www.patientslikeme.com, groups of patients with the same chronic disease use the internet to contribute data about individual course over time to learn more about prognosis and the impact of new interventions on individual trajectories.
A shared characteristic of all of these methods is the systematic, repeated, documented observation of some health index over time. Finding patterns in such time-dependent data involves understanding and modeling change.
Change and Time
Change means to be or cause to be different, or to alter the course of an experience. Change occurs naturally and can be induced experimentally (in research situations) or clinically (as a result of self-care or professional interventions).
Defining change as the difference obtained by subtracting scores obtained on two different occasions is fraught with long-recognized methodological limitations (Harris, 1963). New approaches emphasizing modeling longitudinal data on three or more occasions overcome these limitations (Fairclough, 2010; Singer & Willett, 2003). Using contemporary statistical approaches, it is possible to describe intra-individual change over time (trajectories) and explain differences in trajectories among people (Nesselroade & Ram, 2004) simultaneously.
For example, hospitalization of older adults often is complicated by dysfunction in mental status (acute confusion, or delirium). Onset of delirium varies among individuals, as does the trajectory of delirium over time once it occurs (Watanuki, 2003). Predictors of variation in the course of delirium (individual patterns over time, delirium trajectories) may be different from predictors of onset. Likewise, differences in individual parameters of delirium trajectories (i.e., baseline and rate and direction of change) may be more predictive of functional outcome than simple presence or absence of delirium (Cole, Ciampi, Belzile, & Zhong, 2009). Music therapy was associated with between-group (interindividual) mean differences in acute confusion at each of a series of points in time (McCaffrey, 2009), which suggests that individual trajectories (intra-individual change) may be influenced by deliberate caregiver interventions. A trajectories-as-outcome model would provide evidence directly relevant to this conjecture.
Time is the fundamental predictor variable in health trajectory research because health indicators are plotted and modeled as a function of time. Although apparently straightforward, the nature, conceptualization, and measurement of time is elusive and challenging (McGrath & Tschan, 2004). Clock or calendar time, biological or social time, perceived time, and transcendence (beyond time and meaningfulness in time) are relevant to nursing research and are all potentially important as predictors of health status in health trajectory research (Henly, Kallas, Klatt, & Swenson, 2003). In addition to a relevant longitudinal measurement protocol and a testable statistical model consistent with the scientific problem under study, use of a sensible metric for time (Singer & Willett, 2003) is foundational to understanding intra-individual change as it is summarized in the individual health trajectory.
Usefulness and Status of Health Trajectory Research
Applications
The World Health Organization’s (1948) definition of health as “a state of complete physical, mental and social well-being and not merely the absence of disease or infirmity” is reflected in classifications of disease and nursing problems that emphasize existence of problems at a point in time. However, health is experienced as changes over time. True understanding of health and illness experiences and effective intervention for a specific individual, family, group, or population requires insight about the personal health trajectory. Physical growth, psychobiological development, and the overall life course are associated with health trajectories. The terms illness trajectories and disease trajectories have been used to describe the course or progression of chronic disease as experienced over time (Hyman & Corbin, 2001).
Health trajectory research is the longitudinal investigation of the health and illness of individual persons, families, groups or populations over time. It includes observational studies of natural history in context, experimental studies with trajectories as outcomes, and studies of clinical course, including the impact of self-care and professional interventions. Unlike cross-sectional research that emphasizes differences among people at one point in time, the focus of health trajectory research is change in one person (or one family or one community) over time. Findings from the typical cross-sectional research design (with measurements taken on one occasion) are variable-centered and static. In contrast, the health trajectory perspective is dynamic, idiographic, and person-focused.
Person-focused Research
The search for pattern in health behaviors and illness responses in early nursing research was based on a nomothetic philosophy of science that emphasized a quest for universal statements (e.g., Silva, 1977). Differences among individuals were regarded as sampling error. This view was consistent with translation and testing theoretical propositions as fixed effects in general linear model statistical approaches. From this perspective, results of observational studies from analysis of cross-sectional data on covariation among variables across individuals often are interpreted (erroneously) as though they necessarily apply to specific individuals. Findings from clinical trials based on the nomothetic perspective are increasingly recognized as difficult to apply in practice, where the individual case is paramount and patients are increasingly apt to inquire whether they are going to experience the average experimental result (Kent & Hayward, 2007).
The person-specific idiographic complement to the traditional research perspective (Molenaar, 2004) in nursing (Henly, 2007) is matched to the clinical imperative to understand the individual case, and to tailor therapeutic actions to optimize individual health outcomes. Modeling intra-individual variation, obtained by repeated measurement over a set of health-related variables (including treatments and interventions) over time, is at the heart of the idiographic, person-centered approach. Modeling individual course over time summarizes the uniqueness of individual health experiences up to a given point in time and permits the “What happens next?” question to be answered (Raudenbush, 2005). Once the course of health over time for individual cases is understood, between-individual differences in individual health trajectories can be explored (cf., Nesselroade & Ram, 2004).
Longitudinal Research in Nursing
Nursing research as currently conceived is variable-focused and generally lacks use of a repeated measures or longitudinal design perspective needed to create a person-centered science. Empirical assessment of published nursing research supports this conclusion. Jacobsen and Meininger (1985) studied the design of research published in Nursing Research, the Western Journal of Nursing Research, and Research in Nursing & Health in 7 selected years from 1956 to 1983 and found the studies were primarily cross-sectional studies (Jacobsen & Meininger, 1985). Most designs (75%) were observational. Use of longitudinal designs ranged from 12% to 33% in observational studies. In experimental or quasi-experimental studies, about 50% were longitudinal, but most of these involved only pretest-posttest designs producing measurements used to calculate change scores, tested groups for equivalence at baseline, or used pretest scores as covariates in assessment of group differences on an outcome at posttest measurement (i.e., analysis of covariance; ANCOVA). Although use of the ANCOVA approach with data from true experiments permits more precise estimation of population average effect of treatment at the time the outcome was measured, none of the approaches provides information about individual health trajectories.
To follow up on the Jacobsen and Meininger (1985) assessment of designs in published nursing research studies, primary reports published in the same three journals during the subsequent years from 1986-1988, 1996-1998, and 2006-2008 (9 years total) were examined. As in the Jacobsen and Meininger report, literature reviews, articles on instrument development, and methods papers were excluded. Designs were considered longitudinal if data collection occurred on two or more occasions. The number of studies using longitudinal designs has increased to about 25 per year, but the proportion of studies that were longitudinal has decreased slightly over time to about 25% (Table 1). The number of two-wave (pre-post) data collection designs utilized in longitudinal studies decreased and use of four or more waves increased, although this increase was more pronounced in the 1990s, rather than recently. Analytic approaches used since 1986 are shown in Table 2. The most notable trend has been away from using correlations. Survival analysis, used for analyzing time to event occurrence, remains a rarely utilized tool. Repeated measures analysis of variance (ANOVA) continued to be used frequently to model longitudinal data, despite well-known restrictive and unrealistic assumptions (Raudenbush & Bryk, 2002). There was a pronounced and steady increase in use of growth modeling (random coefficients or mixed effects models for change) to 28.9% (24 of 83 longitudinal papers) during the 2006-2008 period. The majority of the published growth modeling papers in nursing science were focused on community-dwelling adults taking part in experimental studies of a wide range of health-illness outcomes (e.g., smoking, physical activity, osteoporosis, anxiety, depression, quality of life). Willett and Singer (2004) reported that the number of longitudinal studies in medicine, psychology, and sociology increased dramatically from 1982-2002 (based on a search of 6 OVID databases for longitudinal in titles). Although use of repeated measures ANOVA was similar to that in nursing science, use of mixed effects modeling (including random coefficients approaches) for growth data was only 7% and 15% in 1999 and 2003, respectively, in 10 American Psychological Association journals.
Table 1.
Longitudinal Studies and Waves of Data Collection by Decade in Studies Published in Three Nursing Research Journals
| Years | Waves
|
||||
|---|---|---|---|---|---|
| 2 n (%) | 3 n (%) | ≥ 4 n (%) | |||
| 1986-1988 | |||||
| Number of Papers | 299 | ||||
| Longitudinal Studies | N (%) | 71 (59.2) | 42 (59.2) | 15 (21.1) | 14 (19.7) |
| 1996-1998 | |||||
| Number of Papers | 301 | ||||
| Longitudinal Studies | N (%) | 82 (21.1) | 29 (35.4) | 19 (23.2) | 34 (41.5) |
| 2006-2008 | |||||
| Number of Papers | 327 | ||||
| Longitudinal Studies | N (%) | 83 (19.7) | 31 (37.3) | 24 (28.9) | 28 (33.7) |
Notes. Papers published in Nursing Research, the Western Journal of Nursing Research, and Research in Nursing & Health were reviewed.
Table 2.
Primary Analysis Procedure Used for Longitudinal Data by Decade in Studies Published in Three Nursing Research Journals
| Analysis Approach | 1986-1988 (n = 71 ) |
1996-1998 (n = 82 ) |
2006-2008 (n = 83) |
|---|---|---|---|
| Descriptive only | 4.2 | 6.1 | 4.8 |
| T test, chi square, nonparametric | 12.7 | 11.0 | 9.6 |
| Correlation | 16.9 | 1.2 | 3.6 |
| ANOVA | 29.6 | 22.0 | 10.8 |
| Repeated measures ANOVA | 19.7 | 31.7 | 24.1 |
| Regression | 14.1 | 12.2 | 15.7 |
| Survival analysis | 0 | 2.4 | 2.4 |
| Growth modeling | 2.8 | 13.4 | 28.9 |
Notes. Table entries are percents. Journals were Nursing Research, the Western Journal of Nursing Research, and Research in Nursing and Health.
ANOVA = analysis of variance
Willett and Singer (2004) offered a testimonial from peer review of their own research papers that reviewers and readers of journals have not been trained in contemporary methods for analyzing change over time and that the concepts and methods were felt to be difficult. Among scientific and statistical reviewers of Nursing Research, quality of review of longitudinal aspects of design was lowest among 10 statistical aspects of submitted manuscripts (Henly, Bennett, & Dougherty, 2010). Thus, use of contemporary longitudinal models may be inhibited in many areas of research, including nursing, by lack of familiarity and mastery of the methods.
Key Elements of Health Trajectory Research
As in related disciplines such as psychology (Collins, 2006), advancing nursing research to incorporate trajectory science involves integration of theory about change, effective use of longitudinal design, and estimation of statistical models for individual growth and decline. Health trajectory science will develop effectively if traditions in nursing research evolve in supportive ways.
Theory
Over 30 years ago, Donaldson and Crowley (1978) described the recurrent themes in nursing inquiry as the processes of health and illness, patterning of health behavior in context during critical life situations, and processes by which positive changes in health are induced. Although change in health status is implicit in each theme, time as the essential variable in describing change was not addressed. Time is absent in nursing meta-theory identifying person, environment, nursing, and health as key meta-concepts (Flaskerud & Halloran, 1980), even as the purpose of nursing is to improve and sustain health, or prevent decline in health, of persons (individuals, families, groups, communities) in interaction with the environment. The temporal context essential to understanding every process for affecting health and illness status is not explicit. Time is an essential meta-concept for nursing. As an example, time figured importantly in Brant, Beck, and Miaskowski’s (2010) critique of theories for symptom management. Stretching nursing research tradition to include trajectory analysis is needed to understand and support patient experiences during critical life situations that include serious symptom experiences. The dynamic trajectory perspective aligns scientific and clinical perspectives by focusing on the individual person, family, group, or population in a way that is consistent with the human experience of health and illness over time.
Moving from static to dynamic theorizing about health and illness is challenging because temporal concepts are novel in nursing research and ways to express relationships among temporally relevant ideas are unfamiliar. Health trajectory science is composed of concepts and relationships associated with intra-individual change and interindividual differences in intra-individual change (cf., Nesselroade & Ram, 2004). Specification of a theory about individual change is the first stage in health trajectory research. Describing and explaining interindividual differences in intra-individual change is the second stage. Taken together, theory for health trajectory research is dynamic, emphasizing patterns of change and the forces that produce change. This is in sharp contrast to static theoretical statements about relationships among variables at a single point in time.
Theorizing about intra-individual change (Singer & Willett, 2003) in health or illness over time requires: (a) conceptualization of a health-illness dimension of interest and selection of a change-sensitive indicator of it; (b) conceptualization of time and selection of a timescale relevant to the indicator and to the context of the research question; and (c) specification of the form of the relationship between time and the indicator. Many indicators are associated with familiar health-illness constructs in nursing research, but new measurement approaches emphasizing within-person validity over time will be needed to model intra-individual change (Collins, 1991). Consideration of time and timescale, combined with the duration and frequency of measurement, requires insight into the process under investigation (McGrath & Tschan, 2004, pp. 160-161). The relationship between time and individual health and illness (change) may be discontinuous (from one state or stages to another) or continuous. Individual continuous change may show increasing or decreasing smooth patterns that are described easily using simple mathematical functions, or may fluctuate in complex ways with multiple increases and decreases over time. When between-person variation in intra-individual change exists, naturally occurring personal factors and deliberate experimental or clinical actions may explain interindividual differences in trajectories in both time-invariant and time-variant ways. Time itself may moderate the impact of the relationship between a covariate and a changing health status indicator. Theory for health trajectories is inherently multilevel in nature, because individual differences affect personal parameters governing change over time at the individual level. Thought involved in theorizing about individual change over time thus introduces many additional considerations into the theory-building process.
Design
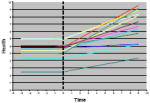
Figure 3 is an adaptation of Campbell and Stanley’s graph (1963) that shows baseline and possible outcome trajectories following implementation of an intervention at some time t. It demonstrates that observation over time, both before and after treatment, is critical to making inferences about treatment effects. Such temporal considerations are essential to the overall plan for experimental and observational health trajectory research. Key issues include creation of a measurement protocol with potential to reveal patterns of change in the health indicator under study, a scheme for measuring and coding time, and use of instrumentation for measuring health status that produces scores responsive to individual change.
Figure 3.
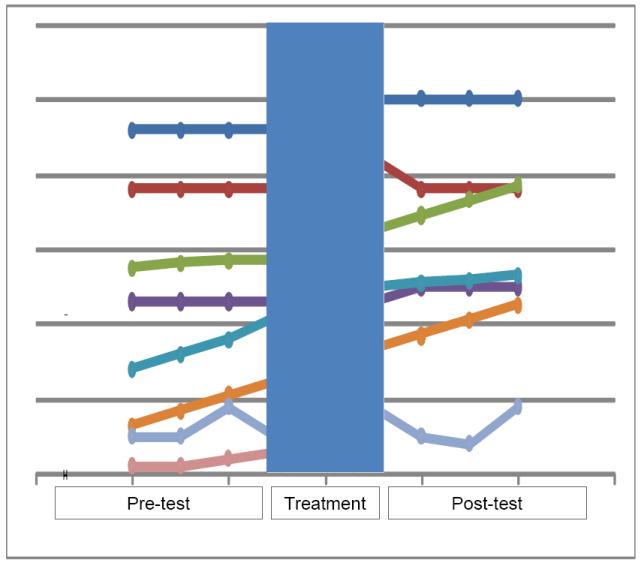
Some patterns of individual change over time before and after intervention (shaded area). Interpretation of the experimental effect varies, depending upon the pretest and post-test trajectories. (Adapted from Campbell. Experimental and Quasi-Experimental Designs for research, 1E. ©1966 Wadsworth, a part of Cengage Learning, Inc. Reproduced by permission. www.cengage.com/permissions).
Careful selection of the scale (metric) and coding of time is essential to revealing the nature of the trajectory and interpretation of the growth parameters. Often, a variety of indicators for time exist. Because there is no natural origin for time, a key decision involves determination of when time begins for a trajectory. Usually, theoretically interesting time-points are selected. Examples of initial time points (t0) include the time of a transition such as birth of an infant, admission to or discharge from hospital, time of diagnosis of a chronic or terminal disease, or the point of onset of symptoms.
Some understanding of when change occurs and the form that change takes is needed to establish a measurement protocol. The timing of the first observation, the duration of the overall observation period, and the frequency of observations are specified in a measurement protocol. More elaborate models for change require a larger number of observations, timed to capture key features of the individual experience. Contemporary statistical methods are flexible with respect to measurement protocols, and person-level change can be modeled with data obtained using individualized protocols over time (Singer & Willett, 2003). Individual participants may be observed on variable schedules and for different numbers of occasions within the timeframe of theoretical interest.
Health trajectory research requires use of instrumentation for measurement of health indexes that produce valid scores responsive to change over time. Reliability in the sense of coefficient alpha, predicated on indexing true differences between people on one occasion, is not necessarily expected, required, or desirable when the focus is modeling intra-individual change (Collins, 1991). Instead, construct stability and preservation of metric validity precision over time are essential (Meredith & Horn, 2001).
Statistical Models for Change
Translation of scientific propositions to testable statistical models is an essential research activity (Jöreskog, 1993). Within the health trajectory framework, the challenge is to map theory for change to testable statistical models to emphasize the individual experience over time. Change in health status occurs in many ways, ranging from not at all (stability) to constant positive or negative rates, increasingly faster or slower rates, or complex change that occurs in phases (Cudeck & Harring, 2007; Cudeck & Klebe, 2002).
Functions
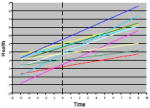
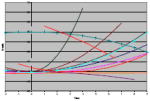
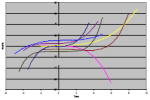
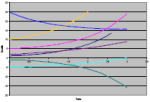
Some mathematical functions that can be used to model change in health status are listed in Table 3. Within each functional family, variations shown on the graphs are governed by sets of parameters to create specific characteristics that individualize the growth curves. Constant functions all show no change, but the parameter value κ distinguishes them by level (value at which the y-intercept is crossed when time = 0). Linear functions used to model constant rates of change are governed by 2 change parameters: π0 (the value of a health indicator at time = 0, or y-intercept) and π1 (the rate of change, or slope). Quadratic and higher-order polynomial functions are useful for modeling phenomena with varying rates of change (acceleration or deceleration) over time. Likewise, exponential functions capture extreme values at time = 0 (ξ), values at which a health index eventually levels out over time (α, the asymptote), and variable times taken to change from the extreme value at time = 0 to the leveling-out value (ρ, the rate). Piecewise functions are used to model multiphase processes characterized by different change processes during different periods of time (Cudeck & Klebe, 2002).
Table 3.
Selected Mathematical Functions Used to Model Change
| Function | Parameters | Typical Graphs |
|---|---|---|
| Constant | κ = y-intercept |
|
| H(t) = κ | ||
| Linear | π0 = y-intercept |
|
| H(t) = π0 + π1t | π1 = slope (rate of change) | |
| Quadratic | π0 = y-intercept |
|
| H(t) = π0 + π1t + π2t2 | π1 = linear change coefficient | |
| π1 = quadratic change term | ||
| Higher-Order Polynomial | π0 = y-intercept |
|
| H(t) = π0 + π1t + π2t2 + … + πntn | π1 = linear change coefficient | |
| π1 = quadratic change coefficient | ||
| πn = nth degree change coefficient | ||
| Exponential | α = asymptote (leveling out value) |
|
| H(t) = α + (ξ − α)eρt | ξ = extreme value at t = 0 | |
| ρ = rate of change between ξ and α | ||
| Piece-wise | Parameters of H1 |
|
| H(t) = H1(t), t < tj | Parameters of H2 | |
| H(t) = H1(t), t ≥ tj |
Notes. H(t) = health as a function of time. Constant, linear, and quadratic functions are all polynomials. The symbol e in the exponential function is a constant approximately equal to 2.718 (the base of the natural log system). The expressions for the piecewise function means that the form of the function is different before and after some specified point in time j. The typical graphs shown for the piecewise function are linear before and after tj.
Selection of a function to characterize change is derived from clinical practice, previous findings from systematic observation over time in research, and careful plotting of case trajectories as part of preliminary analysis of longitudinal data. For example, grief following death of a spouse normally occurs and persists for some time. After consideration of several functional forms, exponential change was selected as the most reasonable way to model individual grief trajectories using repeated pre- and postloss Center for Epidemiological Studies-Depression (CES-D) scores among surviving spouses taking part in the Changing Lives of Older Couples (CLOC) study (Burke, Shrout, & Bolger, 2007). Preloss patterns of depression over time, intensity of the immediate response, shape of the grief experience over time, and eventual level of resolution varied. Marital quality and preloss coping efficacy predicted grief trajectories. Commonalities among individual trajectories were used analytically to identify groups of surviving spouses with similar experiences over time (spouses with chronic depression unchanged by loss, chronic unresolved grief not preceded by depression, resilient with no preloss depression and little postloss grief, common grief with an intense immediate response followed by resolution, and spouses with preloss depression that resolved following loss).
Random coefficients model for linear change
Random coefficients models (also called individual growth models, mixed models, and multilevel models for longitudinal data) are used to model individual trajectories and the impact of personal and situational factors (covariates) on the parameters of the individual trajectories (Raudenbush & Bryk, 2002; Singer & Willett, 2003). Linear models often are selected as a model for change because of their ease of use and interpretation. Adapting the notation and following the presentation of Singer and Willett, the individual level model for a continuously-varying health status indicator h for person i at time j is
| (1) |
The growth parameters π0i and π1i are subscripted with i to indicate that, within the linear framework, each person is following a unique pattern of change. The εij in Eqn. 1 are stochastic (random) components of each person i’s score h at time j and is regarded for simplicity as normally distributed; that is,
| (2) |
More realistically, autocorrelation and heteroscedasticity over time may be modeled in the level 1 model for individual change.
Systematic interindividual differences in intra-individual change, arising from personal or situational factors, may be incorporated as predictors of the trajectories by considering the π0i and π1i (individual trajectories) as outcomes. Systematic differences in change may arise also from a randomly assigned intervention protocol. For this common research situation,
| (3) |
and
| (4) |
In this level 2 (structural) model, γ00 is the grand mean for the set of individual intercepts π0i and γ10 is the grand mean for the set of individual slopes π1i. When INTERVENTION is scored as 0 = control and 1 = treatment, the coefficients γ01 and γ11 give the population average difference at baseline (usually expected to be nonsignificant) and population average difference in rate of change (the treatment effect, expected to be significant) between control and intervention groups. The stochastic terms ζ0i and ζ1i are deviations between individual growth parameters and the respective population average value, and are assumed to have a bivariate normal distribution with means equal to 0, variances equal to σ2 1 and to σ2 2 , and covariance to σ12. Overall model fit, model comparison approaches, and significance of the fixed and random effects can be assessed using standard approaches (Singer & Willett, 2003).
Extensions and complementary approaches
Statistical advances over the past 30 years have created flexible extensions of the basic model for trajectory analysis (Skrondal & Rabe-Hesketh, 2004), some of which are listed in Table 4. One type of extension focuses on prediction of growth parameters. Incorporating time-varying covariates (predictors) to the model allows better understanding of covariate impact on trajectory parameters across the time of observation, and modeling trajectories in context adjusts growth parameters to allow for the moderating effects of variables at higher levels of a hierarchical theoretical system. Another type of extension to the basic model focuses on the trajectories themselves. The aim of latent class growth analysis and growth mixture modes is to identify latent heterogeneity in growth by identifying groups of individuals (latent classes, or components of mixture distributions, respectively) whose pattern of change is similar. The key difference between the two approaches is that within-class variability is modeled in the growth mixture approach, but not in the latent class approach. Parallel process models involve simultaneous estimation of growth parameters in two or more trajectories, including estimation of the relationships among the growth parameters for each of the trajectories. Trajectories for variables measured with categorical responses are hierarchical generalized linear models with a link function. The link function transforms the trajectory variable in a way that is consistent with the sampling model (e.g., cumulative logit link for the multinomial sampling model associated with ordered categorical responses for the trajectory variable). Models that are complementary to the random coefficients approach for longitudinal data are also available. Generalized estimating equations (GEE) incorporates dependence in observations over time in the estimation of a population-average (marginal) model for the means at each time point that maintains desirable properties of the estimates (consistency) without relying on the assumptions that support hierarchical generalized linear models. Finally, emerging dynamic process models are similar to trajectory models because they explore repeated measurements as a function of time, but differ completely in the functional approach used. Dynamic process models use differential equations to explore relationships among varying rates of change over time in related variables. Exemplars for each of these approaches are provided in Table 4, and many of them are used in the primary reports included in this supplement.
Table 4.
Extensions of the Basic Random Coefficients Model for Change and Complementary Approaches: Purposes and Examples
| Model/Approach | Purpose | Example |
|---|---|---|
| Time-varying Covariates | To estimate the effects of an individual’s changing status on trajectory parameters | Harrison, T., Blozis, S., & Stuifbergen, A. (2008). Longitudinal predictors of attitudes towards aging among women with multiple sclerosis. Psychology & Aging, 23, 823-832. doi: 10.1037/a0013802 |
| Trajectories in Context | To estimate the effects of contextual factors on trajectory parameters | Black, M. M., & Krishnakuman, A. (1999). Predicting longitudinal growth curves of height and weight using ecological factors for children with and without early growth deficiency. Journal of Nutrition, 129, 539-543. |
| Latent Class Growth Model | To identify latent classes based on similar trajectories, without variation within class | Gill, T. M., Gahbauer, E. A., Han, L., & Allore, H. G. (2010). Trajectories of disability in the last year of life. New England Journal of Medicine, 362, 1173-1180. |
| Growth Mixture Model | To identify latent classes based on similar trajectories, allowing individual variation within class | Stoddard, S. A., Henly, S. J., Sieving, R. E., & Bolland, J. (2010). Social connections, trajectories of hopelessness and serious violence in impoverished urban youth. Journal of Youth and Adolescence. doi: 10.1007/s10964-010-9580-z |
| Parallel Process Model | To estimate multiple trajectories and relationships among growth parameters for each trajectory | Taylor, M. G., & Lynch, S. M. (2004). Trajectories of impairment, social support, and depressive symptoms in later life. Journal of Gerontology: Social Sciences, 59B, S238-S246. doi: 10.1093/geronb/59.4.S238 |
| Categorical Responses | To estimate trajectories based on categorical responses by incorporating a link function into the model | Hedeker, D., & Mermelston, R. J. (2000). Analysis of longitudinal substance use outcomes using ordinal random-effects regression models. Addiction, 95 (Supp. 3), S381-S394. doi: 10.1080.09652140020004296 |
| Generalized Estimating Equations | To estimate a population average model for longitudinal data using a semiparametric regression approach | Bohl, A. A., Fishman, P. A., Ciol, M. A., Williams, B., LoGerfo, J., & Phelas, E. A. (2010). A longitudinal analysis of total 3-year healthcare costs for older adults who experience a fall requiring medical care. Journal of the American Geriatrics Society, 58, 853-860. doi: 10.1111/j.1532-5415.2010.02816.x |
| Dynamic Process Models | To estimate parameters of dynamic systems using coupled differential equations models | Boker, S. M., & Laurenceau, J.-P. (2006). Dynamical systems modeling: An application to the regulation of intimacy and disclosure in marriage. In T. A. Walls & J.L. Schafer, Models for intensive longitudinal data (pp. 195-218). Oxford: University Press. |
Missing data
Flexibility to individualize measurement protocols for participants is a desirable quality of growth models contributing to feasibility of implementing research protocols. Data from every participant with at least one observation at some point in time can be incorporated into estimation of the model, provided that data are missing completely at random (MCAR) or missing at random (MAR); even nonignorable missingness may provide robust results. See Raudenbush and Bryk (2002, p. 199-200) for discussion about assessing missingness.
Power and accuracy of estimates
Asymptotic procedures used to estimate parameters in growth models assume large samples. Accuracy in growth parameter estimation and power to detect treatment effects in trials with trajectories as outcomes depend on sample size as well as the duration, interval, and frequency of measurement of the trajectory variable; the impact of these factors varies with functions used to model change (e.g., linear or higher order polynomial; Raudenbush & Liu, 2001). Costs associated with various combinations of sample size and temporal protocols must be considered also when planning studies.
Estimation software
Random coefficients models can be estimated using HLM, MPlus, LISREL, SAS PROC MIXED, and other programs. Some programs require special data set-ups and not all can be used to estimate variations such as time-varying covariates, multiple covariant trajectories, or modeling indicators with discrete values. Examples (including data, input, and output) can be found online at http://gseacademic.harvard.edu/alda/.
Summary
Health trajectory science provides relevant knowledge for improved nursing services and optimal outcomes, at the point of care and beyond, for individual patients, individual families, and individual communities. Whether describing the natural history of a health experience or assessing the impact of an intervention on health over time, theory about change, temporal design of a study, and a statistical model to describe the impact of time on health are linked to emphasize the individual experience. The health trajectory perspective opens new horizons for nursing research that uses time to create a person-centered science.
Acknowledgments
Funded in part by the National Institute of Nursing Research (Grant #P20 NR008992; Center for Health Trajectory Research). The content is solely the responsibility of the authors and does not necessarily represent the official views of the National Institute of Nursing Research or the National Institutes of Health.
Contributor Information
Susan J. Henly, University of Minnesota School of Nursing, Twin Cities, Minnesota.
Jean F. Wyman, University of Minnesota School of Nursing, Twin Cities, Minnesota.
Mary J. Findorff, University of Minnesota School of Nursing, Twin Cities, Minnesota.
References
- Baer ED. Nursing’s divided house—an historical view. Nursing Research. 1985;34:32–38. [PubMed] [Google Scholar]
- Bolman RM, III, Black SM. Open cardiac repair under direct vision: F. John Lewis and the University of Minnesota. Journal of Cardiac Surgery. 2003;18(4):328–332. doi: 10.1046/j.1540-8191.2003.02084.x. [DOI] [PubMed] [Google Scholar]
- Brant JM, Beck S, Miaskowski C. Building dynamic models and theories to advance the science of symptom management research. Journal of Advanced Nursing. 2010;66(1):228–240. doi: 10.1111/j.1365-2648.2009.05179.x. [DOI] [PubMed] [Google Scholar]
- Burke CT, Shrout PE, Bolger N. Individual differences in adjustment to spousal loss: A nonlinear mixed model analysis. International Journal of Behavioral Development. 2007;31:405–415. [Google Scholar]
- Busch SE. Unpublished Masters Thesis, University of Minnesota, Twin Cities. 2002. Sleep patterns following an outpatient surgical procedure. [Google Scholar]
- Campbell DT, Stanley JC. Experimental and quasi-experimental designs for research. Chicago, IL: Rand McNally; 1963. [Google Scholar]
- Chatterjee S, Price A. Healthy living with persuasive technologies: Framework, issues, and challenges. Journal of the American Informatics Association. 2009;16(2):171–178. doi: 10.1197/jamia.M2859. [DOI] [PMC free article] [PubMed] [Google Scholar]
- Cole MG, Ciampi A, Belzile E, Zhong L. Persistent delirium in older hospital patients: A systematic review of frequency and prognosis. Age and Ageing. 2009;38(1):19–26. doi: 10.1093/ageing/afn253. [DOI] [PubMed] [Google Scholar]
- Collins LM. Measurement in longitudinal research. In: Collins LM, Horn JL, editors. Best methods for the analysis of change. Washington, DC: American Psychological Association; 1991. pp. 137–148. [Google Scholar]
- Collins LM. Analysis of longitudinal data: The integration of theoretical model, temporal design, and statistical model. Annual Review of Psychology. 2006;57:505–528. doi: 10.1146/annurev.psych.57.102904.190146. [DOI] [PubMed] [Google Scholar]
- Cudeck R, Harring JR. Analysis of nonlinear patterns of change with random coefficient models. Annual Review of Psychology. 2007;58:615–637. doi: 10.1146/annurev.psych.58.110405.085520. [DOI] [PubMed] [Google Scholar]
- Cudeck R, Klebe KJ. Multiphase mixed-effects models for repeated measures data. Psychological Methods. 2002;7(1):41–63. doi: 10.1037/1082-989x.7.1.41. [DOI] [PubMed] [Google Scholar]
- Donaldson SK, Crowley DM. The discipline of nursing. Nursing Outlook. 1978;26:113–120. [PubMed] [Google Scholar]
- Fairclough DL. Design and analysis of quality of life studies in clinical trials. Boca Raton, FL: CRC Press; 2010. [Google Scholar]
- Flaskerud JH, Halloran EJ. Areas of agreement in nursing theory development. ANS: Advances in Nursing Science. 1980;3(1):1–7. [PubMed] [Google Scholar]
- Harris CW, editor. Problems in measuring change. Madison, WI: The University of Wisconsin Press; 1963. [Google Scholar]
- Henly SJ. Lost in time. The person in nursing research [Editorial] Nursing Research. 2007;56(3):147. doi: 10.1097/01.NNR.0000270022.67489.e3. [DOI] [PubMed] [Google Scholar]
- Henly SJ, Bennett JA, Dougherty MC. Scientific and statistical reviews submitted to Nursing Research: Comparison of completeness, quality, and usefulness. Nursing Outlook. 2010;58(4):188–199. doi: 10.1016/j.outlook.2010.04.004. [DOI] [PubMed] [Google Scholar]
- Henly SJ, Kallas KD, Klatt CM, Swenson KK. The notion of time in symptom experiences. Nursing Research. 2003;52(6):410–417. doi: 10.1097/00006199-200311000-00009. [DOI] [PubMed] [Google Scholar]
- Hyman R, Corbin J, editors. Chronic illness: Research and theory for nursing practice. New York, NY: Springer; 2001. [Google Scholar]
- Jacobsen BS, Meininger JC. The designs and methods of published nursing research: 1956-1983. Nursing Research. 1985;34(5):306–312. [PubMed] [Google Scholar]
- Jöreskog KG. Testing structural equation models. In: Bollen KA, Long JS, editors. Testing structural equation models. Thousand Oaks, CA: Sage; 1993. pp. 294–316. [Google Scholar]
- Kent D, Hayward R. When averages hide individual differences in clinical trials. American Scientist. 2007;95:52–59. [Google Scholar]
- Laird NM, Ware H. Random-effects models for longitudinal data. Biometrics. 1982;38:963–974. [PubMed] [Google Scholar]
- McCaffrey R. The effect of music on acute confusion in older adults after hip or knee surgery. Applied Nursing Research. 2009;22(2):107–112. doi: 10.1016/j.apnr.2007.06.004. [DOI] [PubMed] [Google Scholar]
- McGrath JE, Tschan F. Temporal matters in social psychology. Washington, DC: American Psychological Association; 2004. [Google Scholar]
- Meredith W, Horn J. The role of factorial invariance in modeling growth and change. In: Collins LM, Sayer AG, editors. New methods for the analysis of change. Washington, DC: American Psychological Association; 2001. pp. 203–240. [Google Scholar]
- Molenaar PCM. A manifesto on psychology as idiographic science: Bringing the person back into scientific psychology, this time forever. Measurement: Interdisciplinary Research and Perspectives. 2004;2:201–218. [Google Scholar]
- Muthén B, Muthén LK. Integrating person-centered and variable-centered analyses: Growth mixture modeling with latent trajectory classes. Alcoholism, Clinical and Experimental Research. 2000;24(6):882–891. [PubMed] [Google Scholar]
- National Heart, Lung, and Blood Institute Obesity Education Initiative Expert Panel on the Identification, Evaluation, and Treatment of Overweight and Obesity in Adults. Practical guide to the identification, evaluation, and treatment of overweight and obesity in adults. Rockville, MD: National Institutes of Health; 2000. NIH Publication Number 00-4084. [Google Scholar]
- National Institute of Diabetes and Digestive and Kidney Diseases. Bladder control for women. n.d. Available at: http://kidney.niddk.nih.gov/kudiseases/pubs/bladdercontrol/index.htm.
- Nesselroade JR, Ram N. Studying intraindividual variability: What we have learned that will help us understand lives in context. Research in Human Development. 2004;1:9–29. [Google Scholar]
- Raudenbush SW. How do we study “what happens next’? Annals of the American Academy of Political and Social Science. 2005;601:131–144. [Google Scholar]
- Raudenbush SW, Bryk AS. Hierarchical linear models. Applications and data analysis methods. 2. Thousand Oaks, CA: Sage; 2002. [Google Scholar]
- Raudenbush SW, Liu X-F. Effects of study duration, frequency of observation, and sample size on power in studies of group differences in polynomial change. Psychological Methods. 2001;6(4):387–401. [PubMed] [Google Scholar]
- Sateia MJ, Doghramji K, Hauri PJ, Morin CM. Evaluation of chronic insomnia. Sleep. 2000;23:243–308. [PubMed] [Google Scholar]
- Silva MC. Philosophy, science, theory: Interrelationships and implications for nursing research. Image. 1977;9(3):59–63. doi: 10.1111/j.1547-5069.1977.tb01604.x. [DOI] [PubMed] [Google Scholar]
- Singer JD, Willett JB. Applied longitudinal data analysis. Modeling change and event occurrence. Oxford, UK: Oxford University Press; 2003. [Google Scholar]
- Skrondal A, Rabe-Hesketh S. Generalized latent variable modeling. Multilevel, longitudinal, and structural equation models. Boca Raton, FL: Chapman & Hall/CRC; 2004. [Google Scholar]
- Watanuki S. Unpublished dissertation, University of Minnesota—Twin Cities. 2003. An exploration of the incidence, patterns and course, and correlates of delirium among patients undergoing off-pump coronary artery bypass surgery graft. [Google Scholar]
- Willett JB, Singer JD. Longitudinal research: Present status and future prospects. 2004 Available at: http://gseacademic.harvard.edu/alda/Chapter%20presentations.htm.
- World Health Organization. Preamble to the Constitution of the World Health Organization as adopted by the International Health Conference, New York, 19-22 June, 1946; signed on 22 July 1946 by the representatives of 61 States (Official Records of the World Health Organization, no 2, p 100) and entered into force on 7 April 1948 1948 [Google Scholar]
- World Health Organization. The Ottawa charter of health promotion. Geneva, Switzerland: Author; 1986. [Google Scholar]
- Wyman JF, Henly SJ. Introduction. The Minnesota Center for Health Trajectory Research 2011 [Google Scholar]


