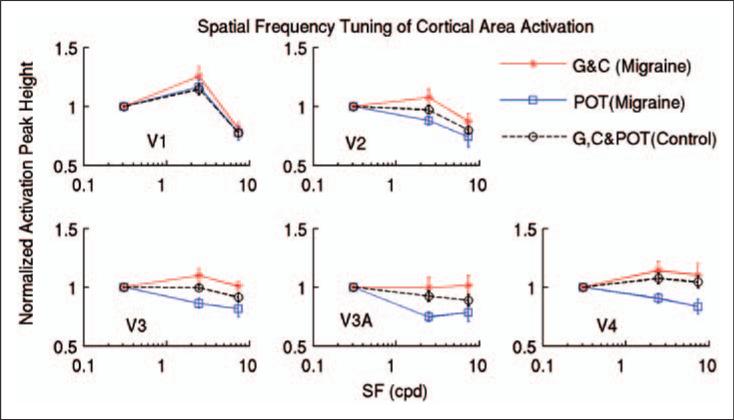
Figure 6.
Comparison of cortical area activation between the control subjects and the migraine patients wearing control gray (G), coloured (C), and precision ophthalmic tint (POT) lenses, shown as a function of the spatial frequency (SF) of the pattern of stripes. The dashed-lines represent the mean peak heights of cortical area activation with the three lenses for the control subjects. The red solid lines represent the mean peak heights of cortical area activation of the G and C lenses for the migraine patients. The blue solid lines represent the peak heights of cortical area activation of the POTs for the migraine patients. Error bars indicate the standard errors of the means.

