

Abstract
Background
Bladder cancer remains a lethal malignancy that can be cured if detected early. DNA hypermethylation is a common epigenetic abnormality in cancer that may serve as a marker of disease activity.
Methods
We selected 10 novel candidate genes from the most frequently hypermethylated genes detected by DNA microarray and bisulfite pyrosequencing of bladder cancers and applied them to detect bladder cancer in urine sediments. We analyzed DNA methylation in the candidate genes by quantitative methylation specific real time PCR (qMSP) to detect bladder cancer in urine sediments from 128 bladder cancer patients and 110 age-matched control subjects.
Results
Based on a multi-gene predictive model, we discovered 6 methylation markers (MYO3A, CA10, SOX11, NKX6-2, PENK and DBC1) as most promising for detecting bladder cancer. A panel of 4 genes (MYO3A, CA10, NKX6-2 and DBC1 or SOX11) had 81 % sensitivity and 97 % specificity, while a panel of 5 genes (MYO3A, CA10, NKX6-2, DBC1 and SOX11 or PENK) had 85 % sensitivity and 95 % specificity for detection of bladder cancer (AUC=0.939). Analyzing the data by cancer invasiveness, detection rate was 47 out of 58 (81 %) in non-muscle invasive tumors (pTa, Tis and pT1) and 62 out of 70 (90 %) in muscle invasive tumors (T2, T3 and T4).
Conclusion
This biomarker panel analyzed by qMSP may help the early detection of bladder tumors in urine sediments with high accuracy.
Impact
The panel of biomarker deserves validation in a large well-controlled prospectively collected sample set.
Introduction
Bladder cancer is the fifth most common cancer in the United States and causes approximately 3% of all cancer-related deaths (1). More than 90% of urothelial cancers are transitional cell carcinomas (TCC). Most (75-85%) bladder cancers are non-muscle invasive tumors (pTa, Tis and pT1) at first diagnosis (2). Generally, the prognosis of non- invasive tumors is good, although up to 80% of cases will recur after complete transurethral resection and up to 45% of cases will progress to invasive cancer in 5 years (2-5). The gold standard for bladder tumor diagnosis is cystoscopy along with biopsy of suspicious lesions. However, this approach can miss 10% to 30% of malignancies and the procedure is invasive and uncomfortable (6-8). Voided urine cytology is the most common noninvasive method for detecting bladder tumors in symptomatic patients and population screening (9) and it was reported to have 34-35% median sensitivity and 94-99% median specificity by meta-analyses (10, 11).
Other methods have been developed to improve detection of bladder cancer based on monoclonal antibodies or fluorescence in situ hybridization (FISH) with probes associated with abnormalities in urinary sediment cells. These include Urovysion (sensitivity 72% and specificity 83%), ImmunoCyt (sensitivity 67-86% and specificity 75-79%), BTAstat (sensitivity 58-71% and specificity 73%), BTAtrack (sensitivity 69-71% and specificity 66-90%), NMP22 (sensitivity 71-73% and specificity 73-80%) and Urinary fibrinogen degradation products (sensitivity 54-77% and specificity 61-87%) (10-12).
Recently, other molecular markers with high sensitivities and specificity like AURKA gene amplification (sensitivity of 87% and specificity of 97%), microsatellite analysis (sensitivity of 72-97% and specificity of 80-100%), detection of telomerase (sensitivity of 70-100% and specificity of 60-96%), MMP-9/TIMP-2 (sensitivity of 97% and specificity of 88%), HYAL1 (sensitivity of 83-94% and specificity of 77-93%), survivin (sensitivity of 64-94% and specificity of 93-100%) and combination of HYAL1 and survivin RNA (sensitivity of 98% and specificity of 100%) were also reported (13-18). These urinary markers are promising but randomized multicenter trials are needed to test their usefulness.
DNA hypermethylation of CpG islands in the promoter of tumor-associated genes and their consequent silencing is a common epigenetic abnormality in cancer and may serve as a useful marker to clone new cancer-related genes as well as a marker of disease activity (19, 20). Several reports indicate that body fluids, including urine (21-25), gastric juice (26), plasma/serum (27), and sputum (28, 29) can be used for noninvasive detection of cancer by hypermethylation of DNA. Previous studies in paired samples indicated that methylation in urine sediment DNA was almost always accompanied by methylation of bladder tumor DNA (22-24).
Here, we report that a group of genes (DBC1, MYO3A, SOX11, NPTX2, NKX6-2, A2BP1, PENK and CA10) highly methylated in primary bladder tumor samples can be used to detect bladder cancer in urine sediment.
Materials and methods
Samples Analyzed
We used 6 human bladder cancer cell lines (UM-UC-2 (T24), UM-UC-3, UM-UC-6, UM-UC-9, UM-UC-13 and UM-UC-14) which were established and authenticated by Dr. Grossman (30) and 26 fresh cystectomy specimens (11 cases of papillary, 13 cases of non-papillary and 2 cases of squamous cell carcinoma) from patients who underwent surgery at The University of Texas MD Anderson Cancer Center (Houston, TX). Normal urothelial cells were prepared from ureters of nephrectomy specimens and used as a control. First-voided urine was collected from 128 bladder cancer patients with cystoscopically evident bladder cancer before they underwent surgery at The University of Texas MD Anderson Cancer Center. Among 128 cases, primary cancers were 88 cases and recurrent cancers were 40 cases. There were no age, gender, ethnic, or cancer stage restrictions on recruitment. Age-matched controls (n=110) were recruited in medicine and urology clinics at The University of Texas Southwestern Medical Center (Dallas, TX). Controls consisted of 71 patients with benign urologic disorder without cystoscopically visible bladder cancer and 39 unaffected healthy individuals. The majority of controls visited the hospital for annual medical check-up. Fifty ml of the urine was centrifuged for 15 minutes at 200 g, and the resulting pelleted material was washed twice with PBS and stored at −70°C until study. DNA from urine sediments was extracted by QIAamp DNA Mini Kit (Qiagen, Germantown, MD). All samples were collected from consenting patients according to institutional guidelines at The University of Texas MD Anderson Cancer Center and The University of Texas Southwestern Medical Center.
CpG methylation analysis by bisulfite pyrosequencing and qMSP
Bisulfite conversion of extracted DNA was performed by EpiTect Bisulfite Kits (Qiagen). We previously used methylated CpG island amplification and microarray (MCAM), a high throughput genome wide methylation assay (31, 32), to investigate methylation changes in the promoters of about 6,600 genes in 85 primary bladder tumors and 12 bladder cancer cell lines. Based on the MCAM results, we selected 10 genes (A2BP1, NPTX2, SOX11, PENK, NKX6-2, DBC1, MYO3A, HSPB9, NPY2R and CA10) from the most frequently hypermethylated genes and studied them by bisulfite pyrosequencing to analyze the quantitative methylation status (Supplementary Figure 1 and Supplementary Table 1) in 6 bladder cancer cell lines and 26 primary bladder tumors. We also analyzed DNA methylation of normal leukocytes and a mixture of normal bladder DNA from 3 persons (2 males and 1 female) as a control. Bisulfite-treated DNA was amplified by hot start and a two-step PCR to reduce the contamination in products due to the amplification of unexpected primer binding sites. A universal primer sequence tag was added to the reverse primer in the nested PCR step, as previously described (33). For pyrosequencing, biotin-labeled DNA strands were prepared and analyzed by PSQ HS 96 Pyrosequencing System (Biotage AB, Uppsala, Sweden). We used M.SssI methylase (New England Biolabs, Beverly, MA)-treated normal leukocytes DNA as a positive control for methylation studies. Bisulfite pyrosequencing in primary bladder tumors was conducted twice and averaged. To call a cancer as methylation positive, we required that its methylation status was at least 10% higher than that seen in a mixture of normal bladder DNA.
For qMSP, we selected 8 genes that had hypermethylation in bladder cancer and low levels of methylation in normal leukocytes. All primers were designed to have the same annealing temperature. Quantity of human DNA in urine was determined after bisulfite conversion by C-LESS DNA (chr20:19,199,387-19,199,455, UCSC Blat 2006 Mar. version), a unique sequence that does not contain cytosines (34). Supplementary Table 2 lists primers and TaqMan probes (Applied Biosystems, Foster City, CA) for mC-LESS and the eight genes examined. For quality control, we adjusted diluted bisufite treated DNA to 100 μl throughout. We used the same volume (3 μl) of bisulfate treated DNA as template for every qMSP (total reaction volume, 20 μl). Each qMSP reaction batch was checked with positive (M. SssI methylase treated DNA) and negative (normal leukocyte DNA) controls, and multiple blanks with no DNA. Each plate was amplified with mC-LESS (internal control) and the tested genes together to avoid inter-assay variation. We also used as validation criteria an intra-assay variation of ΔCt < 1 at a duplicated sample and r2 ≥ 0.99 for at least 4 relevant Ct points. Normal leukocyte DNA was methylated in vitro with twice excess M. SssI methylase and 5-fold serial dilutions (100-0.032 ng) of this DNA were used to construct a calibration curve. When we compared the Ct of mC-LESS with those of other test genes, the correlation was R2 >0.99. All qMSP reactions were done in duplicate in a blinded manner and averaged. All samples were within the assay’s range of sensitivity and reproducibility based on amplification of internal control (threshold cycle [Ct] value for mC-LESS of < 40).
Statistical analysis
The relative level of methylated DNA for each gene in each sample was determined as a ΔCt of qMSP-amplified gene to mC-LESS (internal control). The samples were categorizedas unmethylated or methylated based on the criterion values and coordinates of the receiver operating characteristics (ROC) curve of the assay.
The predictive accuracy of biomarkers was evaluated by calculating the area under the ROC curve (AUC). The ROC curve of both specificity and sensitivity of single or combined biomarkers sets consisting of up to 8 methylation biomarkers was constructed.
Statistical analyses were performed using GraphPad Prism 4 software (GraphPad Software Inc., San Diego, CA) and SPSS statistical software V11.0 (SPSS Inc., Chicago, IL). All p-values were two-sided and P < 0.05 was considered statistically significant. When multiple tests were performed, Bonferroni corrections were applied to the p-values.
Results
Bisulfite pyrosequencing results of 10 selected genes in 6 bladder cancer cell lines and 26 primary bladder tumors are shown in Figure 1. Eight genes (A2BP1, NPTX2, SOX11, PENK, NKX6-2, DBC1, MYO3A and CA10) were highly methylated in bladder tumors and had very low levels of methylation in normal leukocytes. Their methylation frequencies in 26 primary bladder cancer were 62%, 88%, 77%, 92%, 69%, 69%, 65% and 85%, respectively. Two genes, HSPB9 and NPY2R were highly methylated in both bladder tumors and normal leukocyte DNA.
Figure 1.
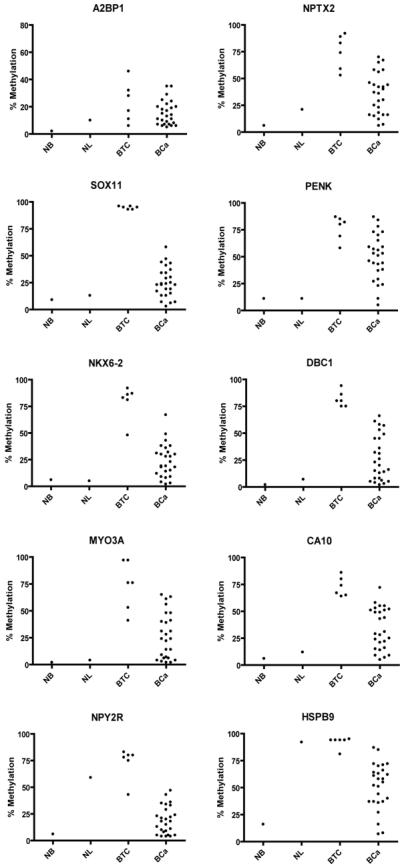
Scatter plot of bisulfite pyrosequencing results of candidate genes in normal bladders (NB), normal leukocytes (NL), 6 bladder tumor cell lines (BTC) and 26 primary bladder tumors (BCa). We used a mixture of normal bladder DNA from 3 persons (2 males and 1 female) as a control (NB). We also analyzed leukocytes because urine sediment DNA contains a high proportion of leukocyte-derived DNA.
To apply this gene panel to early detection, we first analyzed DNA methylation by bisulfite pyrosequencing in urine sediments for two genes, SOX11 and HSPB9 as examples. SOX11 showed increased methylation in urine from bladder cancer patients compared to control but the differences were small, in part due to the relatively high background of pyrosequencing (5%). HSPB9 was highly methylated in the urine sediment of controls, and similarly methylated (though more variable) in the urine sediment of patients (Supplementary Figure 2). These results are consistent with the fact that urine sediment DNA contains a high proportion of leukocyte-derived DNA (even in patients with cancer) and that detection of cancer would require more sensitive and clear cutoff point methods to detect a low frequency of tumor-derived DNA. We therefore applied the qMSP method to overcome these problems and analyzed the 8 genes (DBC1, MYO3A, SOX11, NPTX2, NKX6-2, A2BP1, PENK and CA10) which had low levels of methylation in normal leukocytes.
Overall, we studied urine sediments from 128 bladder cancer patients (median age 69) and 110 control subjects (median age 67) (Table 1 and Supplementary Table 3). The bladder cancer patients consisted of 58 cases of non-muscle invasive tumors (30 cases of pTa, 5 cases of Tis and 23 cases of T1) and 70 cases of muscle invasive tumors (62 cases of T2, 6 cases of T3 and 2 cases of T4). Most (87%) of them were of TCC type. Control subjects consisted of 71 cases of benign urologic symptoms, 39 normal controls including 5 healthy volunteers (Supplementary Table 3). The distribution of qMSP results of each gene in urine sediments is shown in Figure 2. It is obvious that all 8 genes show substantially and significantly more methylation in tumor cases than controls.
Table 1.
Demographic and clinical characteristics of the bladder cancer patients (n=128)
| Characteristics | No. of subjects (%) | |
|---|---|---|
| Histological cell type |
||
| Transitional cell carcinoma (TCC) | 110 (86.0) | |
| Squamous cell carcinoma | 8 (6.3) | |
| Mixed | 5 (3.9) | |
| Adenocarcinoma | 2 (1.6) | |
| Small-cell carcinoma | 2 (1.6) | |
| Pleomorphic sarcomatoid | 1 (0.8) | |
| Race | ||
| Caucasian | 114 (89.1) | |
| African American | 10 (7.8) | |
| Hispanic | 2 (1.6) | |
| Latin American | 2 (1.6) | |
| Age | ||
| < 41 | 9 (7.0) | |
| 41-50 | 4 (3.1) | |
| 51-60 | 20 (15.6) | |
| 61-70 | 40 (31.3) | |
| 71-80 | 42 (32.8) | |
| > 80 | 13 (10.2) | |
| Gender | ||
| Male | 101 (78.9) | |
| Female | 27 (21.1) | |
| Grade | ||
| 1 | 7 (5.5) | |
| 2 | 13 (10.2) | |
| 3 | 108 (84.4) | |
| Stage | ||
| Ta | 30 (23.4) | |
| Tis | 5 (3.9) | |
| T1 | 23 (18.0) | |
| T2 | 62 (48.4) | |
| T3 | 6 (4.7) | |
| T4 | 2 (1.6) |
Figure 2.
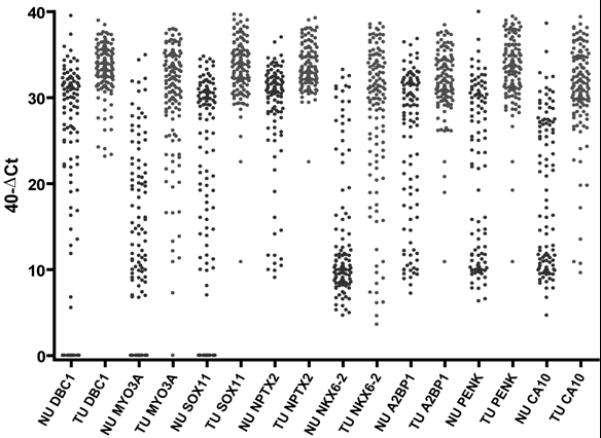
Graph of qMSP results of each gene in urine sediments of bladder cancer patients (n=128) and controls (n=110). The relative level of methylated DNA is depicted as 40-dCt[Ct of specific gene – Ct of mC-LESS (internal control)]. A higher 40-dCt represents more methylation of the target biomarker. All 8 genes show significantly more methylation in tumor cases than controls (P<0.0001).
We evaluated the power of each methylation marker by calculating the area under curve (AUC) of receiver operating characteristic (ROC) using total data set of 128 tumors and 110 controls. A random marker unrelated to bladder cancer is expected to have an AUC value of 0.5. The AUC values for the eight methylation markers we selected in the order from high to low are MYO3A (AUC=0.841, P <0.0001), CA10 (AUC=0.835, P <0.0001), NKX6-2 (AUC=0.823, P <0.0001), PENK (AUC=0.802, P <0.0001), SOX11 (AUC=0.797, P <0.0001), DBC1 (AUC=0.774, P <0.0001), NPTX2 (AUC=0.747, P <0.0001) and A2BP1 (AUC=0.710, P <0.0001). We also performed a correlation analysis for all pairs of markers (Table 2). All pairs of methylation level of genes were correlated with statistical significance (P<0.0001).
Table 2.
Spearman correlation of methylation level of each gene of DNA in urine sediments
| Biomarker | NPTX2 | A2BP1 | SOX11 | MYO3A | NKX6-2 | PENK | CA10 |
|---|---|---|---|---|---|---|---|
| DBC1 | 0.55 | 0.57 | 0.71 | 0.56 | 0.49 | 0.62 | 0.63 |
| NPTX2 | 0.70 | 0.59 | 0.55 | 0.63 | 0.74 | 0.63 | |
| A2BP1 | 0.59 | 0.56 | 0.52 | 0.71 | 0.64 | ||
| SOX11 | 0.70 | 0.57 | 0.72 | 0.66 | |||
| MYO3A | 0.61 | 0.66 | 0.68 | ||||
| NKX6-2 | 0.64 | 0.60 | |||||
| PENK | 0.71 |
Each gene methylation level was 40-dCt(qMSP) of the gene.
All correlations were statistically significant (P< 0.0001).
To develop a multi-gene predictive model, we used a combinatorial analysis of methylation of 8 biomarkers. In this analysis, a model including 4 genes, MYO3A + CA10 + NKX6-2 + DBC1 or MYO3A + CA10 + NKX6-2 + SOX11 yielded an AUC of 0.939 (95% CI = 0.901 to 0.966, P <0.0001) for the set [tumor patients urine (TU) = 128 and controls urine (NU) = 110]. The models including 5 genes, MYO3A + CA10 + NKX6-2 + DBC1+ SOX11 or MYO3A + CA10 + NKX6-2 + DBC1 + PENK yielded the same AUC of 0.939 (95% CI = 0.901 to 0.966, P <0.0001).
The performances of single and combined qMSP markers for detection of bladder cancer in urine sediments are shown in Table 3. Comparison of ROC curve of the panel of combined markers is shown in Figure 3A. In the panel of 3 genes (MYO3A + CA10 + NKX6-2), if a urine sample has 2 or 3 genes methylation, the sensitivity was 86 % (95% CI = 78.7 to 91.4, P <0.0001) and specificity 93% (95% CI = 86.2 to 96.8, P <0.0001) for detection of bladder tumors and an AUC of 0.933 (CI = 0.894 to 0.962, P <0.0001). In the models of 4 gene panel (MYO3A + CA10 + NKX6-2 + DBC1 or MYO3A + CA10 + NKX6-2 + SOX11), if a urine sample has 3 or 4 genes methylation, the sensitivity was 81% (95% CI = 73.4 to 87.6, P <0.0001) and specificity 97% (95% CI = 92.2 to 99.4, P <0.0001). In the models of 5 gene panel (MYO3A + CA10 + NKX6-2 + DBC1 + SOX11 or MYO3A + CA10 + NKX6-2 + DBC1 + PENK), if a sample has 3 or more than 3 gene methylation, the sensitivity was 85% (95% CI = 77.8 to 90.8, P <0.0001) and specificity 95% (95% CI = 88.5 to 98.0, P <0.0001). Panels of 4 or 5 selected methylation markers had the same AUC of 0.939 and showed the best accuracy of detection of bladder cancer in urine sediments (Table 3).
Table 3.
Diagnostic information of single or combined qMSP markers for detection of bladder cancer in urine sediments from 128 bladder tumor patients and 110 control subjects
| Biomarkers (No. of combined biomarkers) |
Cutoff* | TP/FN | % Sensitivity |
TN/FP | % Specificity |
AUC |
|---|---|---|---|---|---|---|
| MYO3A | > 0 | 99/29 | 77.3 | 100/10 | 90.9 | 0.841 |
| CA10 | > 0 | 109/19 | 85.2 | 90/20 | 81.8 | 0.835 |
| NKX6-2 | > 0 | 113/15 | 88.3 | 84/26 | 76.4 | 0.823 |
| PENK | > 0 | 104/24 | 81.3 | 87/23 | 79.1 | 0.802 |
| SOX11 | > 0 | 90/38 | 70.3 | 98/12 | 89.1 | 0.797 |
| DBC1 | > 0 | 91/37 | 71.1 | 92/18 | 83.6 | 0.774 |
| NPTX2 | > 0 | 97/31 | 75.8 | 81/29 | 73.6 | 0.747 |
| A2BP1 | > 0 | 112/16 | 87.5 | 60/50 | 54.5 | 0.710 |
| MYO3A, NKX6-2 (2) | > 1 | 92/36 | 71.9 | 107/3 | 97.3 | 0.914 |
| CA10, NKX6-2 (2) | > 1 | 101/27 | 78.9 | 105/5 | 95.5 | 0.912 |
| MYO3A, CA10, NKX6-2 (3) | > 1 | 110/18 | 85.9 | 102/8 | 92.7 | 0.933 |
| MYO3A, CA10, NKX6-2, PENK (4) |
> 2 | 104/24 | 81.3 | 107/3 | 97.3 | 0.936 |
|
MYO3A, CA10, NKX6-2, SOX11
(4) |
> 2 | 104/24 | 81.3 | 107/3 | 97.3 | 0.939 ** |
|
MYO3A, CA10, NKX6-2, DBC1
(4) |
> 2 | 104/24 | 81.3 | 107/3 | 97.3 | 0.939 ** |
| MYO3A, CA10, NKX6-2, NPTX2 (4) |
> 2 | 100/28 | 78.1 | 105/5 | 95.5 | 0.934 |
| MYO3A, CA10, NKX6-2, PENK, SOX11 (5) |
> 2 | 107/21 | 83.6 | 103/7 | 93.6 | 0.935 |
|
MYO3A, CA10, NKX6-2, DBC1,
SOX11 (5) |
> 2 | 109/19 | 85.2 | 104/6 | 94.5 | 0.939 ** |
|
MYO3A, CA10, NKX6-2, DBC1,
PENK (5) |
> 2 | 109/19 | 85.2 | 104/6 | 94.5 | 0.939 ** |
| MYO3A, CA10, NKX6-2, PENK, SOX11, DBC1 (6) |
> 3 | 105/23 | 82.0 | 108/2 | 98.2 | 0.937 |
| MYO3A, CA10, NKX6-2, PENK, SOX11, DBC1, NPTX2 (7) |
> 3 | 106/22 | 82.8 | 104/6 | 94.5 | 0.936 |
| MYO3A, CA10, NKX6-2, PENK, SOX11, DBC1, A2BP (7) |
> 4 | 105/23 | 82.0 | 108/2 | 98.2 | 0.930 |
| MYO3A, CA10, NKX6-2, PENK, SOX11, DBC1, A2BP, NPTX2 (8) |
> 4 | 105/23 | 82.0 | 104/6 | 94.5 | 0.928 |
When the number of methylated biomarkers of the case passed cutoff value, we considered it as positive case.
The best combinations of biomarker with the highest area under the ROC curve (AUC) value were shown by bold character (P<0.0001). The other biomarker combinations did not improve the AUC.
Abbreviations: TP, true positive; FN, false negative; FP, false positive; TN, true negative.
Figure 3.
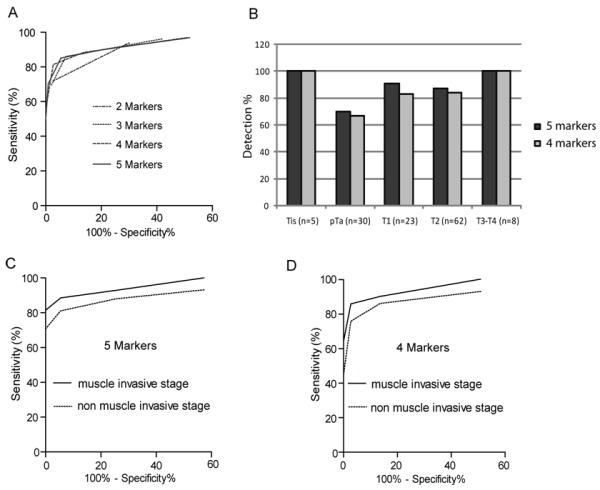
Receiver operating characteristics (ROC) for bladder cancer detection of the combined dataset (TU = 128 and NU = 110). A. ROC curves of the biomarkers sets (2-5 markers) that showed the highest AUC. Detailed information of the best combined markers was summarized in Table 3. B. Detection of bladder cancer in urine sediments by stages. A case was determined positive for methylations of ≥ 3 markers were hypermethylated. C. AUC curves for the 5 marker set in muscle invasive and non-muscle invasive cancers. D. AUC curves for the 4 marker set in muscle invasive and non-muscle invasive cancers.
Analyzing by stage of bladder cancer using the 5-gene panel, detection rate based on 3 gene methylation or greater was 5 of 5 (100 %) in Tis, 21 of 30 (70 %) in pTa, 21 of 23 (91 %) in T1, 54 of 62 (87 %) in T2 and 8 of 8 (100 %) in T3/T4 (Figure 3B). Thus, cancer could be detected at a sensitivity of 81 % and a specificity of 95 % and an AUC of 0.911 (95% CI = 0.857 to 0.949, P<0.0001) in non-muscle invasive stage bladder cancer (Tis-pTa-T1 stages) and a sensitivity of 90 % and a specificity of 95 % and an AUC of 0.962 (95% CI = 0.923 to 0.985, P<0.0001) in invasive stage bladder cancer (T2-T3-T4 stages) (Figure 3C). When classified by grade, detection rate by the 5-gene panel was 95 out of 111 (86 %) in grade 3, 8 out of 13 (61 %) in grade 2 and 1 out of 3 (33%) in grade 1. The 4-gene panel had a sensitivity/specificity of 76%/97% (AUC=0.913, P <0.0001) in Tis-pTa-T1 stages and 86%/97% (AUC=0.961, P <0.0001) in T2-T3-T4 stages. Analyzing the 2 control groups using the 5-gene panel, the benign urological group (n=71) had 3 false positive cases and the non urologic control group (n=39) had 3 false positive cases. There were no significant differences between the benign urological group and the normal control group. The detection rate of primary and recurrent cancers using the 5-gene panel was identical [75/88 (85%) and 34/40 (85%), respectively].
Discussion
Early detection of cancer can result in improved clinical outcomes. Early and non invasive detection methods for bladder cancer screening and diagnosis of recurrence will be useful in high-risk populations. As the bladder is the exclusive reserve organ for urine, urine sediments can provide a source of detection of exfoliated bladder tumor cells (35). These non-invasive tests include cytology, FISH analysis and detection of mutations in urine. Overall, the tests have reported sensitivities of 54% to 86% and specificities of 61% to 90% (10-12); thus, there is room for improvement, and development of novel biomarkers and combinations of different biomarkers may be most helpful for this purpose (13-18).
DNA hypermethylation occurs at a high frequency in both, non-muscle invasive and invasive bladder cancers. Previous studies suggested that methylation in urine could be a useful diagnostic test (21-25) but were limited by selection of markers based on methylation in other cancers, complicated algorithms, non quantitative methods and/or inappropriate controls (e.g. non-age matched). Here, starting from an unbiased DNA methylation analysis screen, we identify a panel of the least number of biomarkers that has high sensitivity and specificity with a simple algorithm for detection of bladder cancer. With a sensitivity of 85% and a specificity of 95%, the positive predictive value (PPV) of this test would be 52 % based on 5.9 % of prevalence in a high risk population that had history of smoking or symptoms of hematuria and dysuria (36). This is 1.2 to 8.7 times superior to what can be achieved by PSA testing (PPV=30-43%), mammography (PPV=9-19%) or fecal occult blood screening (PPV=6-11%) (37-44).
The panel of genes found by MCAM and validation by bisulfite pyrosequencing was methylated in 62-92 % of 26 tested primary bladder tumors and most of bladder cancer cell lines analyzed. These are higher methylation frequencies than genes previously tested for bladder cancer detection (19), which explains the improved performance of our assay with a smaller number of the biomarkers. Our 5 gene panel showed higher sensitivity with preserved specificity compared to a previous report (19) of a panel of 9 genes. One limitation of this analysis is the focus on promoter CpG islands. It is possible that other sequences such as exonic CpG islands may provide even more sensitive markers for cancer detection.
The final selected biomarker genes were PENK, MYO3A, SOX11, CA10, DBC1 and NKX6.2. The NKX6-2 gene is located at 10q26.3. Loss of heterozygosity (LOH) of chromosome 10q was previously linked to muscle-invasive TCC (45). LOH in the 10q26 region has also been observed in various malignant brain tumors (46). These results may point to NKX6-2 as a candidate tumor suppressor gene for brain and bladder tumors. In the case of SOX11, it was previously reported that silencing of the gene correlates with promoter methylation and regulates tumor growth in hematopoietic malignancies (47, 48). PENK is on chromosome 8q12.1 and was reported to be down-regulated in prostate cancer (49). It was previously found that PENK is frequently methylated in pancreatic cancer (50). The deleted in bladder cancer 1 (DBC1) gene is located at 9q33 and a candidate tumor suppressor gene within a region of frequent LOH in bladder cancer (51). Hypermethylation of DBC1 has been suggested as one of the earliest events in the development of TCC (52) MYO3A is a myosin family gene that is expressed primarily in the retina and cochlea, and is functionally involved in hearing. CA10 is carbonic anhydrase X, a gene primarily expressed in the brain.
While our study is promising for bladder cancer detection, there are limitations that need to be considered. The data need to be validated in larger studies, including a high risk population that has a history of heavy smoking or symptoms of hematuria, dysuria, urgent urination and frequent urinary tract infections. There also is a need to validate these markers in early stage, low-grade tumors because the present study did not test enough G1 grade tumors. The representativeness of our case patients and controls should be tested in further studies. Generally, most cancers have DNA hypermethylation although different genetic background and environmental exposures could affect the results. For example, Schistosoma-associated bladder cancers showed higher DNA methylation abnormalities than non- Schistosoma-associated bladder cancer (53). Therefore, other populations may need a different cutoff of positive/negative values for each methylation biomarker. The use of our markers to follow patients longitudinally post resection also needs to be tested. In non-muscle invasive tumors (pTa, Tis and pT1), our markers provided higher sensitivity/specificity (81%/95%) than most reported urine markers (10-12). Therefore, our novel DNA methylation biomarker panel could help the early detection of bladder cancer, although this needs to be clarified further in future studies. It would therefore be useful to directly compare accuracy of this assay with commercially available kits to detect bladder cancer in urine sediments.
One of the issues to consider in future studies is marker selection. A frequency based approach may yield false positives due to age-related methylation (54) or field effects (52, 55, 56). It might be productive to study whether progression markers in bladder cancer might prove better (i.e. more sensitive/specific) at detecting the invasive malignancies that pose a greater threat of ultimate metastasis and death. Conceivably, these progression markers might even be useful to predict prognosis and therapeutic response to chemotherapy and/or surgery.
In summary, we have identified a novel DNA methylation biomarker panel that will help the non-invasive detection with high accuracy. In addition, to screening, this non invasive early detection method may reduce the cystoscopy frequency. The panel of biomarker deserves validation in a large well-controlled prospectively collected sample set.
Supplementary Material
Acknowledgments
Financial support: Supported by NIH grants U01 CA 85078, 1R01 CA151489, and P50 CA 91846 (B. Czerniak). JPI is an American Cancer Society Clinical Research Professor supported by a generous gift from the F. M. Kirby Foundation. DNA sequencing at the MD Anderson Cancer Center is supported by Core Grant CA16672 from NIH.
Footnotes
The authors indicated no potential conflicts of interest.
Reference List
- (1).Jemal A, Siegel R, Ward E, et al. Cancer statistics, 2009. CA Cancer J Clin. 2009;59(4):225–49. doi: 10.3322/caac.20006. [DOI] [PubMed] [Google Scholar]
- (2).Babjuk M, Oosterlinck W, Sylvester R, et al. EAU guidelines on non-muscle-invasive urothelial carcinoma of the bladder. Eur Urol. 2008;54(2):303–14. doi: 10.1016/j.eururo.2008.04.051. [DOI] [PubMed] [Google Scholar]
- (3).Kurth KH, Denis L, Bouffioux C, et al. Factors affecting recurrence and progression in superficial bladder tumours. Eur J Cancer. 1995;31A(11):1840–6. doi: 10.1016/0959-8049(95)00287-s. [DOI] [PubMed] [Google Scholar]
- (4).Allard P, Bernard P, Fradet Y, Tetu B. The early clinical course of primary Ta and T1 bladder cancer: a proposed prognostic index. Br J Urol. 1998;81(5):692–8. doi: 10.1046/j.1464-410x.1998.00628.x. [DOI] [PubMed] [Google Scholar]
- (5).Sylvester RJ, van der Meijden AP, Oosterlinck W, et al. Predicting recurrence and progression in individual patients with stage Ta T1 bladder cancer using EORTC risk tables: a combined analysis of 2596 patients from seven EORTC trials. Eur Urol. 2006;49(3):466–77. doi: 10.1016/j.eururo.2005.12.031. [DOI] [PubMed] [Google Scholar]
- (6).Kriegmair M, Baumgartner R, Knuchel R, et al. Detection of early bladder cancer by 5-aminolevulinic acid induced porphyrin fluorescence. J Urol. 1996;155(1):105–9. [PubMed] [Google Scholar]
- (7).Denzinger S, Burger M, Walter B, et al. Clinically relevant reduction in risk of recurrence of superficial bladder cancer using 5-aminolevulinic acid-induced fluorescence diagnosis: 8-year results of prospective randomized study. Urology. 2007;69(4):675–9. doi: 10.1016/j.urology.2006.12.023. [DOI] [PubMed] [Google Scholar]
- (8).Zaak D, Kriegmair M, Stepp H, et al. Endoscopic detection of transitional cell carcinoma with 5-aminolevulinic acid: results of 1012 fluorescence endoscopies. Urology. 2001;57(4):690–4. doi: 10.1016/s0090-4295(00)01053-0. [DOI] [PubMed] [Google Scholar]
- (9).Papanicolaou GN, Marshall VF. Urine sediment smears as a diagnostic procedure in cancers of the urinary tract. Science. 1945;101(2629):519–20. doi: 10.1126/science.101.2629.519. [DOI] [PubMed] [Google Scholar]
- (10).Lotan Y, Roehrborn CG. Sensitivity and specificity of commonly available bladder tumor markers versus cytology: results of a comprehensive literature review and meta-analyses. Urology. 2003;61(1):109–18. doi: 10.1016/s0090-4295(02)02136-2. [DOI] [PubMed] [Google Scholar]
- (11).van Rhijn BW, van der Poel HG, van der Kwast TH. Urine markers for bladder cancer surveillance: a systematic review. Eur Urol. 2005;47(6):736–48. doi: 10.1016/j.eururo.2005.03.014. [DOI] [PubMed] [Google Scholar]
- (12).Hajdinjak T. UroVysion FISH test for detecting urothelial cancers: meta-analysis of diagnostic accuracy and comparison with urinary cytology testing. Urol Oncol. 2008;26(6):646–51. doi: 10.1016/j.urolonc.2007.06.002. [DOI] [PubMed] [Google Scholar]
- (13).Park HS, Park WS, Bondaruk J, et al. Quantitation of Aurora kinase A gene copy number in urine sediments and bladder cancer detection. J Natl Cancer Inst. 2008;100(19):1401–11. doi: 10.1093/jnci/djn304. [DOI] [PMC free article] [PubMed] [Google Scholar]
- (14).Vrooman OP, Witjes JA. Urinary markers in bladder cancer. Eur Urol. 2008;53(5):909–16. doi: 10.1016/j.eururo.2007.12.006. [DOI] [PubMed] [Google Scholar]
- (15).Lokeshwar VB, Habuchi T, Grossman HB, et al. Bladder tumor markers beyond cytology: International Consensus Panel on bladder tumor markers. Urology. 2005;66(6 Suppl 1):35–63. doi: 10.1016/j.urology.2005.08.064. [DOI] [PubMed] [Google Scholar]
- (16).Eissa S, Swellam M, Ali-Labib R, et al. Detection of telomerase in urine by 3 methods: evaluation of diagnostic accuracy for bladder cancer. J Urol. 2007;178(3 Pt 1):1068–72. doi: 10.1016/j.juro.2007.05.006. [DOI] [PubMed] [Google Scholar]
- (17).Eissa S, Ali-Labib R, Swellam M, et al. Noninvasive diagnosis of bladder cancer by detection of matrix metalloproteinases (MMP-2 and MMP-9) and their inhibitor (TIMP-2) in urine. Eur Urol. 2007;52(5):1388–96. doi: 10.1016/j.eururo.2007.04.006. [DOI] [PubMed] [Google Scholar]
- (18).Eissa S, Swellam M, Shehata H, et al. Expression of HYAL1 and survivin RNA as diagnostic molecular markers for bladder cancer. J Urol. 2010;183(2):493–8. doi: 10.1016/j.juro.2009.10.024. [DOI] [PubMed] [Google Scholar]
- (19).Jones PA, Baylin SB. The fundamental role of epigenetic events in cancer. Nat Rev Genet. 2002;3(6):415–28. doi: 10.1038/nrg816. [DOI] [PubMed] [Google Scholar]
- (20).Chung W, Kwabi-Addo B, Ittmann M, et al. Identification of novel tumor markers in prostate, colon and breast cancer by unbiased methylation profiling. PLoS One. 2008;3(4):e2079. doi: 10.1371/journal.pone.0002079. [DOI] [PMC free article] [PubMed] [Google Scholar]
- (21).Chan MW, Chan LW, Tang NL, et al. Hypermethylation of multiple genes in tumor tissues and voided urine in urinary bladder cancer patients. Clin Cancer Res. 2002;8(2):464–70. [PubMed] [Google Scholar]
- (22).Yu J, Zhu T, Wang Z, et al. A novel set of DNA methylation markers in urine sediments for sensitive/specific detection of bladder cancer. Clin Cancer Res. 2007;13(24):7296–304. doi: 10.1158/1078-0432.CCR-07-0861. [DOI] [PubMed] [Google Scholar]
- (23).Friedrich MG, Weisenberger DJ, Cheng JC, et al. Detection of methylated apoptosis-associated genes in urine sediments of bladder cancer patients. Clin Cancer Res. 2004;10(22):7457–65. doi: 10.1158/1078-0432.CCR-04-0930. [DOI] [PubMed] [Google Scholar]
- (24).Hoque MO, Begum S, Topaloglu O, et al. Quantitation of promoter methylation of multiple genes in urine DNA and bladder cancer detection. J Natl Cancer Inst. 2006;98(14):996–1004. doi: 10.1093/jnci/djj265. [DOI] [PubMed] [Google Scholar]
- (25).Dulaimi E, Uzzo RG, Greenberg RE, Al-Saleem T, Cairns P. Detection of bladder cancer in urine by a tumor suppressor gene hypermethylation panel. Clin Cancer Res. 2004;10(6):1887–93. doi: 10.1158/1078-0432.ccr-03-0127. [DOI] [PubMed] [Google Scholar]
- (26).Watanabe Y, Kim HS, Castoro RJ, et al. Sensitive and specific detection of early gastric cancer with DNA methylation analysis of gastric washes. Gastroenterology. 2009;136(7):2149–58. doi: 10.1053/j.gastro.2009.02.085. [DOI] [PMC free article] [PubMed] [Google Scholar]
- (27).Hoque MO, Begum S, Topaloglu O, et al. Quantitative detection of promoter hypermethylation of multiple genes in the tumor, urine, and serum DNA of patients with renal cancer. Cancer Res. 2004;64(15):5511–7. doi: 10.1158/0008-5472.CAN-04-0799. [DOI] [PubMed] [Google Scholar]
- (28).Belinsky SA, Nikula KJ, Palmisano WA, et al. Aberrant methylation of p16(INK4a) is an early event in lung cancer and a potential biomarker for early diagnosis. Proc Natl Acad Sci U S A. 1998;95(20):11891–6. doi: 10.1073/pnas.95.20.11891. [DOI] [PMC free article] [PubMed] [Google Scholar]
- (29).Belinsky SA. Gene-promoter hypermethylation as a biomarker in lung cancer. Nat Rev Cancer. 2004;4(9):707–17. doi: 10.1038/nrc1432. [DOI] [PubMed] [Google Scholar]
- (30).Chiong E, Dadbin A, Harris LD, Sabichi AL, Grossman HB. The use of short tandem repeat profiling to characterize human bladder cancer cell lines. J Urol. 2009;181(6):2737–48. doi: 10.1016/j.juro.2009.01.108. [DOI] [PMC free article] [PubMed] [Google Scholar]
- (31).Estecio MR, Yan PS, Ibrahim AE, et al. High-throughput methylation profiling by MCA coupled to CpG island microarray. Genome Res. 2007;17(10):1529–36. doi: 10.1101/gr.6417007. [DOI] [PMC free article] [PubMed] [Google Scholar]
- (32).Shen L, Kondo Y, Guo Y, et al. Genome-wide profiling of DNA methylation reveals a class of normally methylated CpG island promoters. PLoS Genet. 2007;3(10):2023–36. doi: 10.1371/journal.pgen.0030181. [DOI] [PMC free article] [PubMed] [Google Scholar]
- (33).Colella S, Shen L, Baggerly KA, Issa JP, Krahe R. Sensitive and quantitative universal Pyrosequencing methylation analysis of CpG sites. Biotechniques. 2003;35(1):146–50. doi: 10.2144/03351md01. [DOI] [PubMed] [Google Scholar]
- (34).Weisenberger DJ, Trinh BN, Campan M, et al. DNA methylation analysis by digital bisulfite genomic sequencing and digital MethyLight. Nucleic Acids Res. 2008;36(14):4689–98. doi: 10.1093/nar/gkn455. [DOI] [PMC free article] [PubMed] [Google Scholar]
- (35).Gazdar AF, Czerniak B. Filling the void: urinary markers for bladder cancer risk and diagnosis. J Natl Cancer Inst. 2001;93(6):413–5. doi: 10.1093/jnci/93.6.413. [DOI] [PubMed] [Google Scholar]
- (36).Grossman HB, Messing E, Soloway M, et al. Detection of bladder cancer using a point-of-care proteomic assay. JAMA. 2005;293(7):810–6. doi: 10.1001/jama.293.7.810. [DOI] [PubMed] [Google Scholar]
- (37).Hoffman RM, Gilliland FD, Adams-Cameron M, Hunt WC, Key CR. Prostate-specific antigen testing accuracy in community practice. BMC Fam Pract. 2002;3:19. doi: 10.1186/1471-2296-3-19. [DOI] [PMC free article] [PubMed] [Google Scholar]
- (38).Catalona WJ, Smith DS, Ratliff TL, et al. Measurement of prostate-specific antigen in serum as a screening test for prostate cancer. N Engl J Med. 1991;324(17):1156–61. doi: 10.1056/NEJM199104253241702. [DOI] [PubMed] [Google Scholar]
- (39).Richie JP, Catalona WJ, Ahmann FR, et al. Effect of patient age on early detection of prostate cancer with serum prostate-specific antigen and digital rectal examination. Urology. 1993;42(4):365–74. doi: 10.1016/0090-4295(93)90359-i. [DOI] [PubMed] [Google Scholar]
- (40).Brawer MK, Cheli CD, Neaman IE, et al. Complexed prostate specific antigen provides significant enhancement of specificity compared with total prostate specific antigen for detecting prostate cancer. J Urol. 2000;163(5):1476–80. [PubMed] [Google Scholar]
- (41).Brown ML, Houn F, Sickles EA, Kessler LG. Screening mammography in community practice: positive predictive value of abnormal findings and yield of follow-up diagnostic procedures. AJR Am J Roentgenol. 1995;165(6):1373–7. doi: 10.2214/ajr.165.6.7484568. [DOI] [PubMed] [Google Scholar]
- (42).Kerlikowske K, Grady D, Barclay J, et al. Positive predictive value of screening mammography by age and family history of breast cancer. JAMA. 1993;270(20):2444–50. [PubMed] [Google Scholar]
- (43).Venkatesan A, Chu P, Kerlikowske K, Sickles EA, Smith-Bindman R. Positive predictive value of specific mammographic findings according to reader and patient variables. Radiology. 2009;250(3):648–57. doi: 10.1148/radiol.2503080541. [DOI] [PMC free article] [PubMed] [Google Scholar]
- (44).Mandel JS, Church TR, Bond JH, et al. The effect of fecal occult-blood screening on the incidence of colorectal cancer. N Engl J Med. 2000;343(22):1603–7. doi: 10.1056/NEJM200011303432203. [DOI] [PubMed] [Google Scholar]
- (45).Cappellen D, Gil Diez de MS, Chopin D, Thiery JP, Radvanyi F. Frequent loss of heterozygosity on chromosome 10q in muscle-invasive transitional cell carcinomas of the bladder. Oncogene. 1997;14(25):3059–66. doi: 10.1038/sj.onc.1201154. [DOI] [PubMed] [Google Scholar]
- (46).Chernova OB, Hunyadi A, Malaj E, et al. A novel member of the WD-repeat gene family, WDR11, maps to the 10q26 region and is disrupted by a chromosome translocation in human glioblastoma cells. Oncogene. 2001;20(38):5378–92. doi: 10.1038/sj.onc.1204694. [DOI] [PubMed] [Google Scholar]
- (47).Gustavsson E, Sernbo S, Andersson E, et al. SOX11 expression correlates to promoter methylation and regulates tumor growth in hematopoietic malignancies. Mol Cancer. 2010;9(1):187. doi: 10.1186/1476-4598-9-187. [DOI] [PMC free article] [PubMed] [Google Scholar]
- (48).Tong WG, Wierda WG, Lin E, et al. Genome-wide DNA methylation profiling of chronic lymphocytic leukemia allows identification of epigenetically repressed molecular pathways with clinical impact. Epigenetics. 2010;5(6) doi: 10.4161/epi.5.6.12179. [DOI] [PMC free article] [PubMed] [Google Scholar]
- (49).Goo YA, Goodlett DR, Pascal LE, et al. Stromal mesenchyme cell genes of the human prostate and bladder. BMC Urol. 2005;5:17. doi: 10.1186/1471-2490-5-17. [DOI] [PMC free article] [PubMed] [Google Scholar]
- (50).Ueki T, Toyota M, Skinner H, et al. Identification and characterization of differentially methylated CpG islands in pancreatic carcinoma. Cancer Res. 2001;61(23):8540–6. [PubMed] [Google Scholar]
- (51).Habuchi T, Luscombe M, Elder PA, Knowles MA. Structure and methylation-based silencing of a gene (DBCCR1) within a candidate bladder cancer tumor suppressor region at 9q32-q33. Genomics. 1998;48(3):277–88. doi: 10.1006/geno.1997.5165. [DOI] [PubMed] [Google Scholar]
- (52).Habuchi T, Takahashi T, Kakinuma H, et al. Hypermethylation at 9q32-33 tumour suppressor region is age-related in normal urothelium and an early and frequent alteration in bladder cancer. Oncogene. 2001;20(4):531–7. doi: 10.1038/sj.onc.1204122. [DOI] [PubMed] [Google Scholar]
- (53).Gutierrez MI, Siraj AK, Khaled H, et al. CpG island methylation in Schistosoma- and non-Schistosoma-associated bladder cancer. Mod Pathol. 2004;17(10):1268–74. doi: 10.1038/modpathol.3800177. [DOI] [PubMed] [Google Scholar]
- (54).Issa JP, Ottaviano YL, Celano P, et al. Methylation of the oestrogen receptor CpG island links ageing and neoplasia in human colon. Nat Genet. 1994;7(4):536–40. doi: 10.1038/ng0894-536. [DOI] [PubMed] [Google Scholar]
- (55).Wolff EM, Chihara Y, Pan F, et al. Unique DNA methylation patterns distinguish noninvasive and invasive urothelial cancers and establish an epigenetic field defect in premalignant tissue. Cancer Res. 2010;70(20):8169–78. doi: 10.1158/0008-5472.CAN-10-1335. [DOI] [PMC free article] [PubMed] [Google Scholar]
- (56).Shen L, Kondo Y, Rosner GL, et al. MGMT promoter methylation and field defect in sporadic colorectal cancer. J Natl Cancer Inst. 2005;97(18):1330–8. doi: 10.1093/jnci/dji275. [DOI] [PubMed] [Google Scholar]
Associated Data
This section collects any data citations, data availability statements, or supplementary materials included in this article.