

Abstract
Background
Assessing the volume of mammographic density might more accurately reflect the amount of breast volume at risk of malignant transformation and provide a stronger indication of risk of breast cancer than methods based on qualitative scores or dense breast area.
Methods
We prospectively collected mammograms for women undergoing screening mammography. We determined the diagnosis of subsequent invasive or ductal carcinoma in situ (DCIS) for 275 cases, selected 825 controls matched for age, ethnicity, and mammography system, and assessed three measures of breast density: percent dense area, fibroglandular volume, and percent fibroglandular volume.
Results
After adjustment for familial breast cancer history, body mass index, history of breast biopsy, and age at first live birth, the odds ratios for breast cancer risk in the highest versus lowest measurement quintiles were 2.5 (95% CI: 1.5, 4.3) for percent dense area, 2.9 (95% CI: 1.7, 4.9) for fibroglandular volume, and 4.1 (95% CI: 2.3, 7.2) for percent fibroglandular volume. Net reclassification indexes for density measures plus risk factors versus risk factors alone were 9.6% (P=0.07) for percent dense area, 21.1% (P=0.0001) for fibroglandular volume, and 14.8% (P=0.004) for percent fibroglandular volume. Fibroglandular volume improved the categorical risk classification of 1 in 5 women for both women with and without breast cancer.
Conclusion
Volumetric measures of breast density are more accurate predictors of breast cancer risk than risk factors alone and than percent dense area.
Impact
Risk models including dense fibroglandular volume may more accurately predict breast cancer risk than current risk models.
INTRODUCTION
Breast density has been recognized as a risk factor for breast cancer for over 30 years but there is neither a single definition of breast density nor quantitative measurement method used in clinical practice. Wolfe’s classification and BI-RADS breast density score are both qualitative categorical estimates. Ideally, the best definition and best method for measuring breast density would have the strongest association with risk of breast cancer. Risk estimates from various methods for assessing breast density vary substantially depending on the study population, technical features, reproducibility of the method, and reporting method. Wolfe first reported that there was a 22-fold increase in risk between lowest density category, N1 (normal for age, breast almost completely made of fat with a few fibrous connective tissue strands), and highest risk category, DY (extremely dense parenchyma which usually denotes connective tissue hyperplasia) (1) using a 5-year time period and a population of 5284 women. The Breast Imaging Reporting and Data System (BI-RADS) provides a 4-category ranking of the amount of mammographically dense (white in image) relative to the total projected breast area and is correlated with a 3 to 4-fold subsequent risk of breast cancer when comparing lowest to highest risk categories (2). Percent dense area, defined as the ratio of the projected area of dense breast tissue divided by area of the entire breast, is a computerized method that has been extensively used in clinical studies using digitized film mammograms. Percent dense area also provides an absolute measure of dense area, which has been shown to be a strong predictor of breast cancer risk (3-8). In a prospective study, Boyd et al. reported a 4-fold two-year relative risk of breast cancer between women with the highest and lowest over six categories of percent dense area (9). In a meta-analysis of 42 studies and aggregate data of more than 14,000 women with breast cancer (cases) and 26,000 women without breast cancer (controls), McCormack et al. (10) showed percent dense area was more strongly associated with breast cancer than BI-RADS categories. However, BI-RADS is more widely used in clinical practice because it is easier to determine and report.
Both BI-RADS and percent dense area have several limitations. They are two-dimensional estimations that impose distinct borders between dense and non-dense (fat) regions. They may vary as a function of the compression forced used when performing mammography, and they rely on skilled readers to manually determine dense and nondense areas. In addition, two-dimensional methods are not sensitive to breast thickness and may underestimate the true amount of fibroglandular tissue for large breasted women.
If increased risk of breast cancer associated with high ‘mammographic density’ reflects a greater amount of cellular and interstitial tissues, then measures of dense mammographic volume should more accurately classify risk than measures of dense mammographic area. We prospectively collected film mammograms with calibration phantoms for assessment of percent dense area and accurate estimation of the volumes of dense tissue and the whole breast and examined the association of these measures with incident breast cancer. The purpose of our study was to determine whether percent dense area, absolute fibroglandular volume, or percent fibroglandular volume is most accurate predictor of breast cancer risk.
METHODS
Study population
We included women aged 18 years or older undergoing screening mammography between January 7, 2004, and April 8, 2006 at the California Pacific Medical Center Breast Health Center, a participant in the San Francisco Mammography Registry (11). As part of routine clinical care, film mammograms were digitized with the Image Checker computer aided diagnostic tool (R2, Inc., Sunnyvale, CA). A calibration phantom that has been described elsewhere (12) was imaged in the unused corner of all screening film mammograms. We excluded women who either did not have a phantom present in the film mammogram, a film mammogram was not digitized, or had poor placement of the calibration phantom. We also excluded women who had prior diagnosis of breast cancer, breast augmentation, reduction, reconstruction, or mastectomy. The study was approved by the University of California at San Francisco Institutional Review Boards for consenting processes, enrollment of participants, and ongoing data linkages for research purposes and has a Federal Certificate of Confidentiality that protect the identities of research subjects.
Cases and controls
Cases were women with invasive breast cancer or ductal carcinoma in situ, who had a screening examination a year or more prior to their breast cancer diagnosis. Three women without breast cancer (control subjects) were randomly selected for each case and matched by age, ethnicity, and mammography system (see definition below). Examinations for controls were selected to have occurred within one year of case screening examinations. Breast cancers were identified annually linking women in the SFMR to the California Cancer Registry, which consists of the Northern and Southern California Surveillance Epidemiology and End Results (SEER) programs that collect population-based cancer data.
Risk Factor Questionnaire
Demographic and breast health history information were obtained on a self-administered questionnaire at the time of screening mammography that included questions about race/ethnicity, family history of breast cancer, menopausal status, age at first live birth, current postmenopausal hormone therapy (HT) use, height and weight and history of breast biopsy (13).
We categorized women as non-Hispanic White, non-Hispanic black, Hispanic, Asian/Native Hawaiian/Pacific Islander, Native American/Native Alaskan or other/mixed race. Women were considered to have a family history of breast cancer if they reported having at least one first-degree relative (mother, sister, or daughter) with breast cancer. “Current HT users” were those who reported using prescription HT at the time of a screening examination. Postmenopausal women were defined as those with both ovaries removed, reported their periods had stopped naturally, currently using postmenopausal HT, or age 55 or older. Self-reported height and weight were used to calculate body mass index (BMI) by dividing weight in kilograms by height in meters squared (kg/m2). Age at first live birth was dichotomized into those whose first live birth was before age 30 years versus those whose first live birth was at age 30 years or older or nulliparous. This is based on the previous observations that a woman who has her first child around age 30 has approximately the same lifetime risk of developing breast cancer as a woman who has never given birth (14). History of breast biopsy was dichotomized as either previous or no previous breast biopsies.
Breast Density Measurements
Screening film mammograms were acquired on seven film mammography systems, either GE Healthcare DMR (GE Healthcare, Madison, WI) or Lorad M-IV (Hologic, Inc. Bedford, Ma). The mammograms consisted of Kodak MIN-R 2000 Film and MIN-R 2190 screen combination. As is typical for screening mammograms, the X-ray technique was set to “autocontrast” and each breast was compressed to the maximum pressure the patient could tolerate. Craniocaudal (CC) film mammograms were selected to calculate all density measures after being digitized to 16-bit resolution and 169-μm pixel sizes using an R2 ImageChecker digitizers (Hologic, Inc. Sunnyvale, CA). All density measures reported here were averages of left and right breasts.
Percent dense area was quantified using custom software comparable to that described by Byng (15). The software automatically detects and delineates the skin edge to define the total breast area. An expert reader defines the dense tissue area by moving a histogram threshold slider such that all pixels with values above the slider were labeled as dense. The ratio of the dense pixels to the total breast pixels times 100 was defined as percent dense area. One expert reader read all films and was trained against a local radiologist (16) and then underwent additional training at the University of Toronto by Drs. Yaffe and Boyd using a similar software tool (Cumulus) as our custom software to measure percent dense area. To test for accuracy, the reader reread 100 films previously read by a reader at the Mayo clinic using the Cumulus software (9) and having similar training. Their inter-reader intraclass correlation was 0.94.
Fibroglandular volume and percent fibroglandular volume were defined using a fully-automated technique called single-X-ray absorptiometry (SXA). A complete description of the method is found elsewhere (12). Briefly, the breast is modeled as a continuous mixture of two materials, fat and fibroglandular tissue. Percent fibroglandular volume is found for each pixel volume by interpolating image pixel grey-scale value between the phantom grey-scales values corresponding to 100% adipose and 80% fibroglandular volume at the same tissue thickness. Breast compression thickness was accurately determined, even in the presence of tilt of the compression surfaces, by the unique nature of the compressible phantom. Using the raw unprocessed images, the breast area is identified through an automated multistep algorithm that first segments between breast/non-breast regions using an automatically chosen threshold and then models the breast edge using polynomial fit. Each image in the case-control set was manually reviewed to remove potential error sources such as failure of the automated breast/non-breast segmentation routine and image artifacts. The reproducibility of the percent dense volume measured using SXA is better than 2.5%. The SXA method was used on all clinical screening mammograms during the study period, was easy to install, and did not require modifications to the clinical screening protocol.
An additional quality control phantom was scanned weekly on each mammography system to monitor calibration stability. The quality control phantom was custom designed and consisted of seven 4-cm thick regions with percent fibroglandular volume densities that ranged from 0 to 100%. No calibration changes were observed during the study period.
Statistical analysis
All statistical analyses were performed using SAS Version 9.2 (SAS Institute, Cary, North Carolina) and Stata Version 11 (Stata Corp, College Station, Texas). Normalized histograms of the case and control groups were generated to help visualize the distributions for percent dense area, percent fibroglandular volume, and fibroglandular volume. Baseline clinical and demographic characteristics of the cases and controls were compared by t-test or the Mann- Whitney U test for continuous variables and Chi-square test for categorical data. Conditional logistic regression was used to estimate the association between breast density and risk of breast cancer to take account of the matched study design. Breast density measurements were categorized into quintiles based on their distributions among control subjects. Crude odds ratios (conditional logistic model without adjustment for confounding variables) and corresponding adjusted odds ratios (adjusted for family history of breast cancer, BMI, history of breast biopsy, and age at first live birth) were calculated respectively. To test for trends, models also were fit using quintile medians. All statistical tests were two-sided and P<0.05 were considered to be statistically significant. The density measurements were studied using a variety of other scaling factors including continuous variable, log transformed, quartile and cubic splines with adjustments for the other risk factors using the concordance index (c-index) (17 1996). The c-index is a measure of the ability of these models to separate women who developed breast cancer from those women who did not. The c-index can range in value from 0.5 (random chance) to 1 (women with breast cancer consistently had risk scores higher than those who remained disease free.)
Although the c-index is considered to be the standard metric to test models, new classification methods have been developed in the past 15 years. To determine whether adding breast density measures to risk factors alone improves risk classification for both cases and controls, we calculated Pencina’s net reclassification improvement (NRI) (18). NRI assesses the degree to which cases are reclassified by the more inclusive model into higher risk categories, and controls reclassified into lower risk categories. The risk categories are those used to guide decisions about clinical care. NRI for risk assessment for risk assessment for breast cancer reflects how effectively the new risk marker might help clinicians focus more intensive surveillance and primary prevention on the higher risk women, and avoid unnecessarily frequent screening for the lowest risk. In this study we used mutually-exclusive categories for breast cancer 5-year risk stratification centered around the 1.67% risk threshold used with the Gail model: low (<1%), average (1% to 1.66%), intermediate (1.67% to 2.49%), high (2.5%-3.99%), and very high ≥ 4% (19).
RESULTS
There were 48,477 women with screening visits during the study period. Of these, 45,120 women were eligible and 3,357 (6.9% of population) were excluded based on either opting out of the SFMR or having a history of one of the following: mastectomy, breast augmentation, reconstruction, reduction or breast cancer. Of the 45,120 eligible women, 26,787 had available digitized film mammograms. Mammograms were unavailable for a multitude of reasons including digitizer being out of service, communication errors between the digitizer and study workstation, and poor digitization quality. Of the 26,787 women with digitized film mammograms, 16,105 women had valid SXA measures on one craniocaudal examination. Reasons for not having a valid SXA measure included missing SXA phantom in the image and compressed breast thickness out of range (over 6.7 cm or below 2 cm.) To insure that no bias was associated with study exclusions of cases due to known age and ethnic/racial associations to cancer risk, we compared cases with a valid SXA measure to the cases without either a valid SXA measure or without a digitized mammogram. Our major concern was whether cases with available digital mammograms differ from cases without available digital mammograms since breast cancer occurs more frequently in certain age and ethnic/racial groups. We found that the study and non-study cases did not differ in terms of their demographic and clinical characteristics (P>0.10). After testing the representativeness of cases, controls were compared against the whole study population (regardless of the availability of SXA digital images) throughout the matching process and found not to be different than the study population.
Baseline and mammographic characteristics of participants are presented in Table 1. BMI was higher for the cases than controls by 0.9 kg/m2. Percent dense area and percent fibroglandular volume were negatively associated with BMI (R = -0.35 and -0.27 respectively). Fibroglandular volume was positively associated with BMI (R = 0.44). Both measures of fibroglandular volume and percent dense area were significantly higher for cases than controls. The largest fractional difference between cases and controls was for fibroglandular volume; mean fibroglandular volumes were 242cm3 for cases and 194cm3 for controls or 25% higher for cases than for controls. In Figure 1, percent dense area and the volumetric measures are plotted against each other. The percent dense area had a strong linear relationship to percent fibroglandular volume, R2 = 0.59, while fibroglandular volume had a weak linear relationship to percent dense area, R2 = 0.01. Relative frequency histograms of the cases and controls for fibroglandular volume, percent fibroglandular volume, and percent dense area are represented in Figure 2. The histograms demonstrate better separation for cases from controls with fibroglandular volume than percent dense area.
Table 1.
Baseline and mammographic characteristics of the participants*.
| Variable | Cases N= 275 ** Mean (SD) | Controls N= 825 Mean (SD) | P-value ‡ |
|---|---|---|---|
| Age (yrs) | 57.1 (11.3) | 57.0 (11.3) | 0.95* |
| BMI (kg/m2) | 25.0 (5.0) | 24.1 (4.0) | 0.004 |
| Percent dense area | 31.2 (16.5) | 27.3 (16.3) | < 10-3 |
| Percent fibroglandular volume | 48.6 (17.1) | 44.5 (17.0) | < 10-3 |
| Fibroglandular volume (ml) | 243 (136) | 194 (99.1) | < 10-4 |
| N (%) | N (%) | ||
| Age at 1st live birth | 0.042 | ||
| < 30 yrs | 92 (33.5) | 333 (40.4) | |
| None or >= 30yrs | 183 (66.5) | 492 (59.6) | |
| First degree relative with BC † | 0.003 | ||
| Yes | 65 (23.6) | 130 (15.8) | |
| No | 210 (76.4) | 695 (84.2) | |
| Menopause | 0.912 | ||
| Yes | 184 (66.9) | 555 (67.3) | |
| No | 91 (3.1) | 270 (32.7) | |
| Postmenopausal hormone therapy | 0.56 | ||
| Yes | 38 (15.3) | 107 (13.8) | |
| No | 211 (84.7) | 670 (86.2) | |
| Unknown | 26 | 48 | |
| Race | 0.99 | ||
| White | 174 (63.3) | 524 (63.5) | |
| Asian § | 75 (27.3) | 227 (27.5) | |
| Black | 7 (2.5) | 22 (2.7) | |
| Other | 19 (6.9) | 52 (6.3) | |
matched by age, race/ethnicity, and mammography system
The median time interval between the mammogram used for the breast density measures and the diagnosis of cancer was 2.3 years.
The P-value was calculated by Chi square for categorical variables and t test or Mann-Whitney U test for continuous variables when appropriate.
First-degree relative with breast cancer was defined as mother, sister, or daughter with breast cancer.
Chinese, Japanese, Vietnamese, Filipino, or other Asian
Figure 1.
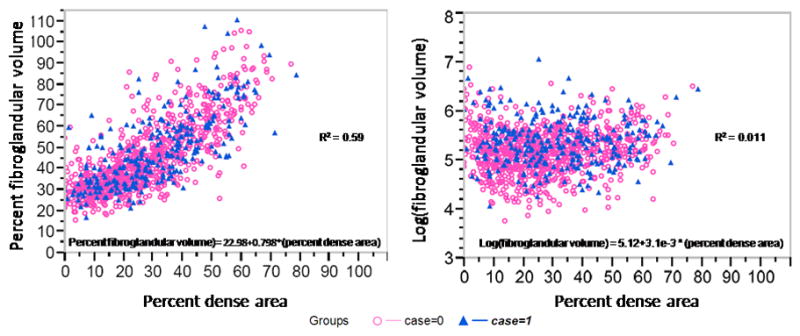
Percent fibroglandular volume and fibroglandular volume, plotted as the log value, compared to percent dense area. Although percent fibroglandular volume was highly correlated to percent dense area, the log(fibroglandular volume) weakly correlated.
Figure 2.
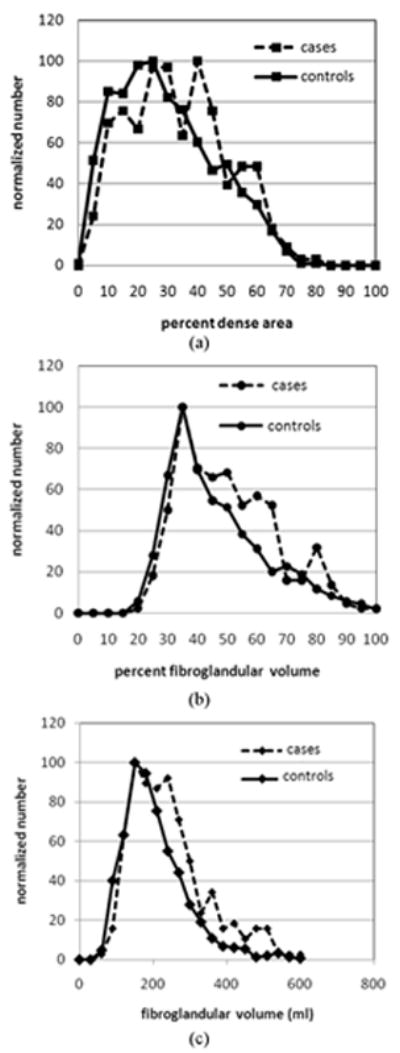
Breast density histograms for the cases and controls: (a) percent dense area, (b) percent fibroglandular volume, (c) fibroglandular volume.
Table 1 shows the univariate determinants of risk known to be associated with breast cancer. Older age at 1st live birth or nulliparity and having a first degree relative with breast cancer was more common in cases than controls (P-value < 0.05).
All three breast density measurements were significantly positively associated with risk of breast cancer (P-value for trends <0.0001 for all three measurements). Quintile odds ratios are found in Table 2. In adjusted models, the odds ratios for breast cancer in the highest versus lowest quintiles 2.5 (1.5-4.3), 4.1 (2.3-7.2), and 2.9 (1.7-4.9) for percent dense area, fibroglandular volume, and percent fibroglandular volume. Adjustment for BMI strengthened the associations of percent dense area and percent fibroglandular volume with risk of breast cancer, but lessened the association of fibroglandular volume with risk of breast cancer.
Table 2.
Odds ratios (95% confidence intervals) of breast cancer across quintile categories.
| Measures | Cases/controls | OR † (95% CI) | ||||
|---|---|---|---|---|---|---|
| Q1 | Q2 | Q3 | Q4 | Q5 | ||
| Percent fibroglandular volume | 0-30.4 | 30.5 – 36.4 | 36.5 – 45.2 | 45.3 – 58.3 | 53.4+ | |
| Basic model § | 275/825 | 1.0 (referent) | 1.82 (1.09, 3.03) | 1.97 (1.18, 3.29) | 2.58 (1.54, 4.35) | 2.88 (1.72, 4.84) |
| Full model * | 275/825 | 1.0 (referent) | 2.14 (1.26, 3.63) | 2.28 (1.33, 3.89) | 3.18 (1.83, 5.51) | 4.08 (2.32, 7.15) |
| Log fibroglandular volume (ml) | 0-122.3 | 122.4 – 157.1 | 157.2 – 191.9 | 192.0 – 249.8 | 249.9+ | |
| Basic model § | 275/825 | 1.0 (referent) | 1.60 (0.95, 2.70) | 1.47 (0.86, 2.52) | 2.35 (1.42, 3.90) | 3.57 (2.17, 5.88) |
| Full model * | 275/825 | 1.0 (referent) | 1.52 (0.89, 2.60) | 1.30 (0.75, 2.25) | 2.03 (1.20, 3.41) | 2.91 (1.71, 4.94) |
| Percent dense area | 0-12.3 | 12.4 – 21.6 | 21.7 – 29.7 | 29.8 – 42.1 | 42.2+ | |
| Basic model § | 275/825 | 1.0 (referent) | 1.03 (0.64, 1.66) | 1.34 (0.84, 2.12) | 1.75 (1.11, 2.77) | 1.83 (1.14, 2.94) |
| Full model * | 275/825 | 1.0 (referent) | 1.20 (0.73, 1.98) | 1.60 (0.98, 2.61) | 2.06 (1.27, 3.36) | 2.53 (1.51, 4.25) |
The odds ratio for each quintile relative to the lowest quintile.
Basic models were adjusted for matching factors (age, ethnicity, and mammography system).
The full models were further adjusted for BMI, age at first birth, history of benign breast biopsy, and family history of breast cancer.
The c-index for risk factors alone (no breast density measure) was 0.609. A variety of modeling schemes were investigated as listed in the statistics section to include breast density. Each model improved the c-index from 0.609 to between 0.638 (percent fibroglandular volume as a continuous variable) and 0.652 (fibroglandular volume as cubic splines). Although all models that included density of some form were significantly different than the model using risk factors alone (P-values > 0.01), none of the c-index values were statistically different from one another. The c-indexes for the fully-adjusted models shown in Table 2 are 0.642 (percent dense area), 0.646 (fibroglandular volume), and 0.645 (percent fibroglandular volume). Interestingly, adding log percent dense area (as a continuous variable) to the fully adjusted model with log fibroglandular volume (as a continuous variable) modestly but significantly increased the c-index from 0.651 to 0.667 (P-value = 0.031).
Net reclassification tables are shown comparing risk classifications based on risk factors alone compared to classifications also using percent dense area (Table 3), log fibroglandular volume (Table 4), and percent fibroglandular volume (Table 5), and. The natural log of fibroglandular volume was used to normalize its distribution. In these comparisons, NRIs were significant and high for log fibroglandular volume (21.1%, 95% CI: 10.6%, 31.6%, P-value < 0.0001) and percent fibroglandular volume (14.8%, 95% CI: 4.8%, 24.7%, P-value = 0.0036). Interestingly, the model including risk factors and fibroglandular volume had significant reclassifications over risk factors alone for both the cases and controls while the model including percent fibroglandular volume reached significance for the cases only. The reclassification index for cases and controls, and the NRI for the risk factors and percent dense area all failed to reach statistical significance (NRI 9.6%, 95% CI: -0.7%, 19.9%, P-value = 0.062). There were also no statistically significant reclassifications when risk factors plus log fibroglandular volume was compared to risk factor plus log fibroglandular volume plus percent dense area (NRI 3.4%, 95% CI: -2.7%, 9.5%, P-value = 0.27).
Table 3.
Risk reclassification with and without including percent dense area in the model for women with and without cancer.
| Model with risk factors alone | Model with risk factors + percent dense area*** | |||||
|---|---|---|---|---|---|---|
| Frequency (%) | <1% | 1-1.66% | 1.67-2.49% | 2.5-3.99% | ≥ 4% | Total |
| Participants with Cancer* | ||||||
| <1% | 3 | 3 | 0 | 0 | 0 | 6 |
| 1-1.66% | 17 | 39 | 31 | 0 | 0 | 87 |
| 1.67-2.49% | 1 | 27 | 25 | 38 | 0 | 91 |
| 2.5-3.99% | 0 | 0 | 15 | 37 | 13 | 65 |
| ≥ 4% | 0 | 0 | 0 | 12 | 14 | 26 |
| Total | 21 | 69 | 71 | 87 | 27 | 275 |
| Non-case Participants** | ||||||
| <1% | 22 | 13 | 1 | 0 | 0 | 35 |
| 1-1.66% | 90 | 169 | 117 | 2 | 0 | 378 |
| 1.67-2.49% | 0 | 104 | 90 | 64 | 0 | 258 |
| 2.5-3.99% | 0 | 3 | 45 | 61 | 16 | 125 |
| >=4% | 0 | 0 | 1 | 9 | 19 | 29 |
| Total | 112 | 289 | 253 | 136 | 35 | 825 |
The case reclassification rate was 4.7% (P-value = 0.30).
The noncase reclassification rate was 4.8% (P-value = 0.063).
NRI as 9.6% (95% CI -0.72-19.9%, P-value = 0.068)
Table 4.
Risk reclassification with and without including the log of fibroglandular volume in the model for women with and without cancer.
| Model with risk factors alone | Model with risk factors + log(fibroglandular volume)*** | |||||
|---|---|---|---|---|---|---|
| Frequency (%) | <1% | 1-1.66% | 1.67-2.49% | 2.5-3.99% | ≥ 4% | Total |
| Participants with Cancer* | ||||||
| <1% | 3 | 2 | 1 | 0 | 0 | 6 |
| 1-1.66% | 20 | 36 | 27 | 4 | 0 | 87 |
| 1.67-2.49% | 0 | 25 | 32 | 31 | 3 | 91 |
| 2.5-3.99% | 0 | 2 | 16 | 21 | 26 | 65 |
| ≥ 4% | 0 | 0 | 1 | 5 | 20 | 26 |
| Total | 23 | 65 | 77 | 61 | 49 | 275 |
| Non-case Participants** | ||||||
| <1% | 25 | 7 | 3 | 0 | 0 | 35 |
| 1-1.66% | 113 | 171 | 76 | 18 | 0 | 378 |
| 1.67-2.49% | 1 | 112 | 88 | 53 | 4 | 258 |
| 2.5-3.99% | 0 | 3 | 45 | 51 | 26 | 125 |
| ≥ 4% | 0 | 0 | 0 | 12 | 17 | 29 |
| Total | 139 | 293 | 212 | 134 | 47 | 825 |
The case reclassification rate was 9.1% (P-value = 0.05).
The noncase reclassification rate was 12% (P-value ≤ 0.0001).
NRI was 21.1% (95% CI 10.6-31.6%, P-value = 0.0001)
Table 5.
Risk reclassification with and without including percent fibroglandular volume in the model for women with and without cancer.
| Model with risk factors alone | Model with risk factors + percent fibroglandular volume*** | |||||
|---|---|---|---|---|---|---|
| Frequency (%) | <1% | 1-1.66% | 1.67-2.49% | 2.5-3.99% | ≥ 4% | Total |
| Participants with Cancer* | ||||||
| <1% | 2 | 4 | 0 | 0 | 0 | 6 |
| 1-1.66% | 13 | 40 | 34 | 0 | 0 | 87 |
| 1.67-2.49% | 4 | 15 | 40 | 32 | 0 | 91 |
| 2.5-3.99% | 0 | 6 | 11 | 31 | 17 | 65 |
| ≥ 4% | 0 | 0 | 2 | 4 | 20 | 26 |
| Total | 19 | 65 | 87 | 67 | 37 | 275 |
| Non-case Participants** | ||||||
| <1% | 17 | 18 | 0 | 0 | 0 | 35 |
| 1-1.66% | 93 | 159 | 126 | 0 | 0 | 378 |
| 1.67-2.49% | 22 | 70 | 106 | 60 | 0 | 258 |
| 2.5-3.99% | 0 | 14 | 41 | 49 | 21 | 125 |
| ≥ 4% | 0 | 0 | 4 | 7 | 18 | 29 |
| Total | 132 | 261 | 277 | 116 | 39 | 825 |
The case reclassification rate was 11.6% (P-value = 0.0072).
The noncase reclassification rate was 3.2% (P-value = 0.23).
NRI was 14.8% (95% CI 4.8-24.7%, P-value = 0.0036)
DISCUSSION
Volumetric breast density has long been thought to hold the promise of stronger breast cancer risk prediction due to its accuracy in quantifying the true cellular composition of the breast. We found that volumetric breast density measured as either fibroglandular volume or percent fibroglandular volume was strongly associated with risk of breast cancer. Both statistical methods (c-index and NRI) used compare models that include breast density with clinical risk factors showed that either fibroglandular volume measure significantly improved the accuracy of risk assessment over risk factors alone. However, the c-index was not statistically different between models that included any measure of breast density.
Our study used a novel method for accurately measuring volumetric breast density, called SXA that derives fibroglandular volume and percent fibroglandular volume from a calibration phantom and screening single X-ray tube voltage images (12). The use of a reference sample in each mammogram minimized the assumptions made in calculating breast density related to changes in X-ray tube and film sensitivity and allowed automated determination of accurate and precise measures of mammographically dense volume. The use of an in-image phantom allows physically-calibrated cross-comparison over time and between different makes and models of mammography systems. Longitudinal cross-calibration is particularly important in studies that monitor changes in breast density resulting from treatment. In addition, all SXA measures for this study were performed in a fully automated mode while the percent dense area measures were made manually by a skilled reader. Thus, there are strong advantages of the SXA method in terms training/labor costs and pooling ability compared to percent dense area.
The odds ratios in our study are comparable to other studies for similar measures and categories. Barlow et al. reported a BI-RADS-4:BI-RADS-1 odds ratio of 3.93 for premenopausal and 3.15 for postmenopausal women (2). In the Barlow et al. paper, BI-RADS-1 contained 4.3% and 10.2% of the pre- and postmenopausal population, and BI-RADS-4 contained 14.4% and 5.3% respectively. Thus, by percentage of women in the highest and lowest density categories, BI-RADS compares more extreme spectrums of density than quintile analysis. Boyd et al. (9) reported an odds ratio of 6.1 between the least category of “no density” and the ≥ 75% dense area categories using a semiquantitative method (radiologist manual readings). As with BI-RADS, these categories contained fewer women at more extreme densities than quintile analysis with only 7% and 18% of the women respectively in those two extreme categories. Vachon et al. (20) reported an odds ratios of 2.7 between 4th and 1st quartiles for percent dense area with a 3-year median time before diagnosis. There are many other examples in the literature with values ranging from 3 to 6 fold increase in risk between the highest and lowest categories of density that vary depending on the method and median time before diagnosis. A meta-analysis of available studies (10) showed that the odds ratios were much stronger for percent dense area than for Wolfe grade or BI-RADS classification. Our odds ratios for percent dense area are similar to others that have reported on the strength of breast density as a risk factor.
The NRI method of comparing models is relatively new, but is useful to in showing how models that include fibroglandular volume measures may improve risk prediction. First, the risk estimate accuracy for women who did not develop breast cancer in the 5 years of the study was higher when absolute fibroglandular volume was included in the risk model than without. More accurate identification of women at low risk for breast cancer undergo less frequent screening mammograms. Models that included either absolute fibroglandular volume or percent fibroglandular volume were significantly more accurate in their risk assessment than risk factors alone among women who develop breast cancer. Women at high breast cancer risk may consider and benefit from more frequent breast imaging, genetic counseling, or chemoprevention. Thus, is it clear that more accurate risk models that include a volumetric breast density measure could lead to more women being offered and undergoing appropriate prevention measures.
There have been other methods proposed for measuring percent fibroglandular volume. The standard mammographic form (SMF version 2.2β, Siemens Molecular Imaging Limited) is a method used in film mammograms to quantify the volume of “interesting” dense tissue (21-22). In this case, density associated with the skin and adipose tissues are estimated and subtracted off from the percent fibroglandular volume. Aitken et al. (23) compared percent dense area to the SMF measure and found significant associations for percent dense area with a 2.19 (95% CI 1.28-3.72) interquartile relative risk, but no significant association to breast cancer for SMF. Hologic (Hologic, Inc., Bedford, MA) has marketed an adaptation of the SMF method for digital mammography called Quantra. However, it has yet to be reported if Quantra differs substantially from SMF regarding it risk association. Pawluczyk et al. (24) reported on a method for measure of volumetric breast density that relies on the precise description of the digital mammography system’s geometry, breast thickness, and x-ray characteristics to derive a volumetric breast density. No associations with risk have been reported for the Pawluczyk or other volumetric methods using either mammography (24-25), magnet resonance imaging (26-27), tomosynthesis (28), or ultrasound tomography (29). Thus, it is important to note that the results of this study may not be generalizable to all measures of fibroglandular volume since they vary in the way the dense volume is modeled (with or without skin, with or without total water, the quality control methods (with absolute phantom standards or relative standards), and the calibration standards (adipose tissue or fatty acid for 0 percent fibroglandular volume; parenchymal tissue or water for 100 percent fibroglandular volume.)
Fibroglandular volume and percent dense area may capture different variations in breast morphology related to cancer risk. Fibroglandular volume should directly capture risk related to increasing volumes of stromal tissue and is thereby expected to be positively associated with BMI. Percent dense area is weakly related to fibroglandular volume and may capture additional risk related to the distribution of stromal tissue in the breast. Whereas percent dense area assumes that dark areas of a mammogram are composed of lipid, SXA directly measures the density of areas that appear to be only fat. Adipose tissue contains water that contributes to density in the SXA calculations. As shown in Table 1, the percent fibroglandular volume was higher on average than percent dense area (44.5% versus 27.1% for controls). This is likely due to the fact that SXA estimates of density includes all lean tissue, including the density from water in the adipose tissue, whereas percent dense area does not. As shown in Figure 2, the lower limit of percent dense area is zero percent dense area but approximately 18% for percent fibroglandular volume because the fatty breast will still contain approximately 18% water.
Although the inclusion of adipose water in the fibroglandular compartment may limit dynamic range to some degree, the approach is less noisy than more complicated models that try to extract only parenchyma tissue since no approximations of skin thickness or hydration of the fat are used in the calculation of density. Free water in adipose tissue does vary for individuals and a constant value cannot be used for the general case. In magnetic resonance imaging studies measuring breast total water content versus either delineated fibroglandular volume or percent dense area, the adipose %water (at 0, zero percent dense area) was found to be 14% from Graham et al. (30) and 18% from Boyd et al. (31).
Our study has limitations. First 40% of the participants were excluded due to lack of phantom calibration that arose from technical issues regarding the position and construction of the phantom. These issues have since been resolved in later generation phantoms by placing the phantom on top rather than between compression paddles, and eliminating moving parts (32). Secondly, our results were based on digitized film data. A majority of systems in the US are now full-field digital mammography systems that have improved linearity and dynamic range. Thus these results should be reproducible in newer mammography systems to a similar if not improved accuracy. Studies using SXA on full-field digital mammography systems are ongoing. In addition, BI-RADS density scores were not available and comparisons to this standard clinical measure could not be made.
We conclude that fibroglandular volume and percent fibroglandular volume, estimated with the SXA method, are strong predictors of breast cancer, and more accurate predictors of breast cancer risk than percent dense area.
Acknowledgments
The authors are grateful for the assistance of the radiology technologists at the California Pacific Medical Center for their assistance in performing the protocol, and Alice LaRocca for managing the study. Funding for this study came from the California Pacific Medical Center, the DaCosta Foundation for Prevention of Breast Cancer, Lilly Pharmaceuticals, Roche, and the National Cancer Institute Grant no. U01 CA63740.
References
- 1.Wolfe JN. Risk for breast cancer development determined by mammogrpahic parenchymal pattern. Cancer. 1976;37:2486–92. doi: 10.1002/1097-0142(197605)37:5<2486::aid-cncr2820370542>3.0.co;2-8. [DOI] [PubMed] [Google Scholar]
- 2.Barlow WE, White E, Ballard-Barbash R, Vacek PM, Titus-Ernstoff L, Carney PA, et al. Prospective breast cancer risk prediction model for women undergoing screening mammography. J Natl Cancer Inst. 2006;98:1204–14. doi: 10.1093/jnci/djj331. [DOI] [PubMed] [Google Scholar]
- 3.Stone J, Ding J, Warren RM, Duffy SW. Predicting breast cancer risk using mammographic density measurements from both mammogram sides and views. Breast Cancer Res Treat. 2010;124:551–4. doi: 10.1007/s10549-010-0976-y. [DOI] [PubMed] [Google Scholar]
- 4.Maskarinec G, Pagano I, Chen Z, Nagata C, Gram IT. Ethnic and geographic differences in mammographic density and their association with breast cancer incidence. Breast Cancer Res Treat. 2007;104:47–56. doi: 10.1007/s10549-006-9387-5. [DOI] [PubMed] [Google Scholar]
- 5.Vachon CM, van Gils CH, Sellers TA, Ghosh K, Pruthi S, Brandt KR, et al. Mammographic density, breast cancer risk and risk prediction. Breast Cancer Res. 2007;9:217. doi: 10.1186/bcr1829. [DOI] [PMC free article] [PubMed] [Google Scholar]
- 6.Torres-Mejia G, De Stavola B, Allen DS, Perez-Gavilan JJ, Ferreira JM, Fentiman IS, et al. Mammographic features and subsequent risk of breast cancer: a comparison of qualitative and quantitative evaluations in the Guernsey prospective studies. Cancer Epidemiol Biomarkers Prev. 2005;14:1052–9. doi: 10.1158/1055-9965.EPI-04-0717. [DOI] [PubMed] [Google Scholar]
- 7.Nagata C, Matsubara T, Fujita H, Nagao Y, Shibuya C, Kashiki Y, et al. Mammographic density and the risk of breast cancer in Japanese women. Br J Cancer. 2005;92:2102–6. doi: 10.1038/sj.bjc.6602643. [DOI] [PMC free article] [PubMed] [Google Scholar]
- 8.Ursin G. Mammographic density as indicator of breast cancer risk. Tidsskr Nor Laegeforen. 2003;123:3373–6. [PubMed] [Google Scholar]
- 9.Boyd NF, Byng JW, Jong RA, Fishell EK, Little LE, Miller AB, et al. Quantitative classification of mammographic densities and breast cancer risk: results from the Canadian National Breast Screening Study. J Natl Cancer Inst. 1995;87:670–5. doi: 10.1093/jnci/87.9.670. [DOI] [PubMed] [Google Scholar]
- 10.McCormack VA, dos Santos Silva I. Breast density and parenchymal patterns as markers of breast cancer risk: a meta-analysis. Cancer Epidemiol Biomarkers Prev. 2006;15:1159–69. doi: 10.1158/1055-9965.EPI-06-0034. [DOI] [PubMed] [Google Scholar]
- 11.San Francisco Mammography Registry: A Research Resource. 11-1-2010 [cited 2011 2-4-2011]; Available from: http://mammography.ucsf.edu/SFMR/
- 12.Shepherd JA, Herve L, Landau J, Fan B, Kerlikowske K, Cummings SR. Novel use of single X-ray absorptiometry for measuring breast density. Technol Cancer Res Treat. 2005;4:173–82. doi: 10.1177/153303460500400206. [DOI] [PubMed] [Google Scholar]
- 13.Breast Health History Questionnaire. cited 2011 2-3-11; Available from: http://breastscreening.cancer.gov/data/questionnaires/ssq_sf_pat.pdf.
- 14.National Cancer Institute Factsheet. 2008 cited 02-02-11; Available from: http://www.cancer.gov/cancertopics/factsheet.
- 15.Byng JW, Boyd NF, Fishell E, Jong RA, Yaffe MJ. The quantitative analysis of mammographic densities. Phys Med Biol. 1994;39:1629–38. doi: 10.1088/0031-9155/39/10/008. [DOI] [PubMed] [Google Scholar]
- 16.Prevrhal S, Shepherd JA, Smith-Bindman R, Cummings SR, Kerlikowske K. Accuracy of mammographic breast density analysis: results of formal operator training. Cancer Epidemiol Biomarkers Prev. 2002;11:1389–93. [PubMed] [Google Scholar]
- 17.Harrell FE, Jr, Lee KL, Mark DB. Tutorial in Biostatistics Multivariable Prognostic Models: Issues in Developing Models, Evaluating Assuptions and Adequacy, and Measuring and Reducing Errors. Statistics in Medicine. 1996;15:361–87. doi: 10.1002/(SICI)1097-0258(19960229)15:4<361::AID-SIM168>3.0.CO;2-4. [DOI] [PubMed] [Google Scholar]
- 18.Pencina MJ, D’Agostino RB, Sr, D’Agostino RB, Jr, Vasan RS. Evaluating the added predictive ability of a new marker: from area under the ROC curve to reclassification and beyond. Stat Med. 2008;27:157–72. doi: 10.1002/sim.2929. discussion 207-12. [DOI] [PubMed] [Google Scholar]
- 19.Tice JA, Cummings SR, Smith-Bindman R, Ichikawa L, Barlow WE, Kerlikowske K. Using clinical factors and mammographic breast density to estimate breast cancer risk: development and validation of a new predictive model. Ann Intern Med. 2008;148:337–47. doi: 10.7326/0003-4819-148-5-200803040-00004. [DOI] [PMC free article] [PubMed] [Google Scholar]
- 20.Vachon CM, Brandt KR, Ghosh K, Scott CG, Maloney SD, Carston MJ, et al. Mammographic breast density as a general marker of breast cancer risk. Cancer Epidemiol Biomarkers Prev. 2007;16:43–9. doi: 10.1158/1055-9965.EPI-06-0738. [DOI] [PubMed] [Google Scholar]
- 21.Marias K, Behrenbruch C, Highnam R, Parbhoo S, Seifalian A, Brady M. A mammographic image analysis method to detect and measure changes in breast density. Eur J Radiol. 2004;52:276–82. doi: 10.1016/j.ejrad.2004.02.014. [DOI] [PubMed] [Google Scholar]
- 22.Kaufhold J, Thomas JA, Eberhard JW, Galbo CE, Trotter DE. A calibration approach to glandular tissue composition estimation in digital mammography. Med Phys. 2002;29:1867–80. doi: 10.1118/1.1493215. [DOI] [PubMed] [Google Scholar]
- 23.Aitken Z, McCormack VA, Highnam RP, Martin L, Gunasekara A, Melnichouk O, et al. Screen-film mammographic density and breast cancer risk: a comparison of the volumetric standard mammogram form and the interactive threshold measurement methods. Cancer Epidemiol Biomarkers Prev. 2010;19:418–28. doi: 10.1158/1055-9965.EPI-09-1059. [DOI] [PMC free article] [PubMed] [Google Scholar]
- 24.Pawluczyk O, Augustine BJ, Yaffe MJ, Rico D, Yang J, Mawdsley GE, et al. A volumetric method for estimation of breast density on digitized screen-film mammograms. Med Phys. 2003;30:352–64. doi: 10.1118/1.1539038. [DOI] [PubMed] [Google Scholar]
- 25.van Engeland S, Snoeren PR, Huisman H, Boetes C, Karssemeijer N. Volumetric breast density estimation from full-field digital mammograms. IEEE Trans Med Imaging. 2006;25:273–82. doi: 10.1109/TMI.2005.862741. [DOI] [PubMed] [Google Scholar]
- 26.Hartmann LC, Sellers TA, Schaid DJ, Nayfield S, Grant CS, Bjoraker JA, et al. Clinical options for women at high risk for breast cancer. Surg Clin North Am. 1999;79:1189–206. doi: 10.1016/s0039-6109(05)70068-2. [DOI] [PubMed] [Google Scholar]
- 27.Boston RC, Schnall MD, Englander SA, Landis JR, Moate PJ. Estimation of the content of fat and parenchyma in breast tissue using MRI T1 histograms and phantoms. Magn Reson Imaging. 2005;23:591–9. doi: 10.1016/j.mri.2005.02.006. [DOI] [PubMed] [Google Scholar]
- 28.Bakic PR, Carton AK, Kontos D, Zhang C, Troxel AB, Maidment AD. Breast percent density: estimation on digital mammograms and central tomosynthesis projections. Radiology. 2009;252:40–9. doi: 10.1148/radiol.2521081621. [DOI] [PMC free article] [PubMed] [Google Scholar]
- 29.Boyd NF, Martin LJ, Bronskill M, Yaffe MJ, Duric N, Minkin S. Breast tissue composition and susceptibility to breast cancer. J Natl Cancer Inst. 2010;102:1224–37. doi: 10.1093/jnci/djq239. [DOI] [PMC free article] [PubMed] [Google Scholar]
- 30.Graham SJ, Stanchev PL, Lloyd-Smith JO, Bronskill MJ, Plewes DB. Changes in fibroglandular volume and water content of breast tissue during the menstrual cycle observed by MR imaging at 1.5 T. J Magn Reson Imaging. 1995;5:695–701. doi: 10.1002/jmri.1880050613. [DOI] [PubMed] [Google Scholar]
- 31.Boyd N, Martin L, Chavez S, Gunasekara A, Salleh A, Melnichouk O, et al. Breast-tissue composition and other risk factors for breast cancer in young women: a cross-sectional study. Lancet Oncol. 2009;10:569–80. doi: 10.1016/S1470-2045(09)70078-6. [DOI] [PubMed] [Google Scholar]
- 32.Malkov S, Wang J, Kerlikowske K, Cummings SR, Shepherd JA. Single x-ray absorptiometry method for the quantitative mammographic measure of fibroglandular tissue volume. Med Phys. 2009;36:5525–36. doi: 10.1118/1.3253972. [DOI] [PMC free article] [PubMed] [Google Scholar]