

Abstract
Objective
To estimate racial disparities in PCOS phenotype between White and Black women with PCOS.
Design
Case/control study
Setting
Two academic medical centers
Patients
242 women off of confounding medications in otherwise good health
Interventions
Phenotyping during the follicular phase or anovulation after overnight fast in women.
Main outcome measures
Biometric, serum hormones, glycemic and metabolic parameters, and body composition by DEXA.
Results
We studied 77 White and 43 Black women with PCOS and 35 White and 87 Black controls. Black women with PCOS were very similar reproductively to White women with PCOS. Black women with PCOS had lower serum transaminases, higher HDL-C levels[mean difference (MD): 18.2; 95% CI: (14.3, 22.1) mg/dL], lower triglycerides(MD: -43.2 mg/dL; 95% CI: (-64.5, -21.9)), and enhanced insulinogenic index on the oral glucose tolerance test compared to White women with PCOS. Blacks with PCOS had higher bone mineral density(MD: 0.1 g/cm2; 95% CI: (0.1, 0.2)) and lower percent body fat on DXA (MD: -2.8%; 95% CI:(-5.1, - 0.5)), and overall a higher quality of life. While most of these findings disappeared when the differences with racially matched controls were compared, Black women with PCOS compared to Black controls had lower estradiol levels than White PCOS women compared to White controls(MD: -12.9 pg/mL; 95% CI: (-24.9, -0.8)), higher systolic blood pressure(MD: 9.1 mm Hg; 95% CI: (0.8, 17.4)), and lower fasting glucose levels(MD: -12.0 mg/dL; 95% CI: (-22.3, - 1.7)).
Conclusion
Racial disparities in PCOS phenotype are minor and mixed. Future studies should explore if race impacts on treatment effects.
Introduction
Polycystic ovary syndrome is a common endocrinopathy characterized by hyperandrogenic chronic anovulation, that consistently affects 5-8% of females in populations studied across the globe (1). Race has been shown to influence the PCOS phenotype (2, 3). African-Americans are the largest racial minority group in the United States and make up ∼15% of the population. In other endocrine based disorders, such as type 2 diabetes, African-Americans have been shown to present with more severe features, including increased obesity, dyslipidemia, hyperglycemia, and vascular disease (4). They also are more likely to experience fatal and non-fatal cardiovascular events related to diabetes (4).
Less is known about the influence of race on the PCOS phenotype. A population based prevalence study in Alabama showed no significant difference in the prevalence of PCOS between Blacks and Whites (5), and reported that there were no differences in the degree or distribution of female hirsutism (6). Several other studies have compared Black women with PCOS to White women with PCOS and reported baseline data on this population.(2, 7-9). These studies have not reproducibly upheld the hypothesis that Blacks with PCOS are more likely to have a more severe reproductive and metabolic phenotype than Whites with PCOS. These studies are limited by the absence of a normal control group without PCOS for comparison. We designed a case-control study of Black and White women, with and without PCOS, to estimate how race might affect the PCOS phenotype.
Materials and Methods
Subjects
The Institutional Review Boards of the Meharry Medical College and Penn State College of Medicine approved the study. Participants were enrolled between 2004-2007 and all gave written informed consent. Race was self-reported. We used the 1990 NIH/NICHD diagnostic criteria for polycystic ovary syndrome to identify subjects (10): chronic anovulation, defined as spontaneous intermenstrual periods of ≥45 days or a total of ≤8 menses per year, and hyperandrogenism defined as an elevated total testosterone(>50 ng/dL) or a free androgen index [ratio of testosterone/SHBG(100)] >1.5.(11) The women with PCOS were screened to participate in a randomized trial of lifestyle and metformin and only their baseline data were used in this case-control study. Our control group consisted of women with a history of regular, ovulatory menstrual cycles, 26-32 days from one period to the next, and in general good health. Control women were excluded if they were smokers, were currently involved in a weight loss program, or exercising more than 8 hours a week. These control women were screened as part of a larger 4 month clinical study of the menstrual cycle and only their baseline data were used in this case-control study. All subjects, both control women without PCOS and women with PCOS were in good general health and currently off of confounding medications (e.g. hormonal contraceptives, diabetic medications, etc.) at the period the study was conducted. We a priori designed these studies such that the Penn State site would predominantly recruit Whites into the study, and the Meharry site would predominantly recruit Blacks into the study, and our recruitment numbers reflected this design.
Study Procedures
Participants were studied after an overnight fast and in the early follicular phase, days 2-7 of the cycle or during an anovulatory period, with confirmation in all subjects by ultrasound exam and by measuring serum progesterone levels (< 3 ng/mL).
Physical Exam
Blood pressure, height, weight, waist and hip measurements were performed by clinical research staff as previously reported. (12) Hirsutism was assessed by trained study personnel using the modified Ferriman-Galwey score. (13) Facial lesion counts of open and closed comedones (noninflammatory lesions) were obtained from the forehead, left and right cheeks, nose, and chin by trained study personnel. (14)
Exercise Testing
Participants underwent a submaximal test of aerobic capacity to determine fitness levels.(15) This test involved riding a stationary bike for a total of 6-12 minutes while the heart rate was monitored with a polar heart rate monitor at regular intervals. The maximal oxygen consumption (VO2 max) was recorded.
DXA Scan (baseline and end of study)
Body composition was determined by dual energy x-ray absorptiometry (DXA) using a Hologic QDR-4500W system (Hologic Inc., Bedford, MA). Each participant underwent a total-body scan and dual hip scan using the fan-beam mode at baseline and at the completion of the study. Subregion analysis of visceral and central abdominal fat were estimated.(16)
Serum Reproductive Hormones
LH, FSH, DHEAS, and SHBG were determined on a moderate complexity automated random-access immunoassay analyzer (Immulite 1000; Siemens Medical Solutions Diagnostics, Los Angeles, CA) with a solid-phase washing process and a chemiluminescence detection system. Hormone kits were supplied by the same manufacturer and assayed according to the manufacturer's instructions. The kit consisted of a solid phase made up of a polystyrene bead enclosed within the Immulite test unit coated with a polyclonal rabbit antibody specific for each of the above mentioned hormones. The functional sensitivities for each assay: progesterone, 0.2 pg/ml with intra and inter assay coefficient of variations of 6.3% and 7.9%; LH, 0.1 mIU/ml, 3.9% and 7.2%; FSH, 0.1 mIU/ml, 3.4% and 8.9%, SHBG, 0.22 nM/l. 6.3% and 9.2% and DHEA-SO4, 2.0 μg/dl, 4.8 and 8.4%, respectively. Serum testosterone was measured using the coat-a-tube RIA method (Perkin Elmer, Webstar, TX). Testosterone was measured by RIA (17). The RIA method used an iodinated tracer and a testosterone specific antibody immobilized to the wall of a polypropylene tube. Duplicate samples were run in sequence according to the manufacturer's instructions. The assay sensitivity for testosterone was 0.14 ng/ml and the intra- and inter-assay CVs were 3.9 and 5.3%, respectively.
Serum Metabolic Hormones
A 75-g oral glucose tolerance test with glucose and insulin levels obtained at 0, 30, 60, 90, and 120 min post-challenge was performed after an overnight fast only in women with PCOS.(18) Similarly, liver and renal function tests were only obtained in women with PCOS. Fasting blood glucose (FBG), fasting insulin (FI), and lipids were determined as previously reported in all participants.(17) Homeostatic insulin resistance (HOMA-IR) was determined by the formula: [fasting insulin (μU/mL) × fasting glucose (mg/dL)] ÷ 405. Insulinogenic index (30 min) was defined by the formula [30 min insulin (μU/mL) − fasting insulin (μU/mL)] ÷ [30 min glucose (mg/dL) − fasting glucose (mg/dL)].
Ultrasound Scan
A transvaginal or transabdominal (in adolescents) ultrasound of the pelvis was performed.(17) Volume of the ovary was calculated using the formula for a prolate ellipsoid (length × height × width × (π/6)).(17)
PCOS quality of life survey (baseline and end of study)
The validated PCOS health related Quality of Life(HR-QOL) questionnaire includes five domains: emotional, body hair, infertility, weight, and menstrual problems(19). Each domain score is graded on a scale of 1 (poorest function) to 7 (optimal) with a change of 0.5 approximating the minimal important difference, the smallest change in score that women feel was important in their daily lives.
Data Analysis
We did not perform an a priori power analysis as we were examining a broad range of phenotypic characteristics. Our subject number reflects recruitment into our studies of normal women and women with PCOS. Continuous data are descriptively reported as model-based means and standard deviations (SD). Integrated (i.e., the area under the curve from time 0 to 120 minutes) glucose and insulin values were calculated from the oral glucose tolerance test per participant using the trapezoidal rule. Analysis of covariance models (ANCOVA) were fit to continuous outcomes with independent factors of PCOS status (PCOS case or non-PCOS control), race (Black or White), the interaction of PCOS status and race, and the covariate of participant age. Contrasts were constructed from the ANCOVA models, particularly from the interaction term, to assess differences between Black and White women with PCOS, between cases (women with PCOS) and controls (women without PCOS) within each racial group, and between Blacks and Whites with respect to the change between the cases and control groups within each racial group, i.e., the difference of the differences. The effect sizes from the ANCOVA models are reported as mean differences (MD) with 95% confidence intervals (CI). ANCOVA is an extension of ANOVA that allows for the possible effects of covariates, such as age, on the response variable in addition to the effects of the factor of interest. All hypothesis tests were two-sided and p-values less than 0.05 were considered significant. All analyses were performed using SAS, version 9.2 (SAS Institute, Inc, Cary, NC).
Results
Black PCOS vs. White PCOS
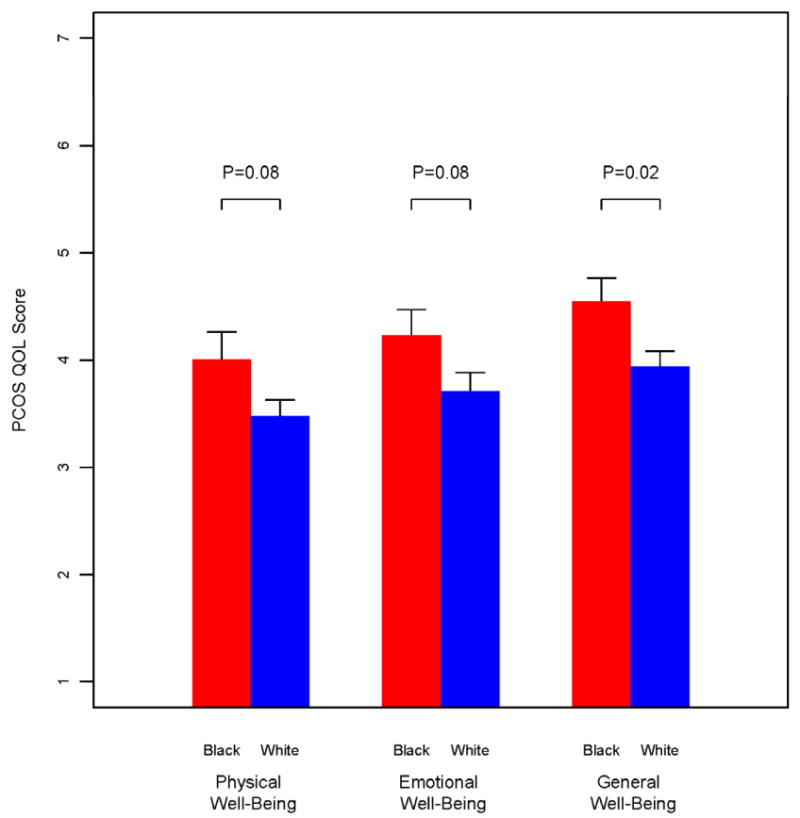
Black and White women with PCOS had similar distributions with respect to age and body mass index (BMI) (Table 1). There were no differences between racial groups in the domain scores of the quality of life questionnaire (Data not shown). However, Blacks with PCOS had a more positive outlook with respect to quality of life assessments, particularly their overall general well-being (P=0.02) than their Whites counterparts with PCOS (Figure 1). On exercise testing Blacks had greater VO2 max values compared to Whites (P = 0.002). There was a marginal difference in acne scores, but no difference in hirsutism scores, between Black and Whites with PCOS. There was no evidence of a difference in reproductive hormone levels between Blacks and Whites with PCOS, with the exception of SHBG levels tending to be slightly higher in Blacks.
Table 1. Biometric and Reproductive Differences between Black and White Women with PCOS (Model based-means adjusted for age).
| Black | White | Black - White | ||||
|---|---|---|---|---|---|---|
| N | Mean(SD) | N | Mean(SD) | Difference (95% CI) | P-value | |
| Biometric | ||||||
| Age (y) | 43 | 27.9 (5.0) | 77 | 26.0 (6.9) | 1.9 (-0.3,4.1) | 0.08 |
| Height (cm) | 43 | 164.1 (6.6) | 77 | 163.5 (5.9) | 0.6 (-1.8,3.0) | 0.64 |
| BMI (kg/m2) | 43 | 39.0 (9.3) | 77 | 37.7 (6.3) | 1.3 (-1.9,4.4) | 0.42 |
| Waist/Hip Ratio | 42 | 0.88 (0.08) | 77 | 0.88 (0.06) | -0.01 (-0.04,0.02) | 0.54 |
| Systolic Blood Pressure (mm Hg) | 43 | 118.1 (19.2) | 77 | 122.1 (13.6) | -4.0 (-10.6,2.6) | 0.23 |
| Diastolic Blood Pressure (mm Hg) | 43 | 76.1 (12.7) | 77 | 77.2 (9.6) | -1.1 (-5.5,3.3) | 0.62 |
| Ferriman-Gallwey Score | 43 | 17.6 (9.2) | 77 | 20.2 (8.0) | -2.6 (-5.9,0.7) | 0.12 |
| Total Acne Score | 21 | 2.6 (4.8) | 75 | 5.5 (8.2) | -2.9 (-5.7,-0.1) | 0.05 |
| Estimated VO2 max | 36 | 26.4 (5.4) | 74 | 23.1 (4.6) | 3.4 (1.3,5.5) | 0.002 |
| Reproductive Hormones | ||||||
| Testosterone (ng/dL) | 42 | 78.3 (41.7) | 77 | 80.5 (36.2) | -2.2 (-17.3,12.9) | 0.77 |
| SHBG (nmol/L) | 41 | 26.4 (14.6) | 74 | 22.0 (11.9) | 4.4 (-0.9,9.7) | 0.10 |
| Estradiol (pg/mL) | 41 | 33.8 (23.8) | 65 | 40.4 (32.0) | -6.6 (-17.3,4.2) | 0.23 |
| LH (mIU/mL) | 42 | 8.4 (4.4) | 74 | 9.4 (7.5) | -1.0 (-3.1,1.2) | 0.39 |
| FSH (mIU/mL) | 41 | 5.3 (1.6) | 74 | 5.1 (1.8) | 0.2 (-0.4,0.9) | 0.50 |
| Ultrasound Parameters | ||||||
| Left Ovarian Volume (cm3) | 39 | 10.2 (4.9) | 74 | 11.6 (5.7) | -1.4 (-3.5,0.6) | 0.16 |
| Right Ovarian Volume (cm3) | 39 | 13.1 (8.5) | 72 | 11.7 (6.3) | 1.4 (-1.7,4.5) | 0.38 |
| Max size of left and right follicle (mm) | 34 | 9.4 (6.1) | 70 | 8.5 (4.1) | 0.9 (-1.4,3.2) | 0.44 |
Figure 1.
Overall summary Scores from the PCOS Health Related Quality of Life Questionnaire (PCOSQ) in Black and White women with PCOS.
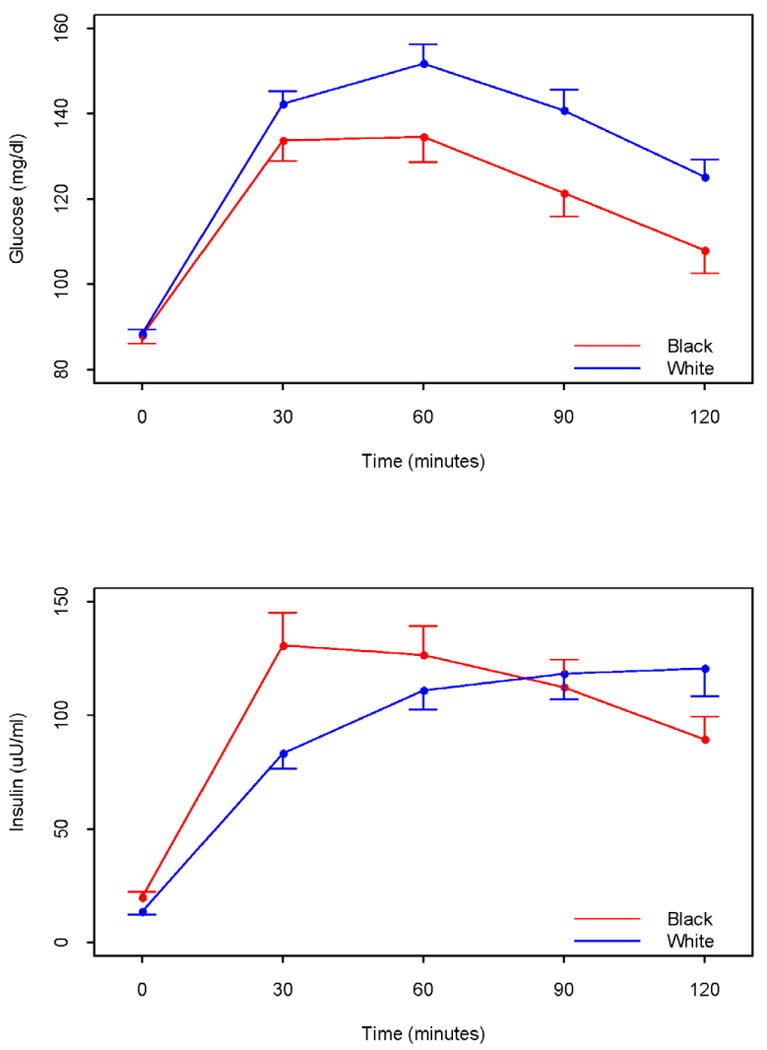
Blacks had lower serum hepatic transaminase and BUN levels, though the clinical difference is negligible (Table 2). The concentrations of high density lipoprotein-C and triglycerides were higher (P<0.001) and lower (P<0.001), respectively in Blacks than Whites. Interestingly, there were no differences in fasting glucose levels between the races, however, fasting insulin concentrations were higher (P = 0.01) among Blacks. Blacks also had higher measures of homeostatic insulin resistance, but improved sensitivity by integrated measure after oral glucose tolerance testing (Figure 2). This was accompanied by an increased insulinogenic index (30 min). Blacks had greater bone mineral content (P < 0.001) and density (P < 0.001), as well as lower percent body fat, than Whites (Table 2).
Table 2. Differences in metabolic parameters between Black and White Women with PCOS (Model based-means adjusted for age).
| Black | White | Black - White | ||||
|---|---|---|---|---|---|---|
| N | Mean(SD) | N | Mean(SD) | Difference (95% CI) | P-value | |
| Kidney and Liver Function | ||||||
| ALT (U/L) | 41 | 17.3 (7.3) | 77 | 25.1 (14.8) | -7.8 (-11.9,-3.7) | <.001 |
| AST (U/L) | 41 | 17.8 (5.1) | 77 | 21.4 (11.9) | -3.6 (-6.8,-0.5) | 0.03 |
| Total Bilirubin (mg/dL) | 41 | 0.45 (0.20) | 76 | 0.42 (0.18) | 0.03 (-0.04,0.11) | 0.42 |
| BUN (mg/dL) | 41 | 10.7 (2.4) | 77 | 11.9 (2.8) | -1.2 (-2.2,-0.2) | 0.02 |
| Serum Creatinine (mg/dL) | 41 | 0.84 (0.12) | 77 | 0.77 (0.21). | 0.07 (0.01,0.13) | 0.02 |
| Lipid Parameters | ||||||
| Cholesterol (mg/dL) | 42 | 181.1 (49.3) | 72 | 170.8 (35.8) | 10.3 (-6.9,27.5) | 0.24 |
| HDL-C (mg/dL) | 42 | 47.0 (10.2) | 72 | 28.9 (10.0) | 18.2 (14.3,22.1) | <.001 |
| LDL-C (mg/dL) | 42 | 116.9 (45.8) | 71 | 115.3 (30.2) | 1.6 (-14.1,17.3) | 0.84 |
| Triglycerides (mg/dL) | 42 | 87.5 (37.0) | 73 | 130.7 (77.9) | -43.2 (-64.5,-21.9) | <.001 |
| Glycemic Parameters | ||||||
| Fasting Glucose (mg/dL) | 40 | 87.3 (12.2) | 76 | 88.2 (8.2) | -0.9 (-5.2,3.3) | 0.67 |
| Fasting Insulin (μU/mL) | 41 | 20.3 (14.5) | 65 | 13.6 (10.0) | 6.6 (1.5,11.8) | 0.01 |
| HOMA Insulin Resistance | 38 | 4.3 (3.4) | 64 | 3.1 (2.4) | 1.3 (0.05,2.5) | 0.04 |
| Integrated Glucose OGTT | 39 | 14485 (3411) | 76 | 16326 (3350) | -1840 (-3173,-507) | 0.007 |
| Integrated Insulin OGTT | 39 | 12788 (7355) | 67 | 11314 (7192) | 1474 (-1453,4402) | 0.32 |
| Insulinogenic Index (30 minutes) | 36 | 2.7 (2.0) | 63 | 1.5 (1.3) | 1.2 (0.4,2.0) | 0.002 |
| Matsuda's Insulin Sensitivity Index (ISI) | 36 | 5.3 (6.3) | 64 | 4.6 (3.9) | 0.7 (-1.6,3.0) | 0.54 |
| DXA | ||||||
| Total Area (cm2) | 38 | 2025 (158) | 72 | 1979 (145) | 46 (-15,107) | 0.14 |
| Total Bone Mineral Content (g) | 38 | 2617 (344) | 72 | 2296 (276) | 321 (193,449) | <.001 |
| Total Bone Mineral Density (g/cm2) | 38 | 1.3 (0.1) | 72 | 1.2 (0.1) | 0.1 (0.1,0.2) | <.001 |
| Total Fat (g) | 38 | 39392 (13137) | 72 | 41710 (10371) | -2317 (-7199,2564) | 0.35 |
| Total Lean (g) | 38 | 57595 (9855) | 72 | 55359 (7230) | 2236 (-1360,5832) | 0.22 |
| Body Fat (%) | 38 | 39.6 (6.2) | 72 | 42.4 (4.9) | -2.8 (-5.1,-0.5) | 0.02 |
Figure 2.
Mean levels of glucose and insulin during a 2h oral glucose tolerance test in Black and White Women with PCOS. Integrated glucose levels (i.e., the area under the curve from time 0 to 120 minutes were significantly lower in Black women (P =0.007)
Black PCOS/Black Control Women vs. White PCOS/White Control Women
Our control group consisted of 87 Black participants and 35 White participants. We did not administer the PCOS HR-QOL questionnaire, nor did we perform renal and liver function testing or perform OGTTs in control women. As per study design and definitions of cases and controls, comparisons between women with PCOS and racially matched controls showed a marked difference among most of the expected variables (Supplemental Online Tables 1 and 2). Women with PCOS were significantly heavier and had higher blood pressure, higher testosterone levels, lower SHBG levels, higher LH levels and triglycerides, lower HDL-C levels, and more fat and lean mass as determined by DXA scan (Supplemental Online Tables 1 and 2).
However comparisons of the differences between cases and controls according to race revealed only a few significant differences between Blacks and Whites. Our data did indicate that Black women with PCOS tended to be older than Black controls, whereas White women with PCOS were comparable in age to White controls. Even after adjusting for this age difference, there were only subtle case-control differences in Black women compared to White women. The difference in systolic blood pressure between PCOS and controls was higher (P = 0.03) in Black women than White women, with a similar trend for diastolic blood pressure even though the difference was not statistically significant (Supplemental Online Table 1). Follicular phase levels of estradiol and fasting glucose levels were higher in White women with PCOS compared to controls, whereas Black women with PCOS and controls did not differ significantly in either estradiol or glucose levels. Hemoglobin levels were higher in Black women with PCOS compared to controls but similar between White women with PCOS and controls (Supplemental Online Table 2).
Discussion
We performed a unique case-control study in which we assessed differences between Black and White women with PCOS in common reproductive and metabolic abnormalities in PCOS, as well as comparison of the differences between them and racially matched controls without PCOS. We found that Black women with PCOS are very similar reproductively to White women with PCOS, but that metabolically there were many factors that were more favorable in Blacks including lipid levels, serum transaminases, estimated VO2 max, bone density, fat distribution and a higher perceived overall quality of life. However results were mixed in that some parameters were not favorable in Blacks with PCOS such as increased fasting insulin levels. When we further examined the differences between cases and controls to see if PCOS is more severe in Blacks or Whites compared to a racially matched reference group, we found that Black women with PCOS did show some reproductive differences. These included lower estradiol levels, and there were also metabolic differences such as higher systolic blood pressure and lower glucose levels. Overall, our results are reassuring, that race per se in Black and White women with PCOS does not significantly influence the phenotype.
Our study overall is convincing that the full phenotype of PCOS appears very similar in Blacks and Whites, and against expectation, perhaps more favorable in Blacks. This is in line with a recent case-control study that showed lower triglyceride and higher HDL-C levels in Blacks with PCOS (2). Some of our favorable findings such as the lower serum creatinine levels in Blacks may also be clinically insignificant. Other older studies suggest a worse phenotype in Blacks including a large randomized multicenter trial in women with PCOS, the Pregnancy in Polycystic Ovary Syndrome (PPCOS) trial. This trial noted that Black women at baseline tended to have a higher BMI and higher fasting glucose levels than Whites in the study (7). Similar findings of increased BMI and diabetes prevalence in Blacks compared to Whites were noted in a study of women with PCOS from Boston and Iceland (8). Within a large, community-based population of women with PCOS receiving health care in Northern California, Blacks were noted to have increased BMI and a higher prevalence of hypertension than Whites (9). Like the PPCOS trial (7), and unlike the other studies (2, 8, 9), we excluded diabetes in all participants and found no differences in BMI between Black and White women with PCOS. These aforementioned studies also lacked a normal racial control group unlike our study.
The strengths of the study include the rigid inclusion and exclusion criteria to define both cases with PCOS and controls without it, the racial stratification of both cases and controls, and the thorough and consistent phenotyping of all the subjects. Limitations of our study include potential disparities between the two sites, which could not be assessed due to the design of our study with one site recruiting mainly Whites and another mainly Blacks. We were also unable to match control subjects on the basis of race, or to match control women with normal cycles to women with PCOS on the basis of weight or age, although we adjusted for this in our analyses. This is a common difficulty in such trials given the high prevalence of obesity in the U.S. PCOS population. Because these were women participating in other clinical studies, they may not be representative of the larger population who may be less likely to participate in drawn out demanding clinical trials For example, women with PCOS who are metabolically challenged may prefer pills (as in PPCOS) to lifestyle changes (as in our study). Finally we may have found more disparity between races if we had chosen the broader Rotterdam criteria for PCOS, as there is definitely more heterogeneity between the larger phenotypic spectrum these criteria capture.(20)
We conclude that the racial disparities found in other conditions such as type 2 diabetes may not be as common in Black women with PCOS (and no diabetes), and they may also have, at least as young women, more favorable risk profiles for metabolic disease. This may ultimately be reassuring that PCOS diagnosed according to strict criteria may identify a comparable reproductive phenotype in women of different races. In the future, our findings suggests that Black and White women with PCOS could be pooled together for such baseline analyses, although further prospective studies should gauge the impact of race on treatment effects.
Acknowledgments
We wish to acknowledge the excellent coordination and oversight to this long term study provided by Barbara Dailey and Joy Vassel at the Meharry Medical College and Patsy Rawa at the Penn State College of Medicine, and the nursing staff of the GCRC at Penn State Hershey Medical Center. We wish to also acknowledge the contributions to the analyses of Christy Stetter in the Dept of Public Health Sciences at Penn State. Finally we are grateful to the women who choose to participate in our study.
Funding/Support: This work was supported by PHS U54 HD044315 The Meharry Medical College/Penn State Cooperative Reproductive Science Center and a GCRC grant MO1 RR 10732, and GCRC construction grant C06 RR016499 to Pennsylvania State University. The content is solely the responsibility of the authors and does not necessarily represent the official views of the NICHD or NIH.
Footnotes
Financial Disclosure: Allen Kunselman reports ownership of Merck stock. Richard Legro reports a paid lecture fee from Serono and consultant fees from ASRM. The other authors report no conflicts.
Author Contributions: All authors researched data, contributed to discussion, and reviewed/edited data.
Publisher's Disclaimer: This is a PDF file of an unedited manuscript that has been accepted for publication. As a service to our customers we are providing this early version of the manuscript. The manuscript will undergo copyediting, typesetting, and review of the resulting proof before it is published in its final citable form. Please note that during the production process errors may be discovered which could affect the content, and all legal disclaimers that apply to the journal pertain.
References
- 1.Azziz R, Carmina E, Dewailly D, Diamanti-Kandarakis E, Escobar-Morreale HF, Futterweit W, et al. The Androgen Excess and PCOS Society criteria for the polycystic ovary syndrome: the complete task force report. Fertil Steril. 2009;91:456–88. doi: 10.1016/j.fertnstert.2008.06.035. [DOI] [PubMed] [Google Scholar]
- 2.Koval KW, Setji TL, Reyes E, Brown AJ. Higher High-Density Lipoprotein Cholesterol in African-American Women with Polycystic Ovary Syndrome Compared with Caucasian Counterparts. J Clin Endocrinol Metab. 2010 doi: 10.1210/jc.2010-0074. [DOI] [PMC free article] [PubMed] [Google Scholar]
- 3.Coney P, Ladson G, Sweet S, Legro RS. Does polycystic ovary syndrome increase the disparity in metabolic syndrome and cardiovascular-related health for African-American women? Semin Reprod Med. 2008;26:35–8. doi: 10.1055/s-2007-992922. [DOI] [PubMed] [Google Scholar]
- 4.Lloyd-Jones D, Adams RJ, Brown TM, Carnethon M, Dai S, De Simone G, et al. Heart disease and stroke statistics--2010 update: a report from the American Heart Association. Circulation. 2010;121:e46–e215. doi: 10.1161/CIRCULATIONAHA.109.192667. [DOI] [PubMed] [Google Scholar]
- 5.Azziz R, Woods KS, Reyna R, Key TJ, Knochenhauer ES, Yildiz BO. The prevalence and features of the polycystic ovary syndrome in an unselected population. J Clin Endocrinol Metab. 2004;89:2745–9. doi: 10.1210/jc.2003-032046. [DOI] [PubMed] [Google Scholar]
- 6.Knochenhauer ES, Key TJ, Kahsar-Miller M, Waggoner W, Boots LR, Azziz R. Prevalence of the polycystic ovary syndrome in unselected black and white women of the southeastern United States: a prospective study. J Clin Endocrinol Metab. 1998;83:3078–82. doi: 10.1210/jcem.83.9.5090. [DOI] [PubMed] [Google Scholar]
- 7.Legro RS, Myers ER, Barnhart HX, Carson SA, Diamond MP, Carr BR, et al. The Pregnancy in Polycystic Ovary Syndrome study: baseline characteristics of the randomized cohort including racial effects. Fertil Steril. 2006;86:914–33. doi: 10.1016/j.fertnstert.2006.03.037. [DOI] [PubMed] [Google Scholar]
- 8.Welt CK, Arason G, Gudmundsson JA, Adams J, Palsdottir H, Gudlaugsdottir G, et al. Defining constant versus variable phenotypic features of women with polycystic ovary syndrome using different ethnic groups and populations. J Clin Endocrinol Metab. 2006;91:4361–8. doi: 10.1210/jc.2006-1191. [DOI] [PubMed] [Google Scholar]
- 9.Lo JC, Feigenbaum SL, Yang J, Pressman AR, Selby JV, Go AS. Epidemiology and adverse cardiovascular risk profile of diagnosed polycystic ovary syndrome. J Clin Endocrinol Metab. 2006;91:1357–63. doi: 10.1210/jc.2005-2430. [DOI] [PubMed] [Google Scholar]
- 10.Zawadski JK, Dunaif A. Diagnostic criteria for polycystic ovary syndrome; towards a rational approach. In: Dunaif A, Givens JR, Haseltine FP, Merriam GR, editors. Polycystic Ovary Syndrome. Boston: Blackwell Scientific; 1992. pp. 377–84. [Google Scholar]
- 11.Katcher HI, Kunselman AR, Dmitrovic R, Demers LM, Gnatuk CL, Kris-Etherton PM, et al. Comparison of hormonal and metabolic markers after a high-fat, Western meal versus a low-fat, high-fiber meal in women with polycystic ovary syndrome. Fertil Steril. 2009;91:1175–82. doi: 10.1016/j.fertnstert.2008.01.035. [DOI] [PMC free article] [PubMed] [Google Scholar]
- 12.Legro RS, Driscoll D, Strauss JF, Fox J, Dunaif A. Evidence for a genetic basis for hyperandrogenemia in polycystic ovary syndrome. Proceedings of the National Academy of Sciences of the United States of America. 1998;95:14956–60. doi: 10.1073/pnas.95.25.14956. [DOI] [PMC free article] [PubMed] [Google Scholar]
- 13.Hatch R, Rosenfield RL, Kim MH, Tredway D. Hirsutism: implications, etiology, and management. Am J Obstet Gynecol. 1981;140:815–30. doi: 10.1016/0002-9378(81)90746-8. [DOI] [PubMed] [Google Scholar]
- 14.Thiboutot D, Zaenglein A, Weiss J, Webster G, Calvarese B, Chen D. An aqueous gel fixed combination of clindamycin phosphate 1.2% and benzoyl peroxide 2.5% for the once-daily treatment of moderate to severe acne vulgaris: assessment of efficacy and safety in 2813 patients. J Am Acad Dermatol. 2008;59:792–800. doi: 10.1016/j.jaad.2008.06.040. [DOI] [PubMed] [Google Scholar]
- 15.Golding LA, Myers CR, Sinning WE. Y's Way to Fitness: The complete guide to fitness testing and instruction. Champaign IL: Human Kinetics; 1989. [Google Scholar]
- 16.Carey DG, Jenkins AB, Campbell LV, Freund J, Chisholm DJ. Abdominal fat and insulin resistance in normal and overweight women: Direct measurements reveal a strong relationship in subjects at both low and high risk of NIDDM. Diabetes. 1996;45:633–8. doi: 10.2337/diab.45.5.633. [DOI] [PubMed] [Google Scholar]
- 17.Legro RS, Chiu P, Kunselman AR, Bentley CM, Dodson WC, Dunaif A. Polycystic ovaries are common in women with hyperandrogenic chronic anovulation but do not predict metabolic or reproductive phenotype. J Clin Endocrinol Metab. 2005;90:2571–9. doi: 10.1210/jc.2004-0219. [DOI] [PubMed] [Google Scholar]
- 18.Legro RS, Kunselman AR, Dodson WC, Dunaif A. Prevalence and predictors of risk for type 2 diabetes mellitus and impaired glucose tolerance in polycystic ovary syndrome: a prospective, controlled study in 254 affected women. Journal of Clinical Endocrinology & Metabolism. 1999;84:165–9. doi: 10.1210/jcem.84.1.5393. [DOI] [PubMed] [Google Scholar]
- 19.Cronin L, Guyatt G, Griffith L, Wong E, Azziz R, Futterweit W, et al. Development of a health-related quality-of-life questionnaire (pcosq) for women with polycystic ovary syndrome (pcos) Journal of Clinical Endocrinology & Metabolism. 1998;83:1976–87. doi: 10.1210/jcem.83.6.4990. [DOI] [PubMed] [Google Scholar]
- 20.Chang WY, Knochenhauer ES, Bartolucci AA, Azziz R. Phenotypic spectrum of polycystic ovary syndrome: clinical and biochemical characterization of the three major clinical subgroups. Fertil Steril. 2005;83:1717–23. doi: 10.1016/j.fertnstert.2005.01.096. [DOI] [PubMed] [Google Scholar]