Abstract
Objective
Provide benchmarking information from a large national sample of patients receiving inpatient rehabilitation following lower extremity joint replacement.
Design
Secondary data analysis from 893 medical rehabilitation facilities located in the United States that contributed information to the Uniform Data System for Medical Rehabilitation (UDSmr) from January 2000 through December 2007. Variables analyzed included demographic information (age, sex, marital status, race/ethnicity, pre-hospital living setting, discharge setting), hospitalization information (length of stay, program interruptions, payer, onset date, rehabilitation impairment group, ICD-9 codes for admitting diagnosis, comorbidities), and functional status information (FIM® instrument [“FIM”] ratings at admission and discharge, FIM efficiency, FIM gain).
Results
Descriptive statistics from 705,345 patients showed an overall mean length of stay of 8.9 (±4.7) days. FIM total admission and discharge ratings declined over the 8-year study period. Mean admission ratings decreased from 83.5 (±11.3) to 73.2 (±12.9). Mean discharge ratings decreased from 108.4 (±11.0) to 101.7 (±12.9). Conversely, mean FIM change increased from 24.9 (±9.2) to 28.6 (±12.2). The percent of persons discharged to the community decreased from 94.5% to 91.9%. All results are likely influenced by various policy changes affecting classification and/or documentation processes.
Conclusions
National rehabilitation data from persons with lower extremity joint replacement in 2000–2007 indicate that inpatient rehabilitation lengths of stay have remained relatively stable and that patients are experiencing improvements in functional independence during their stay. In addition, more than 9 out of 10 patients are discharged to community settings following inpatient rehabilitation.
Keywords: Rehabilitation Outcomes, Benchmark, Quality Improvement, Joint Replacement
INTRODUCTION
This article represents the third in the series of impairment-specific longitudinal reports from the Uniform Data System for Medical Rehabilitation database (UDSmr® database). Our goal is to provide important benchmarking information for key rehabilitation outcomes such as length of stay, functional status, and discharge setting for patients with common inpatient rehabilitation impairments. This report includes information on patients with lower extremity joint replacement who received inpatient rehabilitation services from 2000 through 2007 in facilities that subscribed to the UDSmr. Previous reports presented the same information on patients receiving inpatient rehabilitation for stroke and traumatic brain injury.1,2 The current series is a continuation of prior single-year reports that included multiple rehabilitation impairment categories published in this journal (1990 through 1999).3–12 The new format displays trends in rehabilitation outcomes over time while still providing thorough yearly summaries that can serve as valuable resources for rehabilitation outcomes researchers and can help guide facility-level quality improvement efforts moving forward.
Data Source
The UDSmr, a not-for-profit organization affiliated with the UB Foundation Activities, Inc. at the State University of New York at Buffalo, maintains the largest non-governmental database for medical rehabilitation outcomes. Since 1987 the UDSmr has collected data from rehabilitation hospitals and units, long-term care hospitals, skilled nursing facilities, as well as pediatric and outpatient rehabilitation programs. Approximately 70% of inpatient rehabilitation facilities in the United States utilize UDSmr services. Subscribing facilities receive detailed summaries comparing their patient data to both regional and national benchmarks. This information is often used to evaluate quality management efforts and to comply with criteria required by The Joint Commission and the Commission on Accreditation of Rehabilitation Facilities as well as other accrediting organizations.
This report contains information for persons discharged from inpatient medical rehabilitation services between 1/1/2000 and 12/31/2007. The data are aggregated and presented using an October to September fiscal year schedule (see Variable Definitions below). Thus, in all tables and figures 2000 includes only three-quarters (1/1/2000 – 9/30/2000) of the calendar year and 2008 includes only one-quarter (10/1/2007 – 12/31/2007) of the calendar year.
Data Set
The UDSmr® database contains administrative data for patients receiving inpatient rehabilitation services. Demographic data include age, sex, marital status, race or ethnicity, pre-hospital living setting and discharge setting. Hospitalization and diagnostic information include length of stay, program interruptions, payer, impairment/event onset date, rehabilitation impairment group, and ICD-9 codes for the admitting diagnosis and comorbid conditions. Functional status information includes ratings from the FIM® instrument (“FIM”) for admission and discharge, FIM efficiency and FIM gain (see descriptions below).
The FIM instrument includes 18 items covering 6 domains (self-care, sphincter control, transfer, locomotion, communication, and social cognition). Each item is rated on a scale from 1 (complete dependence) to 7 (complete independence) with higher ratings representing greater functional independence (range 18 to 126). The FIM assessment was designed as an indicator of disability, which is measured in terms of assistance required to complete a task. FIM ratings are also presented as Motor and Cognition subscales. The Motor subscale includes 13 items assessing self-care, sphincter control, transfer, and locomotion. The Cognition subscale includes 5 items examining communication and social cognition. The reliability, validity and responsiveness of the FIM instrument have been documented by independent investigators.13–15
The data collected in 2000 and 2001 included the original UDSmr protocol for administering the FIM instrument (version 5.1). In 2002, the FIM instrument was integrated into the Inpatient Rehabilitation Facilities-Patient Assessment Instrument (IRF-PAI) developed by the Centers for Medicare and Medicaid Services (CMS) as part of the prospective payment system for inpatient rehabilitation facilities.16 Some changes were made to the FIM protocol and rating procedures. These changes have been described in documents produced by CMS17 and in recent publications18,19 and will not be discussed in this report. The major changes potentially impacting comparisons between pre-PPS and PPS FIM data include the following: 1) admission and discharge assessment time frame, 2) use of 0 for some admission motor items, 3) change in recording for bowel and bladder management, and 4) change in definition for program interruption.
Variable Definitions
Case-mix groups (CMGs) are the patient classification system that determines the reimbursement a facility is paid for Medicare Part A fee-for-service inpatient rehabilitation care. Each Medicare eligible patient is assigned to a CMG at admission to rehabilitation based on his or her primary impairment or medical condition, FIM ratings, and age (for select CMGs).20 There are 6 CMGs for lower extremity joint replacement rehabilitation.
CMG comorbidity tiers represent another factor that affects facility reimbursement from Medicare. Relative weightings (which are converted to payments) are stratified by tier across each CMG based on the presence of specific comorbidities that are likely to increase costs.21 These payment adjustments for comorbidities consist of a four-tier system: Tier 1 (high cost), Tier 2 (medium cost), Tier 3 (low cost), and no Tier.22
Community discharge identifies patients discharged to a community-based setting: home or an assisted living, a board and care, or a transitional living setting.
FIM efficiency refers to the average change in total FIM instrument ratings per day. It is calculated for each patient by subtracting FIM admission from FIM discharge ratings and then dividing by length of stay in days.
FIM gain is the difference between total FIM instrument admission and total FIM discharge ratings.
Length of stay is the total number of days spent in the rehabilitation facility. Interim days spent in an acute care setting resulting in a program interruption are not included in this value.
Onset to admit quantifies the duration (in days) from impairment onset to rehabilitation admission. In lower extremity joint replacement patients, onset date is typically recorded as the surgical date.
Program interruption identifies patients who were temporarily (≤30 days in 2000 and 2001 and ≤ 3 days beginning in 2002) transferred to an acute care setting and then returned for additional inpatient rehabilitation services.
Year discharged refers to the date of discharge from inpatient rehabilitation in relation to the Federal fiscal year. The Federal fiscal year runs from October 1 through September 30; e.g., fiscal year 2006 includes 10/1/2005 – 9/30/2006. CMS policy changes governing inpatient rehabilitation are traditionally implemented at the beginning of the fiscal rather than the calendar year.
Inclusion Criteria
We applied five basic criteria for cases to be included in this report: 1) the patient must have been receiving initial rehabilitation services (i.e., no admits for evaluation or readmissions, etc.), 2) the record could not have missing data for key benchmarking variables such as discharge setting or FIM ratings (this excludes patients who died during their rehabilitation stay), 3) the patient had to be between the ages of 7 and 105 years at admission, 4) the duration from impairment onset to rehabilitation admission could not exceed 365 days (1 year), and 5) the total length of stay could not exceed 548 days (1.5 years).
Descriptive Summary of Aggregate Data
The number of contributing facilities ranged from 785 to 893 per year over the 8-year study period. Approximately 60% of patients received care in hospital-based rehabilitation units with the remaining being cared for in freestanding rehabilitation hospitals over the 8-year study period (see Table 1).
Table 1.
Facility and patient characteristics stratified by discharge year: percentage or mean (sd).
| Total | 2000 | 2001 | 2002 | 2003 | 2004 | 2005 | 2006 | 2007 | 2008 | |
|---|---|---|---|---|---|---|---|---|---|---|
| N | 705,345 | 51,841 | 90,048 | 101,458 | 112,030 | 111,942 | 92,374 | 72,765 | 59,583 | 13,304 |
| Facility Type | ||||||||||
| Hospital unit | 61.6% | 64.5% | 56.1% | 57.7% | 61.3% | 63.7% | 64.0% | 63.8% | 64.4% | 62.7% |
| Freestanding | 38.3% | 35.3% | 43.9% | 42.3% | 38.7% | 36.3% | 36.0% | 36.2% | 35.6% | 37.3% |
| Age, yrs | 70.4 (10.9) | 70.8 (11.1) | 70.6 (11.1) | 70.2 (10.9) | 70.0 (10.8) | 70.2 (10.7) | 70.7 (10.6) | 70.8 (10.9) | 70.5 (11.1) | 70.3 (11.3) |
| <45 | 1.9% | 2.4% | 2.2% | 2.2% | 2.0% | 1.8% | 1.5% | 1.5% | 1.6% | 1.5% |
| 45–64 | 24.0% | 21.6% | 22.5% | 23.7% | 24.6% | 24.1% | 23.8% | 24.8% | 26.1% | 27.5% |
| 65–74 | 34.3% | 34.4% | 34.5% | 35.1% | 35.4% | 35.2% | 34.2% | 32.5% | 32.2% | 31.8% |
| 75+ | 39.8% | 41.6% | 40.8% | 38.9% | 38.1% | 38.9% | 40.4% | 41.1% | 40.1% | 39.2% |
| Gender | ||||||||||
| Male | 31.2% | 31.1% | 31.5% | 31.5% | 31.5% | 30.6% | 30.7% | 31.4% | 31.6% | 33.1% |
| Female | 68.8% | 68.9% | 68.5% | 68.5% | 68.5% | 69.4% | 69.3% | 68.6% | 68.4% | 66.9% |
| Married | ||||||||||
| Yes | 53.8% | 52.7% | 53.9% | 54.6% | 55.2% | 54.1% | 53.2% | 52.7% | 52.6% | 53.8% |
| No | 46.2% | 47.3% | 46.1% | 45.4% | 44.8% | 45.9% | 46.8% | 47.3% | 47.4% | 46.2% |
| Race / ethnicity | ||||||||||
| White | 85.9% | 86.3% | 87.1% | 86.7% | 86.4% | 86.0% | 85.8% | 84.5% | 84.0% | 83.9% |
| Black | 8.6% | 8.7% | 8.3% | 8.5% | 8.6% | 8.8% | 8.5% | 8.6% | 9.0% | 10.2% |
| Hispanic | 3.5% | 3.0% | 2.8% | 3.2% | 3.5% | 3.7% | 3.7% | 4.1% | 3.9% | 4.3% |
| Other | 1.9% | 1.9% | 1.8% | 1.6% | 1.5% | 1.5% | 2.0% | 2.8% | 3.1% | 1.6% |
| Primary insurance | ||||||||||
| Medicare | 70.0% | 68.7% | 69.0% | 70.0% | 70.0% | 71.3% | 72.3% | 70.6% | 67.1% | 64.2% |
| Medicare Advantage | 3.3% | 3.8% | 2.8% | 3.0% | 3.2% | 3.1% | 3.1% | 3.4% | 4.5% | 6.0% |
| Commercial | 16.7% | 15.1% | 15.9% | 17.1% | 17.0% | 16.3% | 16.0% | 16.9% | 18.5% | 19.4% |
| Managed care | 5.5% | 7.6% | 8.0% | 5.6% | 5.1% | 4.5% | 4.4% | 4.6% | 5.1% | 5.1% |
| Medicaid | 1.7% | 1.7% | 1.6% | 1.6% | 1.7% | 1.7% | 1.5% | 1.6% | 1.8% | 1.6% |
| Medicaid Advantage | 0.6% | 0.4% | 0.3% | 0.5% | 0.6% | 0.7% | 0.7% | 0.7% | 0.7% | 1.0% |
| Other | 2.3% | 2.7% | 2.3% | 2.2% | 2.3% | 2.4% | 2.0% | 2.2% | 2.3% | 2.7% |
| Living situation | ||||||||||
| With others | 67.5% | 66.5% | 67.6% | 67.9% | 68.4% | 67.6% | 67.1% | 66.8% | 66.7% | 68.3% |
| Alone | 32.1% | 32.8% | 31.9% | 31.8% | 31.3% | 32.1% | 32.5% | 32.8% | 32.9% | 31.3% |
| Admitted from | ||||||||||
| Acute care | 98.7% | 97.4% | 98.0% | 98.7% | 99.1% | 99.1% | 98.9% | 98.7% | 98.7% | 98.8% |
| Community | 0.7% | 1.6% | 1.4% | 0.8% | 0.5% | 0.4% | 0.5% | 0.6% | 0.6% | 0.5% |
| LTCF | 0.4% | 0.6% | 0.4% | 0.4% | 0.3% | 0.3% | 0.4% | 0.5% | 0.5% | 0.5% |
| Discharge setting | ||||||||||
| Community | 94.0% | 94.5% | 94.9% | 94.5% | 94.3% | 94.3% | 93.9% | 92.6% | 92.1% | 91.9% |
| LTCF | 2.3% | 2.7% | 2.5% | 2.2% | 2.1% | 2.0% | 2.1% | 2.8% | 2.8% | 2.7% |
| Acute care | 2.6% | 1.6% | 1.6% | 2.4% | 2.7% | 2.7% | 2.9% | 3.1% | 3.3% | 3.4% |
| Rehab / subacute | 1.0% | 0.8% | 0.8% | 0.8% | 0.8% | 0.9% | 1.1% | 1.5% | 1.7% | 1.8% |
| Onset to admission, days | 5.1 (13.1) | 5.1 (10.2) | 5.2 (11.2) | 5.7 (16.2) | 5.2 (13.7) | 4.9 (12.3) | 5.0 (12.9) | 5.1 (13.2) | 4.9 (11.7) | 5.1 (14.7) |
| Length of stay, days | 8.9 (4.7) | 9.5 (5.5) | 9.6 (5.8) | 8.9 (4.8) | 8.6 (4.6) | 8.5 (4.6) | 8.9 (4.2) | 8.9 (4.1) | 9.0 (4.0) | 9.0 (4.1) |
| FIM® total admission | 78.7 (12.4) | 83.5 (11.3) | 82.8 (11.4) | 80.9 (11.8) | 79.1 (12.0) | 78.2 (12.0) | 76.5 (12.2) | 74.7 (12.5) | 73.8 (12.8) | 73.2 (12.9) |
| FIM® total discharge | 104.7 (11.7) | 108.4 (11.0) | 108.4 (10.9) | 105.9 (11.6) | 103.8 (11.6) | 103.8 (11.3) | 103.6 (11.5) | 102.3 (12.2) | 102.1 (12.4) | 101.7 (12.9) |
| Efficiency, change/day | 3.4 (2.0) | 3.3 (2.0) | 3.3 (2.0) | 3.3 (2.0) | 3.3 (1.9) | 3.4 (1.9) | 3.5 (1.9) | 3.5 (1.9) | 3.5 (1.9) | 3.6 (2.0) |
Yearly summaries represent fiscal year periods (Oct 1 through Sep 30) from the Centers for Medicare and Medicaid Services. Dashed vertical line signifies introduction of the prospective payment system (PPS), resulting in substantial changes to functional evaluation and patient management processes. FIM total ratings include all 13 motor items across all years.
The original sample included 754,133 patients; however, 32,095 were not admitted for initial rehabilitation, 375 either died or their discharge setting was missing, 2 did not fit the desired age range, and for 16,316 patients, the duration from onset to admission was reported to be more than 1 year. All descriptive statistics (means, standard deviations, counts, and percentages) represent unadjusted aggregate values from the remaining 705,345 patients meeting the inclusion criteria. Thus, 94% of the original sample is summarized in this report. In addition, patients who died during inpatient rehabilitation were included in a single analysis to provide information on mortality rates and select patient characteristics.
The sections below describe summary statistics and observed trends in the data. As noted above, several assessment and coding changes were introduced with the IRF-PAI in 2002. Additional modifications have been introduced in subsequent years. Thus, some of the year-to-year differences may be more a consequence of changes in classification and/or documentation processes 18,19 than true changes in rehabilitation services or patient care/outcomes. Accordingly, caution must be used when interpreting longitudinal trends.
Patient Characteristics
Table 1 displays total and yearly summary statistics for general facility and patient characteristics. The total number of patients receiving inpatient rehabilitation following lower extremity joint replacement increased substantially, peaked in 2003–2004, and then decreased dramatically. Mean age of the entire sample was 70.4 years and age remained consistent across all years. However, persons in the 45–64 age group represented an increasing proportion of the total patient population over time. Gender, marital status, and race / ethnicity also demonstrated consistent patterns across all years; women consistently outnumbered men by more than a 2-to-1 ratio, slightly more than half were married, and non-Hispanic white patients made up 84–87% of each yearly cohort.
Medicare was the most common primary payer category followed by commercial insurance; approximately 70% and 17% of the entire sample, respectively. Beginning in 2002 through the first quarter of 2008, the percentages of patients with Medicare fee-for-service coverage exhibited a gradual decrease whereas the percentages of patients in Medicare managed care programs and those with commercial insurance gradually increased.
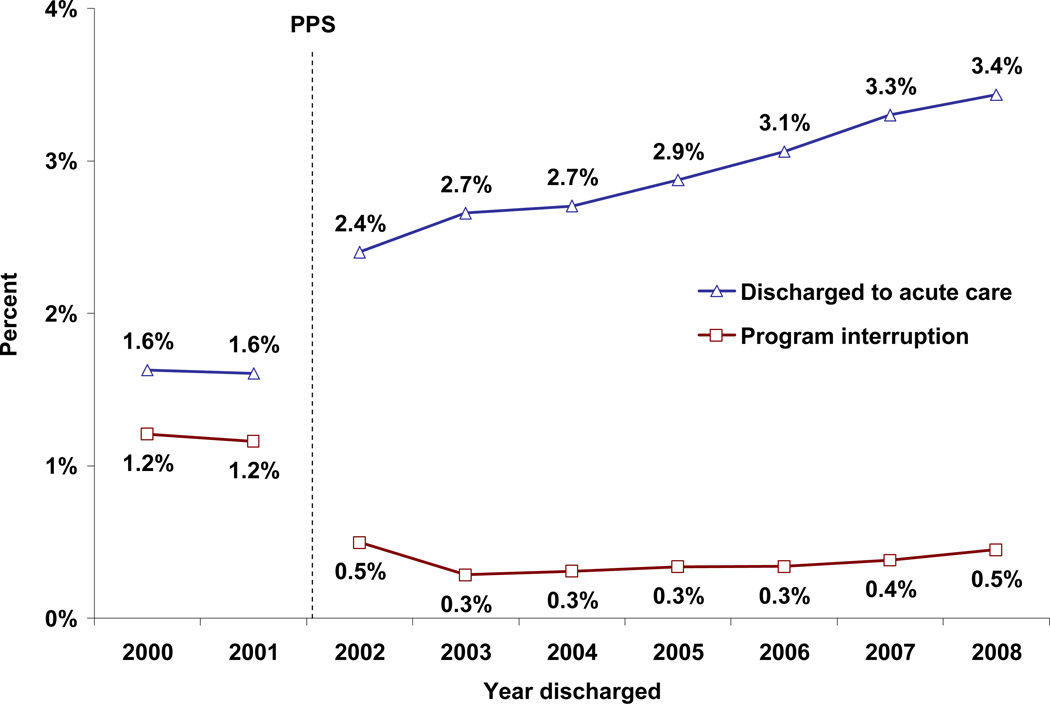
Approximately 98% of patients were admitted to inpatient rehabilitation directly from acute care and this pattern was stable across all 8 years. More than 9 out of 10 patients were discharged to the community following rehabilitation in each yearly cohort, but the percentages decreased slightly over the 8-year study period: 95% (2000) to 92% (2008). The abrupt increase in acute-care readmissions in 2002 reflect PPS-related changes in data definitions and coding as well as real changes in the percentage of patients who returned to the community.18 Figure 1 shows these changes in terms of discharges to acute care and program interruptions.
Figure 1.
Percentage of program interruptions and cases discharged to acute care by discharge year. Yearly summaries represent fiscal year periods (Oct 1 through Sep 30) from the Centers for Medicare and Medicaid Services. Dashed vertical line signifies introduction of the prospective payment system (PPS), resulting in substantial changes to functional evaluation and patient management processes. In 2002 the definition for program interruption changed from ≤ 30 days to ≤ 3 days.
Length of Stay and Functional Status
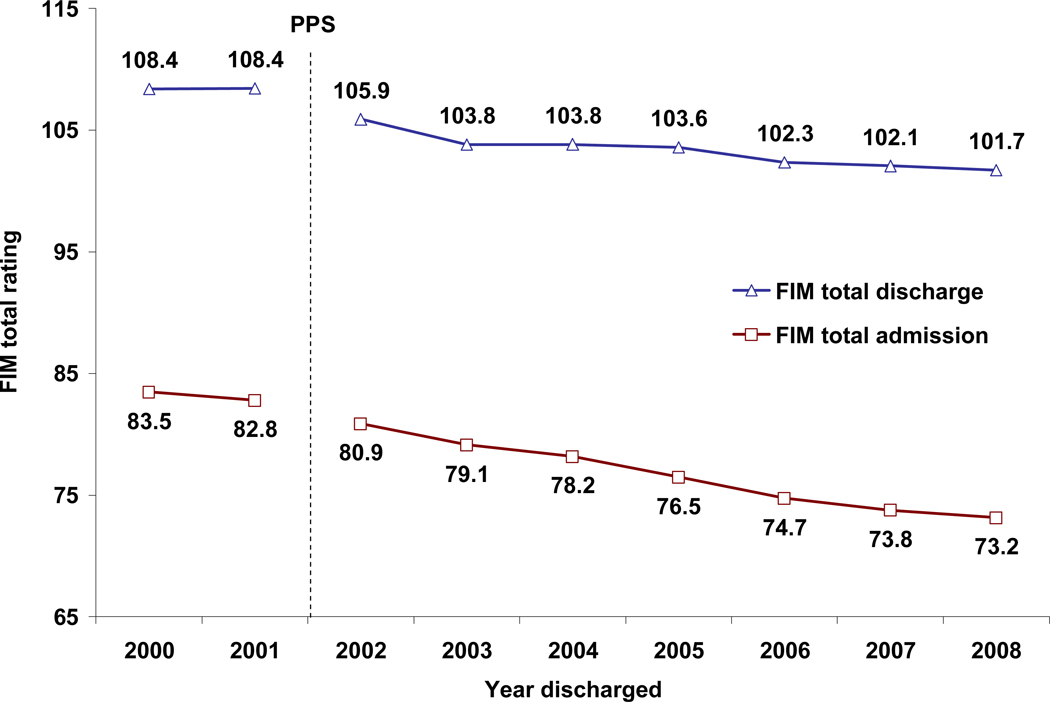
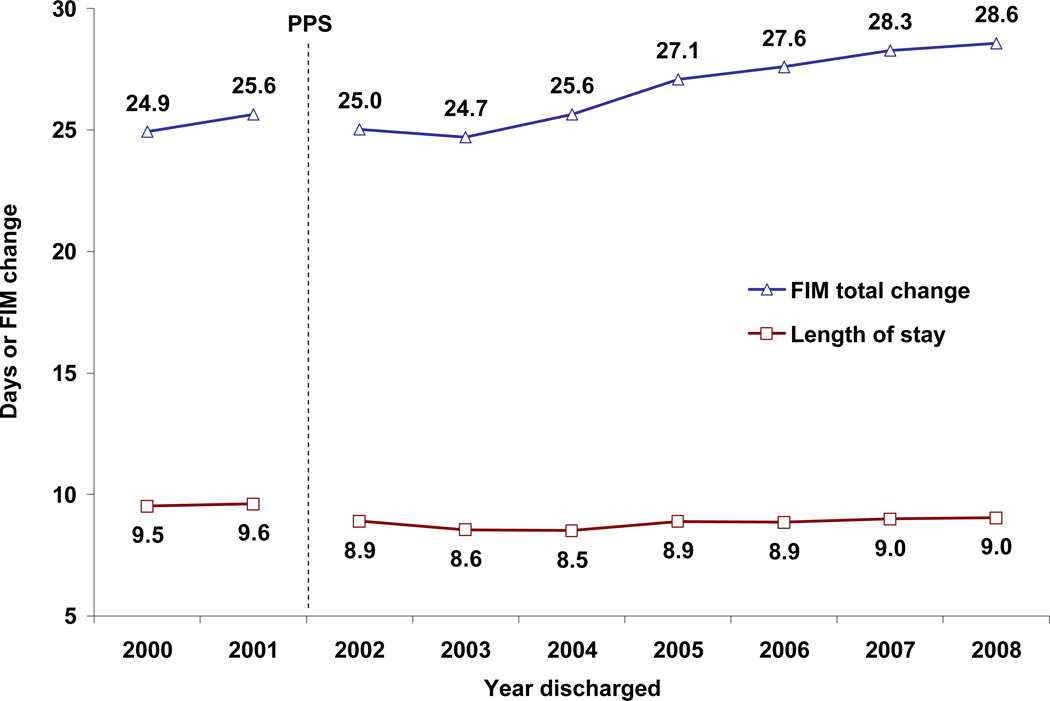
Table 1 also provides means and standard deviations for length of stay and functional status (FIM total) at admission and discharge as well as efficiency in functional improvement (average FIM change per day). Figures 2 and 3 display the trends in functional status and length of stay over time. FIM total admission and discharge ratings steadily decreased over time, with the largest drop coinciding with the introduction of the PPS in 2002 and the FIM changes. Conversely, mean changes (admission to discharge) in FIM total ratings gradually increased over the study period. Length of stay decreased abruptly in 2002, in part because of the IRF-PAI data set changes, and then remained relatively stable during the PPS years.
Figure 2.
Mean admission and discharge FIM® total ratings by discharge year. Yearly summaries represent fiscal year periods (Oct 1 through Sep 30) from the Centers for Medicare and Medicaid Services. Dashed vertical line signifies introduction of the prospective payment system (PPS), resulting in substantial changes to functional evaluation and patient management processes. In 2002 some rules for completing the FIM instrument items were changed.
Figure 3.
Mean FIM® total change and length of stay by discharge year. Yearly summaries represent fiscal year periods (Oct 1 through Sep 30) from the Centers for Medicare and Medicaid Services. Dashed vertical line signifies introduction of the prospective payment system (PPS), resulting in substantial changes to functional evaluation and patient management processes.
Table 2 shows mean admission, discharge, and change ratings for individual items within each of the 6 functional domains of the FIM instrument. As expected, the items in the locomotion domain yielded the lowest mean ratings among the 4 domains in the FIM motor subscale at both admission and discharge across all years. Interestingly, mean admission ratings for both cognition domains (communication and social cognition) tended to decrease over the study period.
Table 2.
Mean ratings for individual items (range 1–7) within each FIM® subscale stratified by discharge year: mean (sd).
| FIM® Subscale | Total | 2000 | 2001 | 2002 | 2003 | 2004 | 2005 | 2006 | 2007 | 2008 |
|---|---|---|---|---|---|---|---|---|---|---|
| Admission | ||||||||||
| Self-care | 4.3 (0.8) | 4.6 (0.8) | 4.5 (0.8) | 4.4 (0.8) | 4.3 (0.8) | 4.3 (0.8) | 4.2 (0.8) | 4.1 (0.8) | 4.0 (0.8) | 4.0 (0.8) |
| Sphincter | 4.6 (1.5) | 5.2 (1.5) | 5.1 (1.5) | 4.7 (1.6) | 4.6 (1.5) | 4.6 (1.5) | 4.5 (1.5) | 4.4 (1.5) | 4.3 (1.6) | 4.3 (1.6) |
| Transfer | 3.1 (1.0) | 3.2 (1.0) | 3.2 (1.0) | 3.2 (1.0) | 3.1 (0.9) | 3.1 (0.9) | 3.0 (0.9) | 2.9 (0.9) | 2.9 (0.9) | 2.8 (1.0) |
| Locomotion | 1.7 (0.9) | 1.7 (0.9) | 1.7 (0.9) | 1.7 (0.9) | 1.7 (0.9) | 1.7 (0.9) | 1.6 (0.8) | 1.6 (0.8) | 1.5 (0.8) | 1.5 (0.8) |
| Communication | 6.3 (0.9) | 6.6 (0.7) | 6.6 (0.8) | 6.5 (0.8) | 6.4 (0.9) | 6.3 (0.9) | 6.2 (1.0) | 6.1 (1.0) | 6.0 (1.0) | 6.0 (1.0) |
| Social Cognition | 6.1 (1.1) | 6.5 (0.9) | 6.4 (1.0) | 6.3 (1.0) | 6.1 (1.1) | 6.1 (1.1) | 5.9 (1.1) | 5.8 (1.2) | 5.8 (1.2) | 5.7 (1.2) |
| Discharge | ||||||||||
| Self-care | 5.9 (0.8) | 6.1 (0.7) | 6.1 (0.7) | 6.0 (0.7) | 5.9 (0.7) | 5.9 (0.7) | 5.9 (0.8) | 5.8 (0.8) | 5.8 (0.8) | 5.7 (0.8) |
| Sphincter | 5.9 (1.0) | 6.3 (0.9) | 6.3 (0.9) | 6.1 (1.0) | 5.9 (1.0) | 5.8 (1.0) | 5.8 (1.1) | 5.7 (1.1) | 5.7 (1.1) | 5.7 (1.2) |
| Transfer | 5.3 (0.9) | 5.5 (0.8) | 5.5 (0.8) | 5.3 (0.9) | 5.2 (1.0) | 5.2 (0.9) | 5.2 (0.9) | 5.1 (1.0) | 5.1 (1.0) | 5.1 (1.0) |
| Locomotion | 4.4 (1.4) | 4.5 (1.3) | 4.5 (1.3) | 4.4 (1.4) | 4.3 (1.4) | 4.4 (1.4) | 4.4 (1.4) | 4.3 (1.4) | 4.3 (1.4) | 4.3 (1.4) |
| Communication | 6.6 (0.6) | 6.7 (0.6) | 6.7 (0.6) | 6.7 (0.6) | 6.6 (0.6) | 6.6 (0.6) | 6.5 (0.7) | 6.5 (0.7) | 6.5 (0.7) | 6.5 (0.7) |
| Social Cognition | 6.5 (0.8) | 6.7 (0.7) | 6.6 (0.8) | 6.6 (0.8) | 6.5 (0.8) | 6.5 (0.8) | 6.4 (0.8) | 6.4 (0.8) | 6.4 (0.8) | 6.3 (0.8) |
| Change | ||||||||||
| Self-care | 1.6 (0.8) | 1.6 (0.7) | 1.6 (0.7) | 1.6 (0.8) | 1.5 (0.8) | 1.6 (0.8) | 1.7 (0.8) | 1.7 (0.8) | 1.8 (0.9) | 1.8 (0.9) |
| Sphincter | 1.3 (1.4) | 1.1 (1.3) | 1.2 (1.3) | 1.3 (1.4) | 1.3 (1.5) | 1.3 (1.4) | 1.3 (1.4) | 1.4 (1.5) | 1.4 (1.5) | 1.4 (1.5) |
| Transfer | 2.2 (1.1) | 2.3 (1.0) | 2.3 (1.0) | 2.2 (1.1) | 2.1 (1.1) | 2.1 (1.1) | 2.2 (1.1) | 2.2 (1.1) | 2.2 (1.1) | 2.3 (1.1) |
| Locomotion | 2.7 (1.4) | 2.8 (1.4) | 2.8 (1.4) | 2.7 (1.4) | 2.6 (1.4) | 2.7 (1.4) | 2.7 (1.4) | 2.7 (1.4) | 2.8 (1.4) | 2.8 (1.4) |
| Communication | 0.3 (0.6) | 0.1 (0.4) | 0.1 (0.5) | 0.2 (0.6) | 0.2 (0.6) | 0.3 (0.7) | 0.4 (0.7) | 0.4 (0.8) | 0.4 (0.8) | 0.5 (0.8) |
| Social Cognition | 0.4 (0.7) | 0.2 (0.5) | 0.2 (0.5) | 0.3 (0.6) | 0.4 (0.7) | 0.4 (0.7) | 0.5 (0.8) | 0.5 (0.8) | 0.6 (0.9) | 0.6 (0.9) |
Yearly summaries represent fiscal year periods (Oct 1 through Sep 30) from the Centers for Medicare and Medicaid Services. Dashed vertical line signifies introduction of the prospective payment system (PPS), resulting in substantial changes to functional evaluation and patient management processes. Cell values represent mean ratings for individual FIM items within the particular subscale.
Table 3 stratifies summaries of patient age, length of stay, and functional status by discharge setting (community versus all other discharge settings). Overall, patients discharged to the community were younger, experienced shorter lengths of stay, and demonstrated higher functional status at admission and discharge compared to those discharged to an institutional or other setting. However, the difference between groups in length of stay decreased over the 8-year study period. In 2000, the difference in mean lengths of stay between the two groups was approximately 4 days. By 2008, the difference was 1 day. Patients discharged to the community also showed greater responses to rehabilitative care in terms of overall functional gain and efficiency.
Table 3.
Patient characteristics according to discharge setting stratified by discharge year: mean (sd).
| Community Discharge |
Total | 2000 | 2001 | 2002 | 2003 | 2004 | 2005 | 2006 | 2007 | 2008 | |
|---|---|---|---|---|---|---|---|---|---|---|---|
| Age, yrs | Yes | 70.1 (10.8) | 70.4 (11.0) | 70.3 (10.9) | 69.9 (10.8) | 69.7 (10.7) | 70.0 (10.6) | 70.4 (10.5) | 70.4 (10.9) | 70.1 (11.0) | 69.9 (11.2) |
| No | 75.3 (11.0) | 76.9 (11.2) | 76.7 (11.1) | 75.2 (10.9) | 74.9 (10.8) | 74.6 (11.0) | 75.1 (10.7) | 75.4 (11.0) | 75.1 (11.3) | 75.0 (11.3) | |
| Length of stay, days | Yes | 8.8 (4.5) | 9.3 (5.2) | 9.4 (5.4) | 8.8 (4.6) | 8.5 (4.5) | 8.4 (4.4) | 8.8 (4.0) | 8.8 (3.9) | 8.9 (3.8) | 9.0 (3.9) |
| No | 10.6 (7.1) | 13.1 (8.5) | 13.1 (10.0) | 10.7 (7.2) | 10.0 (6.5) | 9.9 (6.5) | 9.8 (6.2) | 10.1 (5.9) | 9.9 (5.8) | 10.0 (5.6) | |
| FIM® total admission | Yes | 79.4 (11.8) | 84.2 (10.5) | 83.5 (10.6) | 81.6 (11.1) | 79.8 (11.4) | 78.8 (11.5) | 77.2 (11.7) | 75.5 (11.9) | 74.6 (12.3) | 74.1 (12.3) |
| No | 67.5 (15.3) | 70.6 (15.0) | 69.9 (16.0) | 69.1 (15.6) | 68.6 (15.1) | 68.3 (14.8) | 66.2 (14.7) | 64.9 (14.7) | 64.3 (15.1) | 62.7 (14.9) | |
| FIM® motor admission | Yes | 48.1 (9.1) | 51.3 (8.7) | 50.7 (8.7) | 49.5 (9.0) | 48.5 (9.0) | 47.9 (8.9) | 46.8 (8.8) | 45.6 (8.9) | 44.9 (9.2) | 44.6 (9.3) |
| No | 39.6 (10.6) | 41.8 (10.6) | 41.4 (10.9) | 40.5 (10.9) | 40.3 (10.6) | 40.2 (10.4) | 38.9 (10.1) | 37.9 (10.2) | 37.5 (10.5) | 36.3 (10.4) | |
| FIM® cognition admission | Yes | 31.2 (4.6) | 32.9 (3.7) | 32.8 (3.8) | 32.1 (4.1) | 31.3 (4.4) | 30.9 (4.6) | 30.4 (4.9) | 29.9 (5.1) | 29.7 (5.2) | 29.5 (5.2) |
| No | 27.9 (6.9) | 28.8 (6.8) | 28.5 (7.2) | 28.6 (6.9) | 28.3 (6.7) | 28.1 (6.6) | 27.4 (6.9) | 27.0 (6.8) | 26.8 (6.9) | 26.4 (6.9) | |
| FIM® total discharge | Yes | 106.0 (9.7) | 109.6 (8.9) | 109.6 (8.7) | 107.2 (9.5) | 105.1 (9.6) | 105.0 (9.4) | 104.9 (9.4) | 104 (9.8) | 103.8 (10.0) | 103.7 (10.1) |
| No | 83.6 (19.0) | 87.8 (19.2) | 87.1 (20.2) | 84.2 (19.7) | 83.2 (18.9) | 83.7 (18.2) | 82.5 (18.6) | 81.7 (18.5) | 81.6 (18.2) | 79.7 (19.0) | |
| FIM® motor discharge | Yes | 73.1 (8.1) | 75.9 (7.3) | 76.0 (7.1) | 73.9 (7.9) | 72.2 (8.2) | 72.3 (8.0) | 72.3 (7.8) | 71.6 (8.1) | 71.5 (8.4) | 71.4 (8.4) |
| No | 54.4 (15.2) | 58.1 (15.0) | 57.8 (15.5) | 54.7 (15.7) | 54.0 (15.0) | 54.2 (14.8) | 53.5 (14.8) | 53 (14.8) | 52.7 (14.8) | 51.3 (15.4) | |
| FIM® cognition discharge | Yes | 32.9 (3.1) | 33.7 (2.8) | 33.6 (2.8) | 33.3 (2.9) | 32.9 (3.0) | 32.8 (3.0) | 32.6 (3.1) | 32.4 (3.3) | 32.3 (3.3) | 32.3 (3.3) |
| No | 29.2 (6.3) | 29.7 (6.5) | 29.3 (6.9) | 29.5 (6.5) | 29.3 (6.3) | 29.5 (5.9) | 29.0 (6.2) | 28.7 (6.2) | 28.9 (6.0) | 28.5 (6.2) | |
| FIM® total change | Yes | 26.7 (10.5) | 25.4 (8.8) | 26.1 (8.9) | 25.6 (10.0) | 25.3 (11.0) | 26.3 (10.9) | 27.8 (10.8) | 28.5 (11.0) | 29.2 (11.3) | 29.6 (11.3) |
| No | 16.1 (13.6) | 17.2 (12.5) | 17.3 (12.7) | 15.1 (14.1) | 14.7 (13.7) | 15.4 (13.3) | 16.3 (13.8) | 16.8 (13.5) | 17.3 (14.2) | 17.0 (14.5) | |
| FIM® motor change | Yes | 25.0 (9.2) | 24.6 (8.3) | 25.2 (8.3) | 24.4 (9.1) | 23.7 (9.8) | 24.4 (9.6) | 25.5 (9.1) | 26.0 (9.3) | 26.6 (9.5) | 26.8 (9.5) |
| No | 14.8 (11.8) | 16.3 (11.2) | 16.4 (11.2) | 14.2 (12.2) | 13.6 (11.8) | 14.1 (11.6) | 14.6 (11.8) | 15.1 (11.6) | 15.3 (11.9) | 15 (12.4) | |
| FIM® cognition change | Yes | 1.7 (3.2) | 0.8 (2.1) | 0.8 (2.2) | 1.2 (2.7) | 1.6 (3.0) | 1.9 (3.2) | 2.3 (3.5) | 2.5 (3.7) | 2.6 (3.8) | 2.8 (3.9) |
| No | 1.3 (4.0) | 0.8 (3.2) | 0.8 (3.3) | 0.9 (4.1) | 1.0 (3.9) | 1.4 (3.8) | 1.6 (4.2) | 1.7 (4.1) | 2.1 (4.5) | 2.0 (4.5) | |
| Efficiency, change/day | Yes | 3.5 (1.9) | 3.4 (2.0) | 3.4 (2.0) | 3.4 (1.9) | 3.4 (1.8) | 3.5 (1.9) | 3.6 (1.8) | 3.6 (1.8) | 3.7 (1.8) | 3.7 (1.9) |
| No | 1.7 (2.5) | 1.6 (2.5) | 1.6 (2.1) | 1.5 (2.8) | 1.5 (2.4) | 1.7 (2.2) | 1.8 (2.5) | 1.8 (2.2) | 1.8 (2.8) | 1.8 (2.7) |
Yearly summaries represent fiscal year periods (Oct 1 through Sep 30) from the Centers for Medicare and Medicaid Services. Dashed vertical line signifies introduction of the prospective payment system (PPS), resulting in substantial changes to functional evaluation and patient management processes.
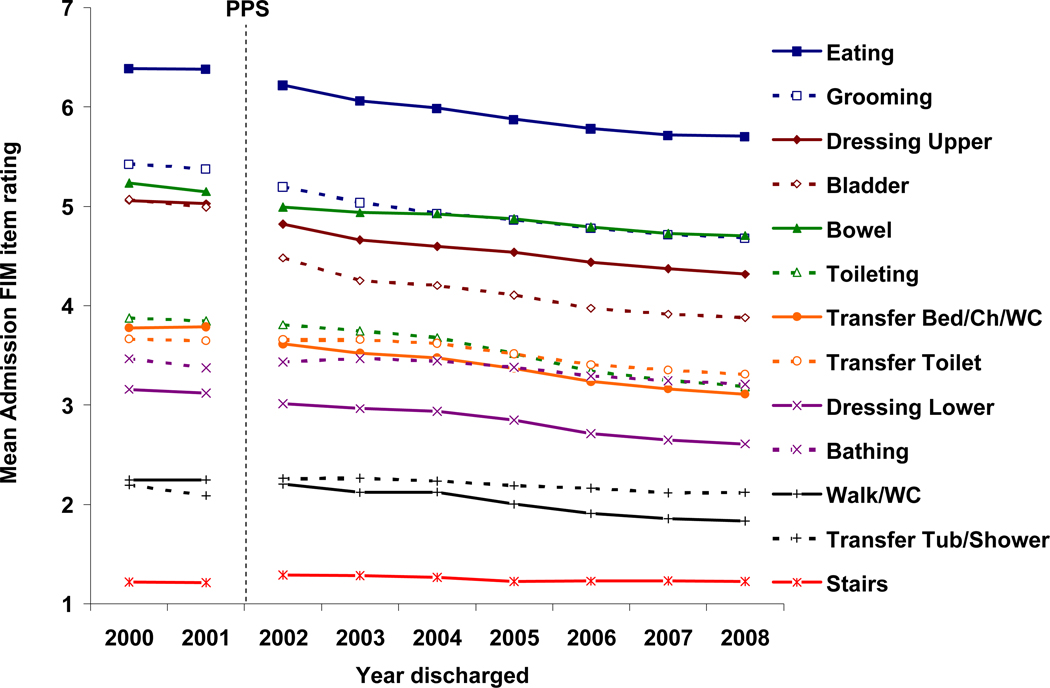
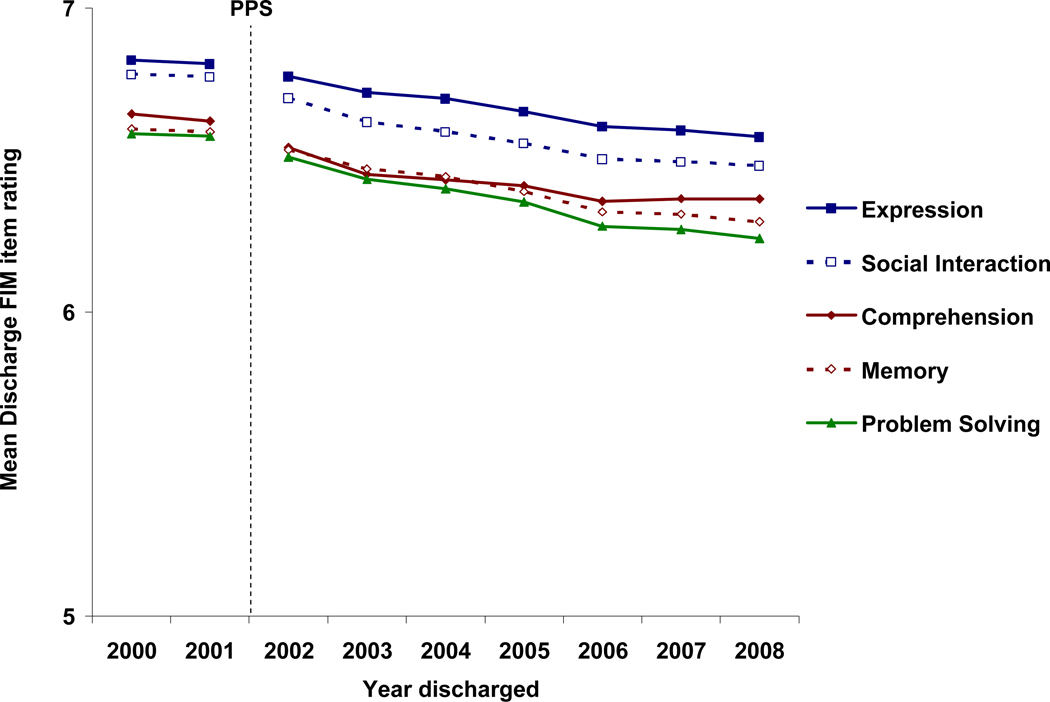
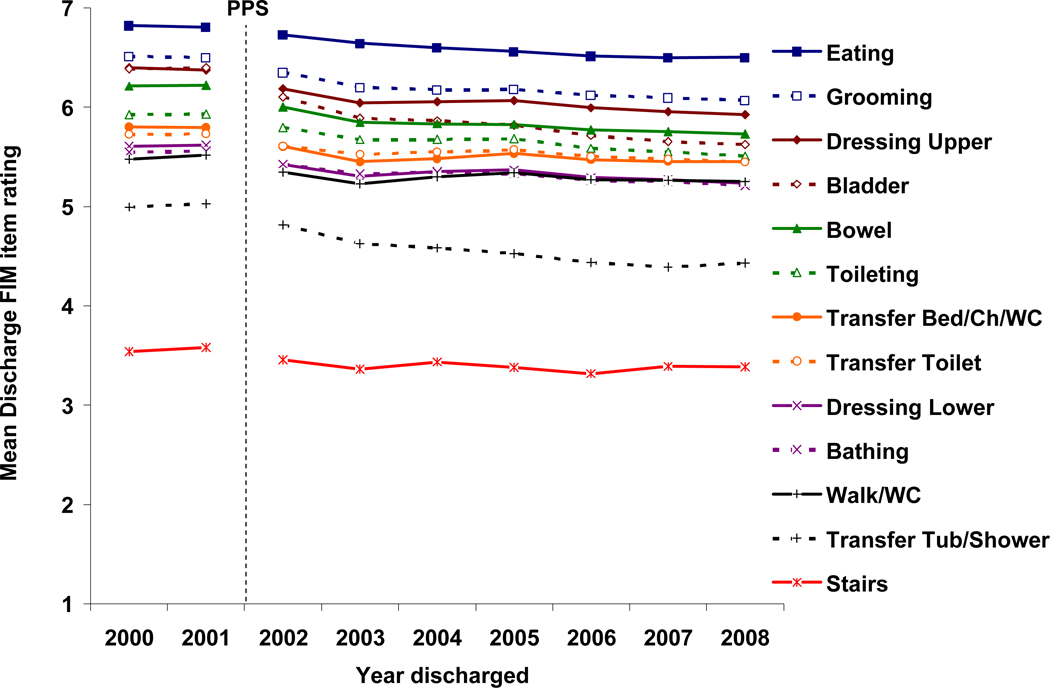
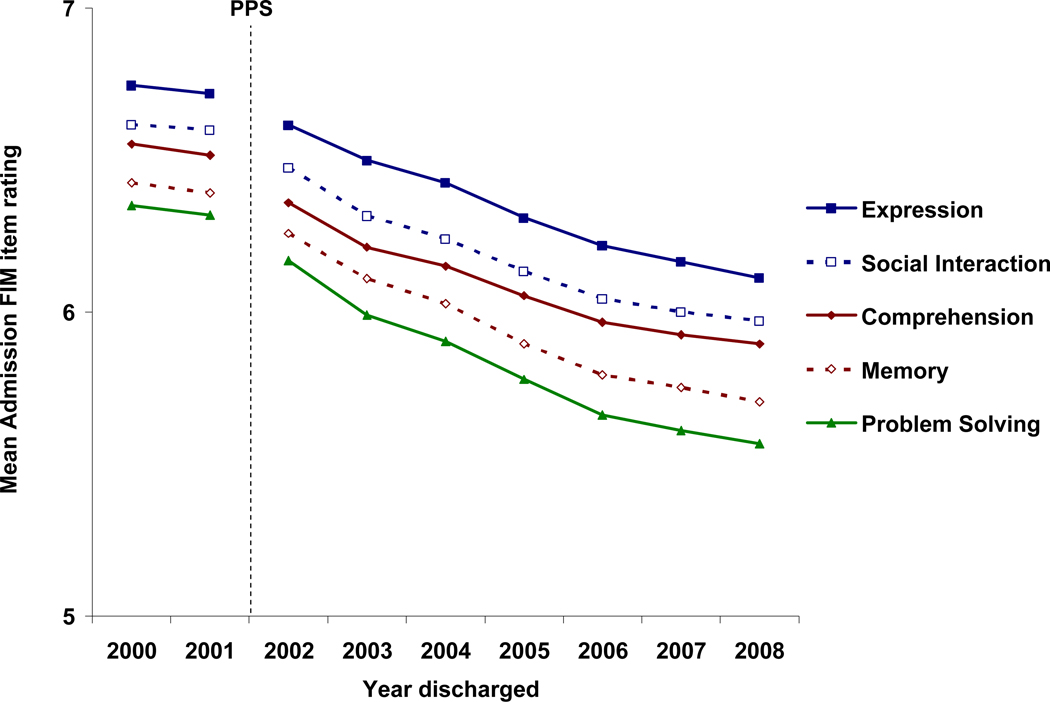
Figures 4–7 display mean ratings for the 13 motor and 5 cognition items across all years. The figure legends present the hierarchies of average discharge ratings for the motor and cognitive subscale items. Among the 13 motor items, patients with lower extremity joint replacement showed the most difficulty with transferring from a tub or shower and climbing stairs (see Figures 4 and 5). Overall, the patients demonstrated relatively sound cognition on all five items (see Figures 6 and 7). However, Figure 6 does highlight the trend of decreasing admission cognition ratings over the 8-year study period.
Figure 4.
Mean ratings for individual FIM® motor items at admission to inpatient rehabilitation. Yearly summaries represent fiscal year periods (Oct 1 through Sep 30) from the Centers for Medicare and Medicaid Services. Dashed vertical line signifies introduction of the prospective payment system (PPS), resulting in substantial changes to functional evaluation and patient management processes.
Figure 7.
Mean ratings for individual FIM® cognitive items at discharge from inpatient rehabilitation. Yearly summaries represent fiscal year periods (Oct 1 through Sep 30) from the Centers for Medicare and Medicaid Services. Dashed vertical line signifies introduction of the prospective payment system (PPS), resulting in substantial changes to functional evaluation and patient management processes.
Figure 5.
Mean ratings for individual FIM® motor items at discharge from inpatient rehabilitation. Yearly summaries represent fiscal year periods (Oct 1 through Sep 30) from the Centers for Medicare and Medicaid Services. Dashed vertical line signifies introduction of the prospective payment system (PPS), resulting in substantial changes to functional evaluation and patient management processes.
Figure 6.
Mean ratings for individual FIM® cognitive items at admission to inpatient rehabilitation. Yearly summaries represent fiscal year periods (Oct 1 through Sep 30) from the Centers for Medicare and Medicaid Services. Dashed vertical line signifies introduction of the prospective payment system (PPS), resulting in substantial changes to functional evaluation and patient management processes.
Case Severity
Lower extremity joint replacement involves variable combinations of joints and extremities affected. Table 4 displays the distribution of involved joints by year. The percentages of patients with unilateral hip and unilateral knee replacements decreased slightly, whereas the percentage with bilateral knee replacements increased more than two-fold over the 8-year study period.
Table 4.
Involved joint(s) stratified by discharge year: percentage.
| Involved Joint(s)* | Total | 2000 | 2001 | 2002 | 2003 | 2004 | 2005 | 2006 | 2007 | 2008 |
|---|---|---|---|---|---|---|---|---|---|---|
| Unilateral hip | 34.0% | 38.4% | 39.3% | 36.5% | 34.7% | 32.6% | 30.6% | 30.4% | 29.6% | 29.3% |
| Bilateral hip | 0.9% | 1.0% | 1.0% | 0.9% | 0.8% | 0.7% | 0.7% | 1.0% | 1.1% | 1.2% |
| Unilateral knee | 54.0% | 47.4% | 50.2% | 54.2% | 56.4% | 57.9% | 56.8% | 53.3% | 51.2% | 48.7% |
| Bilateral knee | 10.4% | 7.7% | 7.9% | 8.0% | 7.9% | 8.7% | 11.8% | 15.2% | 18.0% | 20.6% |
| Hip/knee same side | 0.1% | 0.1% | 0.1% | 0.2% | 0.1% | 0.1% | 0.1% | 0.1% | 0.1% | 0.1% |
| Hip/knee opposite sides | 0.1% | 0.0% | 0.1% | 0.1% | 0.1% | 0.0% | 0.0% | 0.0% | 0.0% | 0.1% |
Yearly summaries represent fiscal year periods (Oct 1 through Sep 30) from the Centers for Medicare and Medicaid Services. Dashed vertical line signifies introduction of the prospective payment system (PPS), resulting in substantial changes to functional evaluation and patient management processes.
Prior to PPS (2002) a category of Hip (unspecified) and Knee (unspecified) existed in the orthopedic RIC. These accounted for less than 0.5% of the total cases and are not included in Table 4.
Case-mix Groups (CMGs) were introduced as part of the PPS in 2002. Table 5 shows the distribution of the six lower extremity joint replacement CMGs by year. Both the least severe (0801) and most severe (0806) CMGs remained relatively low over time. Yearly distributions fluctuated more randomly among the other four categories.
Table 5.
Case-mix groups (CMG) stratified by discharge year: percentage.
| CMG | 2002 | 2003 | 2004 | 2005 | 2006 | 2007 | 2008 |
|---|---|---|---|---|---|---|---|
| 0801 | 8.4% | 7.5% | 5.7% | 5.9% | 5.2% | 4.7% | 4.6% |
| 0802 | 8.1% | 18.1% | 6.5% | 34.5% | 41.9% | 39.1% | 37.5% |
| 0803 | 37.2% | 27.1% | 35.1% | 11.5% | 3.6% | 3.6% | 3.9% |
| 0804 | 24.2% | 23.2% | 21.8% | 26.9% | 29.3% | 29.8% | 29.0% |
| 0805 | 10.5% | 12.2% | 14.8% | 12.4% | 13.1% | 14.7% | 16.1% |
| 0806 | 11.6% | 11.9% | 16.1% | 8.7% | 6.8% | 8.0% | 9.0% |
Yearly summaries represent fiscal year periods (Oct 1 through Sep 30) from the Centers for Medicare and Medicaid Services.
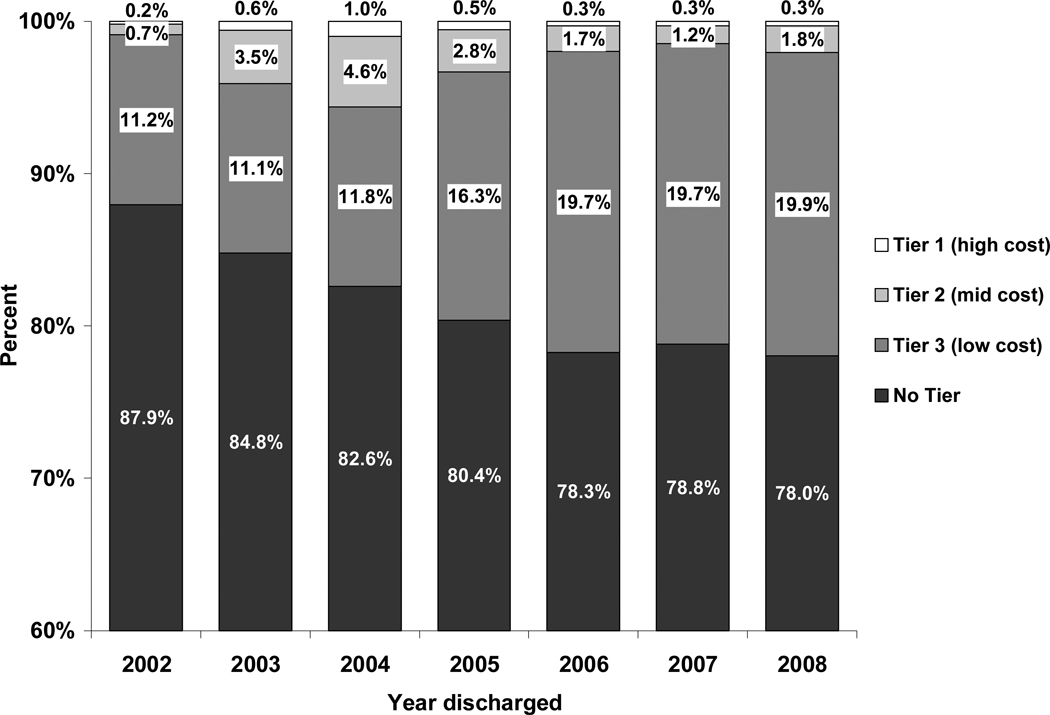
The comorbidity tier system was also introduced in 2002. Figure 8 shows the percentages of patients assigned to each of the 4 possible CMG comorbidity tier levels by year. The tier criteria have been revised over the years and the figure displays the tier structure in place for that year. While a majority of patients were classified as having no tier-eligible comorbidities in any given year, the figure shows a decrease in the no tier percentages and a corresponding increase in tier 3 percentages over time.
Figure 8.
Relative proportions of CMG comorbidity tier assignment under the prospective payment system by discharge year. Yearly summaries represent fiscal year periods (Oct 1 through Sep 30) from the Centers for Medicare and Medicaid Services. The CMG comorbidity tier system changed over the years.
Deaths
A total of 151 (0.02%) patients died during their rehabilitation stay. Comparing overall mean values for those who died (Table 6) with those who survived (Table 1) reveals that patients who died were somewhat older (4 years) and less functionally independent at admission (23 points) compared to survivors.
Table 6.
Characteristics of patients who died during inpatient rehabilitation by year of death: mean (sd).
| Total | 2000 | 2001 | 2002 | 2003 | 2004 | 2005 | 2006 | 2007 | 2008 | |
|---|---|---|---|---|---|---|---|---|---|---|
| Died, N | 151 | 19 | 23 | 22 | 19 | 23 | 17 | 15 | 9 | 4 |
| Died, % | 0.02% | 0.04% | 0.03% | 0.02% | 0.02% | 0.02% | 0.02% | 0.02% | 0.02% | 0.03% |
| Age, yrs | 74.3 (11.3) | 70.5 (17.6) | 78.5 (9.7) | 72.5 (9.7) | 73.0 (11.6) | 73.1 (7.9) | 74.9 (6.8) | 74.3 (12.5) | 78.4 (12.4) | 78 (12.6) |
| FIM® total admission | 65.7 (17.2) | 73.0 (11.6) | 72.2 (16.5) | 61.8 (23.3) | 67.1 (12.1) | 62.5 (18.6) | 60.3 (17.0) | 61.9 (17.1) | 62.3 (15.1) | 72.3 (8.0) |
| Onset to admission, days | 6.0 (7.1) | 5.3 (3.3) | 10.2 (16.2) | 5.5 (3.6) | 6.0 (4.4) | 4.2 (1.3) | 5.7 (3.2) | 4.9 (2.9) | 5.9 (2.4) | 4.0 (1.6) |
| Length of stay, days | 7.0 (8.6) | 13.1 (20.4) | 7.2 (4.3) | 5.4 (5.5) | 6.1 (4.7) | 5.8 (4.4) | 6.7 (4.1) | 5.0 (4.2) | 8.4 (6.1) | 3.0 (1.4) |
Yearly summaries represent fiscal year periods (Oct 1 through Sep 30) from the Centers for Medicare and Medicaid Services. Dashed vertical line signifies introduction of the prospective payment system (PPS), resulting in substantial changes to functional evaluation and patient management processes. Note: % is calculated from the total sample with complete data, including both survivors and non-survivors: N = 705,496.
CONCLUSIONS
This report provides aggregated data from more than 700,000 patients with lower extremity joint replacement discharged from inpatient medical rehabilitation programs in the U.S. from 2000 through 2007. While the number of facilities submitting data to the UDSmr varied somewhat from year to year, the total number of patients receiving inpatient rehabilitation services for lower extremity joint replacement follows a well-known trend. Substantial increases in the number of joint replacement rehabilitation patients were observed through fiscal year 2003 followed by precipitous declines. The previously suspended “75% rule” was reinstated by the CMS in fiscal year 2004.23 The regulation is now described as the “60% rule” and uncomplicated lower extremity joint replacement is not 1 of the 13 eligible conditions.24
Both gender and race/ethnicity demonstrated distinct patterns: women outnumbered men more than 2:1 and whites outnumbered the next largest race/ethnicity category (blacks) by nearly 10:1. These patterns are consistent with acute care hospital discharge data for lower extremity joint replacement,25,26 suggesting that the demographic profile of patients receiving inpatient rehabilitation services is simply a reflection of the patients who undergo joint replacement surgery.
Individuals in the 45–64 year age range only represented about one-quarter of the total lower extremity joint replacement rehabilitation patients, but that age cohort was the only one that demonstrated an increase over the 8-year study period. Approximately 74% of patients were 65 years old or older so it is not surprising that Medicare covered 70% of the total rehabilitation stays, which is more than 4-fold greater than the next most common payer (commercial insurance at 17%).
Despite gradual declines in both admission and discharge functional ratings over all 8 years of the study period, FIM total change increased slightly over time. This observation, combined with relatively stable lengths of stay resulted in consistent to slightly improved rehabilitation efficiency over time. Importantly, although the percentages of patients discharged to the community decreased slightly over the 8-year study period, more than 90% of patients in any given year were discharged to the community following inpatient rehabilitation for lower extremity joint replacement.
In the prior reports, we offered the following reminder for utilizing these benchmark data. The UDSmr recommends that when facilities compare their own data to published benchmark information they should: 1) use at least a full year’s data with patient discharge dates reflecting the period of interest, 2) include information on all patients within the pertinent impairment group and period under review, and 3) include statistics that show patient variability such as standard deviations. More meaningful comparisons of outcomes data across settings (e.g., facility vs. national data) require case-mix adjustment. The process of adjusting the data “levels the playing field” by removing factors (i.e., impairment severity and type, patient age) other than treatment that may influence the outcome.27
In sum, it is imperative to exercise caution when interpreting year-to-year comparisons as some longitudinal changes may not reflect actual variations in rehabilitative care or patient experiences. Instead, many changes may be directly related to CMS-mandated modifications in documentation, eligibility, and/or reimbursement processes implemented at different times in the PPS era. The value of this report is best described as providing year-specific benchmark information for patient characteristics and outcomes, given the stability of the rules and regulations within a specified fiscal year. Eventually, the research currently being conducted will allow investigators to develop algorithms to compare pre-PPS and PPS FIM instrument items in a standardized manner. Moving forward, research is needed to evaluate the comprehensive, long-term healthcare needs of patients with lower extremity joint replacement. Combining information from intensive rehabilitation services with costs and outcomes data from other components across the continuum of care will provide a better understanding of the current trends in rehabilitative care and how they affect patients and their families.
Acknowledgments
This work was funded in part by grants H133G080163 (Ottenbacher, PI) and H133F090030 (Graham) from the National Institute on Disability and Rehabilitation Research, U.S. Department of Education. Dr. Reistetter was supported by K12HD055929 from the NIH. The FIM® instrument is a registered trademark of the Uniform Data System for Medical Rehabilitation, a division of UB Foundation Activities, Inc.
Footnotes
Disclosures:
Financial disclosure statements have been obtained, and no conflicts of interest have been reported by the authors or by any individuals in control of the content of this article.
REFERENCES
- 1.Granger CV, Markello SJ, Graham JE, Deutsch A, Reistetter TA, Ottenbacher KJ. The Uniform Data System for Medical Rehabilitation: Report of Patients with Traumatic Brain Injury Discharged from Rehabilitation Programs in 2000–2007. Am J Phys Med Rehabil. 2010;89(4):265–278. doi: 10.1097/PHM.0b013e3181d3eb20. [DOI] [PMC free article] [PubMed] [Google Scholar]
- 2.Granger CV, Markello SJ, Graham JE, Deutsch A, Ottenbacher KJ. The uniform data system for medical rehabilitation: report of patients with stroke discharged from comprehensive medical programs in 2000–2007. Am J Phys Med Rehabil. 2009;88(12):961–972. doi: 10.1097/PHM.0b013e3181c1ec38. [DOI] [PubMed] [Google Scholar]
- 3.Granger CV, Hamilton BB. The Uniform Data System for Medical Rehabilitation Report of First Admissions for 1990. Am J Phys Med Rehabil. 1992;71(2):108–113. [PubMed] [Google Scholar]
- 4.Granger CV, Hamilton BB. The Uniform Data System for Medical Rehabilitation report of first admissions for 1991. Am J Phys Med Rehabil. 1993;72(1):33–38. doi: 10.1097/00002060-199302000-00008. [DOI] [PubMed] [Google Scholar]
- 5.Granger CV, Hamilton BB. The Uniform Data System for Medical Rehabilitation report of first admissions for 1992. Am J Phys Med Rehabil. 1994;73(1):51–55. [PubMed] [Google Scholar]
- 6.Granger CV, Ottenbacher KJ, Fiedler RC. The Uniform Data System for Medical Rehabilitation. Report of first admissions for 1993. Am J Phys Med Rehabil. 1995;74(1):62–66. doi: 10.1097/00002060-199501000-00011. [DOI] [PubMed] [Google Scholar]
- 7.Fiedler RC, Granger CV, Ottenbacher KJ. The Uniform Data System for Medical Rehabilitation: report of first admissions for 1994. Am J Phys Med Rehabil. 1996;75(2):125–129. doi: 10.1097/00002060-199603000-00010. [DOI] [PubMed] [Google Scholar]
- 8.Fiedler RC, Granger CV. Uniform data system for medical rehabilitation: report of first admissions for 1995. Am J Phys Med Rehabil. 1997;76(1):76–81. doi: 10.1097/00002060-199701000-00017. [DOI] [PubMed] [Google Scholar]
- 9.Fiedler RC, Granger CV. Uniform data system for medical rehabilitation: report of first admissions for 1996. Am J Phys Med Rehabil. 1998;77(1):69–75. [PubMed] [Google Scholar]
- 10.Fiedler RC, Granger CV, Russell CF. Uniform Data System for Medical Rehabilitation: report of first admissions for 1997. Am J Phys Med Rehabil. 1998;77(5):444–450. doi: 10.1097/00002060-199809000-00019. [DOI] [PubMed] [Google Scholar]
- 11.Fiedler RC, Granger CV, Post LA. The Uniform Data System for Medical Rehabilitation: report of first admissions for 1998. Am J Phys Med Rehabil. 2000;79(1):87–92. doi: 10.1097/00002060-200001000-00017. [DOI] [PubMed] [Google Scholar]
- 12.Deutsch A, Fiedler RC, Granger CV, Russell CF. The Uniform Data System for Medical Rehabilitation report of patients discharged from comprehensive medical rehabilitation programs in 1999. Am J Phys Med Rehabil. 2002;81(2):133–142. doi: 10.1097/00002060-200202000-00010. [DOI] [PubMed] [Google Scholar]
- 13.Dodds TA, Martin DP, Stolov WC, Deyo RA. A validation of the functional independence measurement and its performance among rehabilitation inpatients. Arch Phys Med Rehabil. 1993;74(5):531–536. doi: 10.1016/0003-9993(93)90119-u. [DOI] [PubMed] [Google Scholar]
- 14.Ottenbacher KJ, Hsu Y, Granger CV, Fiedler RC. The reliability of the functional independence measure: a quantitative review. Arch Phys Med Rehabil. 1996;77(12):1226–1232. doi: 10.1016/s0003-9993(96)90184-7. [DOI] [PubMed] [Google Scholar]
- 15.Segal ME, Gillard M, Schall R. Telephone and in-person proxy agreement between stroke patients and caregivers for the functional independence measure. Am J Phys Med Rehabil. 1996;75(3):208–212. doi: 10.1097/00002060-199605000-00013. [DOI] [PubMed] [Google Scholar]
- 16.Inpatient Rehabilitation Facility Patient Assessment Instrument (IRF-PAI) Training Manual. Buffalo, NY: Uniform Data System for Medical Rehabilitation; 2001. [Google Scholar]
- 17.Carter GM, Relles DA, Ridgeway GK, Rimes CM. Measuring function for Medicare inpatient rehabilitation payment. Health Care Financ Rev. 2003;24(3):25–44. [PMC free article] [PubMed] [Google Scholar]
- 18.Deutsch A, Granger C, Russel C, Heinemann A, Ottenbacher K. Apparent changes in inpatient rehabilitation facility outcomes due to change in the definition of program interuption. Arch Phys Med Rehabil. 2008;89:2274–2277. doi: 10.1016/j.apmr.2008.06.014. [DOI] [PubMed] [Google Scholar]
- 19.Granger CV, Deutsch A, Russell C, Black T, Ottenbacher KJ. Modifications of the FIM instrument under the inpatient rehabilitation facility prospective payment system. Am J Phys Med Rehabil. 2007;86(11):883–892. doi: 10.1097/PHM.0b013e318152058a. [DOI] [PubMed] [Google Scholar]
- 20.UB Foundation Activities. The Inpatient Rehabilitation Facility - Patient Assessment Instrument (IRF-PAI) Training Manual. 2004 http://www.cms.hhs.gov/InpatientRehabFacPPS/downloads/irfpaimanual040104.pdf; Available from: Centers for Medicare and Medicaid Services.
- 21.Carter GM, Buchanan JL, Buntin MB, Hayden O, Paddock S, Relles DA, et al. Executive Summary of Analyses for the Initial Implementation of the Inpatient Rehabilitation Facility Prospective Payment System. Santa Monica, CA: Rand Corporation; 2002. [Google Scholar]
- 22.US Department of Education. Federal Register. No. 154. Vol. 73. Washington, DC: 2008. Aug 8, [Google Scholar]
- 23.US Department of Education. Federal Register. No 89. Vol 69. Washington, DC: 2004. May 7, [Google Scholar]
- 24.US Department of Education. Federal Register. No. 151. Vol. 74. Washington, DC: 2009. Aug 7, [Google Scholar]
- 25.Centers for Disease Control and Prevention. Racial Disparities in Total Knee Replacement Among Medicare Enrollees -- United States. Morbidity and Mortality Weekly Report. 2000–2006;58(06):133–138. 2-20-2009. [PubMed] [Google Scholar]
- 26.DeFrances CJ, Cullen KA, Kozak LJ. National Hospital Discharge Survey: 2005 annual summary with detailed diagnosis and procedure data. Vital and Health Statistics. 2007;13(165) [PubMed] [Google Scholar]
- 27.Stineman MG, Maislin G, Fiedler RC, Granger CV. A prediction model for functional recovery in stroke. Stroke. 1997;28(3):550–556. doi: 10.1161/01.str.28.3.550. [DOI] [PubMed] [Google Scholar]


