

Abstract
BACKGROUND
High fat diets are known to be a risk factor for prostate cancer. In this study, we investigated the effect of high fat diet on mouse prostate gene expression.
METHODS
C57BL/6J mice were fed either a control or high fat diet for 12 weeks. Microarray analyses were performed on mouse ventral prostate (VP) and dorsolateral prostate (DLP), followed by canonical pathway analysis and regulatory network identification. mRNA changes were confirmed by real time PCR.
RESULTS
Approximately 2,125, and 1,194 genes responded significantly to the high fat diet in VP, DLP, respectively. Pathways and networks related to oxidative stress, glutathione metabolism, NRF-mediated oxidative stress response and NF-kappaB were all differentially regulated by high fat diet. GPx3 mRNA levels were decreased by approximately 2-fold by high fat diet in all 3 prostate lobes. In human non-transformed prostate cells (PrSC, PrEC and BPH-1), cholesterol loading decreased GPx3 expression, and increased H2O2 levels of culture medium. Troglitazone increased GPx3 expression in 3 normal prostate cells, and decreased H2O2 levels. In addition, troglitazone attenuated cholesterol-induced H2O2 increase. Tissue from prostate cancer biopsies had decreased GPx3 mRNA and its level was inversely related to the Gleason score.
CONCLUSIONS
High fat diet alters pathways related to many genes concerned with oxidative stress. GPx3, a gene identified by this analysis, was found to be down regulated by high fat diet and appears be decreased in human prostate cancers, suggesting that GPx3 may have a possible role in modulating carcinogenesis.
Keywords: high fat diet, prostate, GPx3, cholesterol, mouse
INTRODUCTION
The incidence of clinically apparent prostate cancer is significantly higher in Western countries than in most Asian countries [1], although the incidence of latent undetected prostate cancer is very similar between the two groups [2]. Interestingly, first generation Japanese immigrants to the United Stated show a 5-fold increase incidence in prostate cancer [3]. A large component of this increased risk has been attributed to differences in the diet between western versus Asian countries. Like other cancers, such as breast and colon cancer [4], high fat diet may be an environmental factor that contributes to the pathogenesis of prostate cancer [5, 6].
High-fat western-style diets that are also low in calcium and vitamin D have been shown to induce epithelial cell proliferation in the prostate of C57BL/6J mice after 9 weeks [7], and increased dietary cholesterol promotes carcinogenesis in prostate of ACI/Seg rats after 80 weeks [8]. In a xenograft model of prostate cancer cells, high fat diet was also found to induce tumor growth [9,10]. Not all animal studies, however, have consistently shown a link between high fat or high cholesterol diet [11, 12].
One of the possible mechanisms for how high fat diet can promote carcinogenesis is increased oxidative stress. Increased formation of reactive oxygen species (ROS) has been observed in various tissues from mice on high fat diets [13], including the prostate [8, 14]. ROS may promote carcinogenesis by either directly damaging DNA or by the production of lipid peroxides, which then stimulate the production of various cytokines that increase cell proliferation [15,16]. Some studies have shown that high cholesterol diets also promote oxidative stress in mouse and rat prostate [8, 14], and promote prostate carcinogenesis by the formation of lipid peroxides [17].
In this study, we investigated the effect of high fat diet on gene expression in mice. From this analysis, we identified at least one protein, glutathione peroxidase 3 (GPx3), which is decreased in response to high fat diet, and leads to increased ROS production. GPx3 was also observed to be decreased in several human non-transformed prostate cell lines in response to cholesterol loading, and its level of expression was found to be inversely related to the Gleason score of prostate cancer biopsy samples.
MATERIALS AND METHODS
Cells and Chemicals
The normal human prostate epithelial cells (PrEC) and stromal cells (PrSC) were purchased from Lonza (Walkersville, MD). BPH-1, a human prostate epithelial cell line, was kindly provided by SW Hayward at Vanderbilt University Medical Center (Nashville, TN). PrEC was cultured in PrEGM (Lonza), PrSC in SCBM, and BPH-1 in RPMI1640 (Sigma, St. Louis, MO), supplemented with 10 % FBS (Moregate, Bulimba, Australia). Cholesterol, troglitazone and Lipoprotein Deficient Serum from fetal calf (LPDS) were purchased from Sigma.
Animals and Diets
Twenty male C57BL/6J mice (Taconic, Hudson, NY), 8-weeks of age, were housed 5 mice per cage in a pathogen-free facility. All mice were fed ad libitum, with a standard control diet (NIH31 chow diet; 14% from fat, Zeigler Brothers Inc., Gardners, Pennsylvania, USA) for 1 week and then randomized to either the control diet (control diet group) or a high fat diet (TD.88137 Adjusted Calories Diet; 42% from anhydrous milk fat, Harlan, Indianapolis, IN) (high fat diet group) (supplemental table I). Blood samples were collected from the peri-orbital sinus, with a heparinized capillary tube (50 or 250 μL). Mice were checked daily, and weighed weekly. After 12-weeks, the ventral (VP), dorsolateral (DLP) and anterior (AP) prostate lobes from both groups were removed and placed in RNase-free PBS and snapped-frozen in liquid nitrogen and stored at -70 °C. All animal studies were approved by the Animal Care and Use Committee from each institution (protocols H-0050R2, National Heart, Lung, and Blood Institute). Total cholesterol (Wako Chemicals, Richmond, VA), triglycerides (Roche, Indianapolis, IN) and phospholipid (Wako) of mouse serum were determined enzymatically, using a Victor3 plate reader (Perkin-Elmer).
Microarray
Total RNA of each lobe was isolated, using miRNeasy Mini Kit (Qiagen, Valencia, CA). RNA quality and quantity were measured by a NanoDrop spectrophotometer (Thermo Fisher Scientific, Wilmington, DE). For microarray analysis, we examined VP (control diet; n=5, high fat diet; n=5) and DLP (control diet; n=5, high fat diet; n=4). T7 based RNA amplification was carried out on 200ng of the isolated total RNA as suggested by the manufacturer (Affymetrix, Palo Alto, CA). Briefly, total RNA was incubated with oligo dT/T7 primers and reverse transcribed into double stranded cDNA. In vitro transcription and biotin labeling of the purified cDNA was performed, using T7 RNA polymerase at 37°C for 16 using affymetrix's IVT Express labeling kit following the manufacturer's directions. The yield and integrity of the biotin labeled cRNA were determined using the nanodrop ND-1000 spectrophotometer and the Agilent 2100 bioanalyzer. 20μg of biotin labeled RNA was fragmented to ~200 bp size by incubating in fragmentation buffer containing 200 mM Tris-Acetate pH 8.2, 500 mM Potassium Acetate and 500 Magnesium Acetate for 35 minutes at 94°C prior to hybridization. Fragmented RNA was assessed for the fragment size on the Agilent 2100 bioanalyzer and hybridized to affymetrix mouse genome 430 2.0 chips for 16 hours, washed and stained on an affymetrix fluidics station. Affymetrix GCOS version 1.4 was used to calculate the signal intensity and the percent present calls on the hybridized Affymetrix chip. The signal intensity values obtained for probe sets in the microarrays were transformed, using an adaptive variance-stabilizing, quantile-normalizing transformation31. Transformed data from all the chips were subjected to a principal component analysis (PCA) to detect outliers. To address the multiple comparisons, fold-cut off filters and false discovery rate (FDR) analysis filters were applied. Two-way hierarchical clustering was used to bring together sets of samples and genes with similar expression patterns. The hierarchical cluster was run from the JMP5.1 statistical software package (SAS Institute, Cary, NC), using the ward method. Differentially regulated genes (≥2-fold change) were identified with an estimated 20% false discovery rate (FDR) and presence of the genes in control diet and/or high fat diet. The microarray gene expression data has been submitted to the Gene Expression Omnibus (Geo) database (http://www.ncbi.nlm.nih.gov/geo/: Account number: GSE26464).
Network identification and canonical pathway analysis of microarray data
Data were analyzed by Ingenuity Pathways Analysis (Ingenuity® Systems, www.ingenuity.com). The genes significantly differentially regulated by high fat diet (P-valued < 0.05, fold change > 1.2, no FDR applied) were used. Each gene identifier was mapped to its corresponding gene object, using the Ingenuity Pathways Knowledge Base. These genes, called focus genes, were then overlaid onto a global molecular network and networks of these focus genes were ranked algorithmically based on their connectivity. Right-tailed Fisher's exact test was used to calculate p-values based on the probability that each biological function and/or disease assigned to that network is due to chance alone. A score is calculated based on the likelihood that a cluster of genes equal to or greater than the number in a network is purely chance. The significance of the association between the data set and a canonical pathway was measured in 2 ways: 1) a ratio of the number of genes from the data set that map to the pathway divided by the total number of genes that map to the canonical pathway, and 2) a Fischer's exact test was used to calculate a p-value based on the probability that the association between the genes in the dataset and the canonical pathway is explained by chance alone.
Quantification of mRNA levels
mRNA levels were quantified, using a 7300 Real Time PCR System (Applied Biosystems, Austin, TX). cDNA synthesis was performed [18] and PCR amplification was done, using 2 μL of cDNA and GPx3, Crabp1 and Cyp2b10 primer (Applied Biosystems). Next, PCR was performed for one cycle of 10 min at 95 °C followed by 40 cycles of 15 s at 95 °C and 60 s at 60 °C. For the internal control, mouse GAPD (Applied Biosystems) transcript levels were used. Quantitation of mRNA fold changes was done, using the comparative CT (2-Δ ΔCt) cycle (ΔCt) method [19].
Measurement of H2O2 level
H2O2 levels in culture medium were measured, using Amplex Red Hydrogen Peroxide/Peroxidase Assay kit (Invitrogen, Eugene, OR). Briefly, 50 μL of culture medium were put into individual wells of a microplate. Working solution with 100 μM Amplex red and 0.2 U/mL HRP was then added to each microplate well, and the fluorescent emission at 600 nm with excitation at 560 nm was read after 30 min. H2O2 levels were expressed as fold change over the control. A representative experiment of at least two independent experiments is shown in each figure.
siRNA Transfection Experiments
Cells were seeded into a 96-well microtiter plate in 100 μL with 10 % FBS. Thereafter, cells were transfected with ON-TARGETplus Non-targeting Pool (Dharmacon, Waltham, MA, USA) or ON-TARGETplus GPx3 siRNA (Dharmacon), using DharmaFect (Dharmacon). After transfection, the cells were incubated for 48 h at 37 °C in a 5% CO2 atmosphere.
Prostate biopsy sample analysis
Prostate biopsy samples from 64 patients were collected at Gunma University hospital between 2002-2007. 20 patients had benign prostatic hyperplasia, 22 had prostate cancer, with a Gleason score of 7, 22 had prostate cancer with a Gleason score from 8 to 10. None had received any therapy before prostate biopsy. The study was approved by the Ethical Committee of Gunma University. GPx3 mRNA levels were measured in prostate biopsy samples, using a quantitative real-time PCR, as already described and 18s RNA was used as a control. The following are the primer sequences for 18s RNA: 18s rRNA: forward, 5’-CGG CTA CCA CAT CCA AGG AA-3’, reverse, 5’-GCT GGA ATT ACC GCG GCT GC-3’.
Statistical analysis
All data, unless otherwise indicated, are expressed as the mean + 1 SD. Differences between the values were evaluated either by Unpaired t-test for 2 groups or one-way analysis of variance (one-way ANOVA), with Tukey's post-hoc analysis for more than 3 groups. In all analyses, p < 0.05 was considered statistically significant.
RESULTS
Effect of high fat diet on mouse lipids and prostate tissue
C57BL/6J mice on the high fat diet had nearly a 2-fold increase in total cholesterol, but decreased serum triglycerides (Fig. 1A). In the high fat diet group, the body weight was significantly higher than controls (Fig. 1B). No difference was observed in the weight of any of the three prostate lobes between mice on the control and high fat diet (Fig. 1C). Mice on the high fat diet had normal appearing prostate tissue when examined histologically by H&E staining and did not microscopically differ from the control group (data not shown).
Fig. 1. Effect of high fat diet on lipids and body weight of mice.

A: Effect of high fat diet on total cholesterol (TC), triglyceride (TG) and phospholipid (PL) at 12 weeks. (control; n=10, high fat diet; n=10) *P<0.01. B, C: Effect of high fat diet on mouse body (B) and prostate (C) weight. Weights were measured at 12 weeks (control; n=10, high fat diet; n=10). HFD; high fat diet, VP; ventral prostate, DLP; dorsolateral prostate, AP; anterior prostate. *P<0.01.
Microarray analysis of VP and DLP from mouse prostate
Microarray analysis was done on the VP and DLP of mice, which has been reported to be equivalent of human prostate peripheral zone where many tumors arise [20], although other studies have not supported a direct relationship between mouse prostate lobes and the specific zones in the human prostate [21]. Microarray data analysis picked up 2125 genes from VP, and 1194 genes from of DLP that were differentially regulated by the high fat diet (p < 0.05, fold change > 1.2) (Fig. 2 and supplemental Table II). Approximately, an equal number of genes were up or down regulated. Although there were a relatively large number of genes that changed in response to the high fat diet, only a limited number of genes changed more than 2-fold (Fig. 2).
Fig. 2. Scatter plot of gene expression.

The scatter blots show gene expression levels of the control (x-axis) and the high fat diet (Y-axis). Fold changes of mRNA levels were presented. Red line shows 2-fold change in the two groups.
Canonical pathway and regulatory network analysis
Canonical pathways
In VP, changes in 8 metabolic (Fig. 3A) and 10 signaling (Fig. 3B) pathways were observed, whereas for DLP changes in 6 metabolic (Fig. 3C) and 9 signaling (Fig. 3D) pathways were observed. Only changes in the Endoplasmic reticulum stress pathway, however, were shared between the two lobes. The pathway related to N-glycan degradation was the most altered in VP, whereas Glutathione metabolism pathway was the most altered in DLP.
Fig. 3. Canonical pathways and regulatory network analysis.


Metabolic and signaling pathways regulated by high fat diet based on their significance in VP (A and B) and DLP (C and D). Bars indicate P-values and solid line indicates the ratio of the number of genes from the data set that map to the pathway divided by the total number of genes that map to the canonical pathway.
Regulatory network analysis
Differential expressed genes organized into networks associated with lipid metabolism, cell signaling and cancer (Supplemental table IIIA-C, IVA-C). The most significant network of up-regulated genes by high fat diet was centered around glutathione and NRF-mediated oxidative stress response related genes in VP (Fig. 4A), and centered on NF-kappaB in DLP (Fig. 4B).
Fig. 4. Network analysis of differentially regulated genes.


Network analysis of up-regulated genes by high fat diet in VP (A) and DLP (B) compared with control diet. The intensity of the node color indicates the degree of up- (red) regulation. The biological functions that were most significant to the genes in these networks were Molecular Transport, Lipid Metabolism and Small Molecule Biochemistry (A), Cancer, Behavior and Nervous System Development and Function (B), respectively.
Gene expression changes in mouse prostate
To identify candidate genes affected by high fat diet, the criteria of fold change more than 2, FDR value less than 0.2, and presence of the genes were adopted for gene selection. 4 genes were either up regulated or down regulated more than 2-fold in VP by the high fat diet (Table I). Although in most cases they showed the same trends, none of these genes showed statistically significant changes when DLP was analyzed by microarray analysis, as shown in Table II. For validation, quantitative RT-PCR analysis was performed for three of the identified genes. Yipf5 was not further examined because of limited knowledge of its function [22]. By RT-PCR, Glutathione peroxidase 3 (GPx3) mRNA was significantly decreased by high fat diet not only in VP, but also in DLP, as shown in Table II. In addition, GPx3 expression was also decreased by high fat diet in AP. GPx3 is a secretory protein and a member of glutathione peroxidase family, which converts glutathione to oxidized glutathione and in the process consumes H2O2 [23]. Crabp1, another one of the differentially regulated genes (Table 1), is a cellular retinoic acid binding protein and modulates retinoic acid (RA)-induced differentiation [24], as well as tumor-suppressor function [25]. Although Crabp1 mRNA was decreased significantly in VP by RT-PCR, no significant changes were observed in either DLP or AP. Concerning Cyp2b10, a cytochrome P450 family member [26], the fold change in VP mRNA by RT-PCR was similar to the 2-fold change observed with the microarray analysis but it did not reach statistical significance (p=0.09) and either the opposite or no change was observed in the other lobes. Because GPx3 showed the most consistent changes in gene expression in all 3 lobes and pathways related to glutathione and oxidation were predicted to be altered by the microarray analysis (Fig. 3 and 4), it was the only gene further investigated.
TABLE I.
Differentially expressed genes in VP of high fat diet groups compared with control
TABLE II.
Genes from microarrays selected for verification by qPCR
| Genes | Lobe | Fold Change (qPCR) | Fold Change (Array) |
|---|---|---|---|
| GPx3 | |||
| VP | -2.38* | -2.22 | |
| DLP | -2.94* | -3.03 | |
| AP | -2.00* | - | |
| Crabpl | |||
| VP | -2.13* | -2.44 | |
| DLP | -1.69 | -1.03 | |
| AP | 1.28 | - | |
| Cyp2b10 | |||
| VP | 2.13 | 2.08 | |
| DLP | -1.69 | -1.67 | |
| AP | 2.22 | - |
p<0.05
Effect of cholesterol loading on GPx3 expression in non-transformed human prostate cells
Because high fat diet increased plasma cholesterol (Fig. 1) and dietary cholesterol was previously described to promote prostate carcinogenesis in rats [8], we examined the effect of cholesterol loading on GPx3 gene expression in human prostate cells. Three non-transformed prostate cell lines, namely PrEC, PrSC and BPH-1, were loaded with cholesterol by incubation with cyclodextrin-cholesterol complexes. At the highest doses tested, cholesterol loading decreased by nearly half GPx3 mRNA levels in all three prostate cell lines (Fig. 5A). Moreover, H2O2 levels in culture medium were significantly increased after cholesterol loading in all 3 prostate cell cells (Fig. 5B). When GPx3 expression was reduced by siRNA transfection (Fig. 5C), H2O2 was found to be increased in cell culture media of PrSC and BPH-1 cells (Fig. 5D), consistent with the known role of GPx3 in lowering H2O2 levels. No effect on GPx3 gene expression or H2O2 levels was observed after transfection with a control siRNA (Fig. 5C, D).
Fig. 5. Effect of Cholesterol on GPx3 expression in normal human prostate cells.

A, B: PrEC, PrSC and BPH-1 cells were incubated with the medium containing 10 % LPDS for 24 h, and medium was switched to the indicated concentration of cholesterol in the medium containing 10% LPDS. After 48 h, total cell mRNA was extracted and GPx3 mRNA levels were measured by real-time PCR (n=3) *P<0.05 vs 0 μg/ml (A), or culture medium were collected to measure H2O2 levels (n=4) *P<0.01 vs 0 μg/ml (B). Values are expressed as the mean +SD. C, D: Mock transfected cells or cells transfected with GPx3 siRNA or negative control siRNA cells were incubated for 48 h before harvest for real time PCR (n=3) (C), or for 72 h before collecting culture medium for H2O2 measurement (n=4) (D). Values are expressed as the mean +SD. *P<0.01 vs negative (N).
Effect of troglitazone on GPx3 expression in human prostate cells
Troglitazone, which has been reported to increase GPx3 expression in human skeletal muscle cell [27], was found to also increase GPx3 mRNA expression in a dose dependent manner in all 3 human non-transformed prostate cells (Fig. 6A). Troglitazone treatment also decreased H2O2 levels in cell culture media for all three cell lines (Fig. 6B). Furthermore, troglitazone blocked the increase of H2O2 levels observed after treatment with cholesterol loading in BPH-I cells (Fig. 6C).
Fig. 6. Effect of troglitazone on GPx3 expression in human prostate cells.

A, B: PrEC, PrSC and BPH-1 cells were incubated with the medium containing 10 % FBS for 24 h, and medium was switched to the indicated concentration of troglitazone in the medium containing 10% FBS. After 48 h, total cell mRNA was extracted and GPx3 mRNA levels were measured by real-time PCR (n=3) *P<0.05 vs 0 μM (A), or culture medium were collected to measure H2O2 levels (n=4) *P<0.01 vs 0 μM (B). Values are expressed as the mean +SD. C: BPH-1 cells were incubated with the medium containing 10 % LPDS for 24 h, and cholesterol was added to cholesterol (Chol) and Chol/troglitazone groups at 50 μg/mL. After 24 h, troglitazone was added to cholesterol/troglitazone group at 10 μM. Culture medium was collected to measure H2O2 levels after 48 h (n=4). *P<0.01.
GPx3 gene expression in human prostate tissue
To determine the possible relevance of the observed changes in GPx3 expression observed in mice for human prostate tissue, GPx3 mRNA levels were examined by RT-PCR in 64 prostate biopsy samples. It is reported that the expression of GPx3 was widely inactivated in prostate cancer samples by gene methylation [28]. Compared to biopsy samples from patients with benign prostatic hyperplasia, samples with Gleason score 7 prostate cancer had on average 40% of the level of GPx3 mRNA observed in BPH samples (Fig. 7). Biopsy samples from patients with more advanced cancer, greater than Gleason score 8, had an even further decrease in GPx3 mRNA and contained less than 15% of the levels observed in BPH samples. Furthermore, as previously described [28], GPx3 mRNA was undetectable in three different human prostate cancer cell lines examined, namely PC-3, DU145 and LNCaP cells (data not shown).
Fig. 7. GPx3 gene expression in prostate biopsy samples.
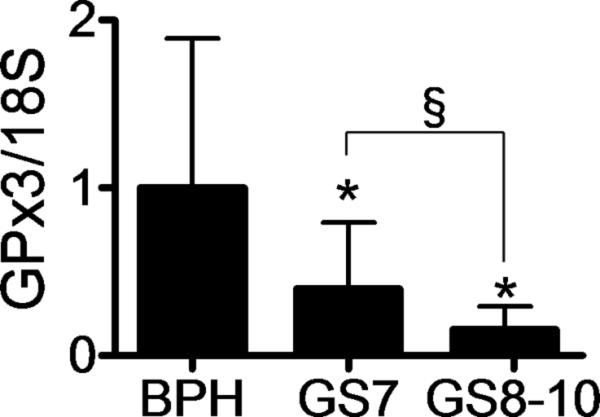
mRNA expression of GPx3 in benign prostate hypertrophy (BPH; n=20), Gleason score 7 (GS7; n=22) and Gleason score 8-10 (GS8-10; n=22) were evaluated by real time PCR. Expression values were expressed as the fold change compared to BPH. Values are expressed as the mean +SD. *P<0.01 vs BPH. §P=0.01.
DISUCUSSION
The main findings from this study are the following: (1) high fat diet decreased GPx3 gene expression in mouse prostate, (2) cholesterol loading of human non-transformed prostate cell lines decreased GPx3 mRNA, which was associated with increased H2O2 in cell culture media, (3) troglitazone increases GPx3 mRNA in prostate cells and lowered H2O2 in media, and (4) GPx3 expression was markedly reduced in advanced human prostate cancer biopsy samples. Overall, these results suggest that GPx3 may provide a mechanistic link for the association of prostate cancer with high fat diets.
Although high cholesterol diet was found to increase the incidence of prostate cancer in rats [8], we did not observe in this study any histological changes in the prostate of mice on a high fat diet, which was relatively enriched with fatty acids over cholesterol. This may be due differences in the diets of the two studies and to the much longer length of the rat study, 80 weeks versus 12 weeks. A mouse study of high fat diet did observe epithelial proliferative changes in the prostate after 8 weeks, but the diet in that study was also low in calcium and in vitamin D [7]. We did observe, however, numerous gene changes on the high fat diet in mice, which may be relevant to understanding the gene expression changes prior to the development of prostate cancer.
Network analysis revealed that high fat diet upregulated genes related to glutathione metabolism and NRF2-mediated oxidative stress in VP (Fig. 4A). Glutathione plays a critical role as an anti-oxidant in numerous biological processes, such as the synthesis of proteins and DNA, in amino acid transport, and in the protection of cells against oxidation. In addition, cellular levels of hydrogen peroxide, which can lead to oxidative damage of DNA, are reduced by glutathione peroxidase [29]. Nrf2 is a helix–loop–helix basic leucine zipper transcription factor, which regulates the expression of detoxifying and antioxidant enzymes by binding to the antioxidant-response element in the promoter region of many cellular defense genes [30]. Knockout of NRF2 makes mice highly susceptible to oxidative damages and/or carcinogenesis [31]. Concerning DLP, high fat diet up-regulated genes centered on NF-kappaB (Fig. 4B). NF-kappaB is also crucial in many cellular processes, such as inflammation, immunity, cell proliferation and apoptosis [32]. A signaling pathway leading to NF-kappaB activation by H2O2 has also been reported [32]. High fat diets have also been found to increase NF-kappaB signaling and oxidative stress in mouse prostate [14], as well as increased ROS formation [13].
In this study, decreased gene expression of GPx3 in response to the high fat diet was the most consistent observation across all the mouse prostate lobes tested. There are 7 isoforms of GPx in mammals [33], and in general they are all believed to play important roles as anti-oxidants by using glutathione to reduce levels of H2O2. GPx3 is a secretory protein and is found in the plasma and possibly other extracellular fluids [33]. It decomposes H2O2 and peroxidized molecules in the plasma compartment and therefore reduces oxidative stress [23]. In mouse adipose tissue, GPx3 expression was suppressed under prooxidative conditions, such as during hypoxia or treatment with TNFα [34]. GPx3 expression is also decreased in obesity [35]. Similar to what was found for the prostate in this study, high fat diet has been reported to also decrease GPx3 expression in mouse adipose tissue [34] and mouse skeletal muscle [33]. In canonical pathways and regulatory network analysis, many genes concerned with ROS are differentially regulated by high fat diet, which suggest that local accumulation of ROS by high fat diet may be responsible for reduced GPx3 expression in mouse prostate. It is unclear from all these studies, however, why GPx3, an anti-oxidant gene would decrease in response to oxidative stress, but once this occurs it may lead to further amplification of the cellular damage caused by oxidation.
To further examine the role of GPx3, we used 3 human non-transformed prostate cell lines, PrEC, PrSC, and BPH-1. PrEC cells are derived from epithelial cells, whereas PrSC are from prostate stromal cells. BPH-1 cells are used as a model of benign prostatic hyperplasia [36]. Knocking down of GPx3 expression by siRNA transfection increased H2O2 levels in the culture medium of all 3 of these cell lines, which is consistent with the known ability of GPx3 to consume H2O2. It is known that superoxide can be produced by a variety of cells that have been implicated in the inflammatory responses to hypercholesterolemia, including endothelial cells [37]. Cholesterol-loading of cells, which may also occur with high fat diets, also decreased the expression of GPx3 in these cell lines and increased H2O2 levels in cell culture media (Fig. 5A, 5B). Treatment with TNFα, which triggers prooxidative conditions, also decreased GPx3 expression (data not shown). These data suggest that decreased GPx3 expression from local ROS accumulation in response to high fat diet or increased cellular cholesterol may induce further oxidative stress in the same manner as described in adipose tissue during obesity [35].
The PPARγ ligand, troglitazone, which is used to treat diabetes [38], markedly increased GPx3 expression in the prostate cancer cell lines (Fig. 6) like it has been reported to do for human skeletal muscle cells [27]. It may also have a direct anti-oxidant scavenging activity on free radicals [39], which may explain the seeming disproportionate effect it had on reducing H2O2 levels (Fig. 7B) compared to its ability to induce GPx3 (Fig. 6). Based on the possible favorable effects of troglitazone in preventing prostate cancer, diabetic patients treated with thiazolidinediones were previously examined for a possible reduction in the incidence of prostate cancer, but no such benefit was observed [40].
Interestingly, GPx3 was recently reported to be a novel tumor suppressor gene of human prostate cancer [28]. Similar to what we observed in the three prostate cancer cell lines, prostate cancer samples frequently show decreased expression of GPx3 because of gene methylation [28]. We confirmed this finding in human prostate tissue and found that GPx3 expression was inversely related to the Gleason score (Fig. 8). Past studies have also shown that over expression by transfection of the GPx3 gene into PC-3 cells suppressed tumor growth and metastasis both in vitro and in vivo [28]. How exactly GPx3 modulates cancer initiation is not known, but one likely possibility is that by acting as an anti-oxidant and consuming ROS, such as H2O2, it may prevent oxidative damage and mutations in DNA [15,16]. In a xenograft model of prostate cancer cells, some reports showed that high fat diet induced tumor growth [9,10]; therefore, decreased GPx3 expression may also somehow accelerate the growth of existing prostate cancer cells.
In summary, high fat diets are a known risk factor for prostate cancer, and we identified at least one gene that is differentially regulated by high fat diets and could participate in the initiation of prostate cancer development. More in vivo animal studies that focus on modulating GPx3 expression with either drugs, such as troglitazone, or by genetic manipulation will be needed to definitively establish the role of GPx3 in prostate cancer. If GPx3 is further implicated to play a role in prostate cancer, it may become a new drug target for developing new strategies for the prevention and or treatment of prostate cancer.
Supplementary Material
Acknowledgements
Research by ART and YS was supported by intramural NHBLI funding from the National Institutes of Health. The authors thank ML Sampson (Department of Laboratory Medicine, Clinical Center, National Institutes of Health, Bethesda, MD) and Naomi Takase (Gunma University, Maebashi, Japan) and the NHLBI Microarray Core laboratory for technical assistance.
Footnotes
Conflict of interest statement
No potential conflicts of interest were disclosed.
REFERENCE
- 1.Hsing AW, Tsao L, Devesa SS. International trends and patterns prostate cancer incidence and mortality. Int J Cancer. 2000;85:60–67. doi: 10.1002/(sici)1097-0215(20000101)85:1<60::aid-ijc11>3.0.co;2-b. [DOI] [PubMed] [Google Scholar]
- 2.Yatani R, Kusano I, Shiraishi T, Hayashi T, Stemmermann GN. Latent prositatic carcinoma: pathological and epidemiological aspects. Jpn J Clin Oncol. 1989;19:319–326. [PubMed] [Google Scholar]
- 3.Grönberg H. Prostate cancer epidemiology. Lancet. 2003;361:859–864. doi: 10.1016/S0140-6736(03)12713-4. [DOI] [PubMed] [Google Scholar]
- 4.Law M. Dietary fat and adult diseases and the implications for childhood nutrition: an epidemiologic approach. Am J Clin Nutr. 2000;72:1291S–1296S. doi: 10.1093/ajcn/72.5.1291s. [DOI] [PubMed] [Google Scholar]
- 5.Mills PK, Beeson WL, Phillips RL, Fraser GE. Cohort study of diet, lifestyle, and prostate cancer in Adventist men. Cancer. 1989;64:598–604. doi: 10.1002/1097-0142(19890801)64:3<598::aid-cncr2820640306>3.0.co;2-6. [DOI] [PubMed] [Google Scholar]
- 6.Giovannucci E, Rimm EB, Colditz GA, Stampfer MJ, Ascherio A, Chute CC, Willett WC. A prospective study of dietary fat and risk of prostate cancer. J Natl Cancer Inst. 1993;85:1571–1579. doi: 10.1093/jnci/85.19.1571. [DOI] [PubMed] [Google Scholar]
- 7.Xue L, Lipkin M, Newmark H, Wang J. Influence of dietary calcium and vitamin D on diet-induced epithelial cell hyperproliferation in mice. J Natl Cancer Inst. 1999;91:176–181. doi: 10.1093/jnci/91.2.176. [DOI] [PubMed] [Google Scholar]
- 8.Homma Y, Kondo Y, Kaneko M, Kitamura T, Nyou WT, Yanagisawa M, Yamamoto Y, Kakizoe T. Promotion of carcinogenesis and oxidative stress by dietary cholesterol in rat prostate. Carcinogenesis. 2004;25:1011–1014. doi: 10.1093/carcin/bgh105. [DOI] [PubMed] [Google Scholar]
- 9.Narita S, Tsuchiya N, Saito M, Inoue T, Kumazawa T, Yuasa T, Nakamura A, Habuchi T. Candidate genes involved in enhanced growth of human prostate cancer under high fat feeding identified by microarray analysis. Prostate. 2008;68:321–335. doi: 10.1002/pros.20681. [DOI] [PubMed] [Google Scholar]
- 10.Connolly JM, Coleman M, Rose DP. Effects of dietary fatty acids on DU145 human prostate cancer cell growth in athymic nude mice. Nutr Cancer. 1997;29:114–119. doi: 10.1080/01635589709514611. [DOI] [PubMed] [Google Scholar]
- 11.Pollard M, Luckert PH. Promotional effects of testosterone and high fat diet on the development of autochthonous prostate cancer in rats. Cancer Lett. 1986;32:223–227. doi: 10.1016/0304-3835(86)90123-0. [DOI] [PubMed] [Google Scholar]
- 12.Tagawa Y, Ozaki K, Takahashi S, Ogawa K, Shirai T. Lack of effects of post-initiation cholesterol on 3,2’-dimethyl-4-aminobiphenyl-induced prostate carcinogenesis. Prostate. 1992;20:179–185. doi: 10.1002/pros.2990200303. [DOI] [PubMed] [Google Scholar]
- 13.Bhattacharya I, Mundy AL, Widmer CC, Kretz M, Barton M. Regional heterogeneity of functional changes in conduit arteries after high-fat diet. Obesity (Silver Spring) 2008;16:743–748. doi: 10.1038/oby.2007.111. [DOI] [PubMed] [Google Scholar]
- 14.Vykhovanets EV, Shankar E, Vykhovanets OV, Shukla S, Gupta S. High-fat diet increases NF-kappaB signaling in the prostate of reporter mice. Prostate. 2010 doi: 10.1002/pros.21230. in press. [DOI] [PMC free article] [PubMed] [Google Scholar]
- 15.Vaca CE, Wilhelm J, Harms-Ringdahl M. Interaction of lipid peroxidation products with DNA. Mutat. Res. 1988;195:137–149. doi: 10.1016/0165-1110(88)90022-x. [DOI] [PubMed] [Google Scholar]
- 16.Rose DP, Connolly JM. Effects of fatty acids and eicosanoid synthesis inhibitors on the growth of two human prostate cancer cell lines. Prostate. 1991;18:243–254. doi: 10.1002/pros.2990180306. [DOI] [PubMed] [Google Scholar]
- 17.Fleshner N, Fair WR, Huryk R, Heston WD. Vitamin E inhibits the high-fat diet promoted growth of established human prostate LNCaP tumors in nude mice. J Urol. 1999;161:1651–1654. [PubMed] [Google Scholar]
- 18.Suzuki K, Koike H, Matsui H, Ono Y, Hasumi M, Nakazato H, Okugi H, Sekine Y, Oki K, Ito K, Yamamoto T, Fukabori Y, Kurokawa K, Yamanaka H. Genistein, a soy isoflavone, induces glutathione peroxidase in the human prostate cancer cell lines LNCaP and PC-3. Int J Cancer. 2002;99:846–852. doi: 10.1002/ijc.10428. [DOI] [PubMed] [Google Scholar]
- 19.Livak KJ, Schmittgen TD. Analysis of relative gene expression data using real-time quantitative PCR and the 2ΔΔCT method. Methods. 2001;25:402–408. doi: 10.1006/meth.2001.1262. [DOI] [PubMed] [Google Scholar]
- 20.Berquin IM, Min Y, Wu R, Wu H, Chen YQ. Expression signature of the mouse prostate. J Biol Chem. 2005;280:36442–36451. doi: 10.1074/jbc.M504945200. [DOI] [PubMed] [Google Scholar]
- 21.Shappell SB, Thomas GV, Roberts RL, Herbert R, Ittmann MM, Rubin MA, Humphrey PA, Sundberg JP, Rozengurt N, Barrios R, Ward JM, Cardiff RD. Prostate pathology of genetically engineered mice: definitions and classification. The consensus report from the Bar Harbor meeting of the Mouse Models of Human Cancer Consortium Prostate Pathology Committee. Cancer Res. 2004;64:2270–2305. doi: 10.1158/0008-5472.can-03-0946. [DOI] [PubMed] [Google Scholar]
- 22.Yoshida Y, Suzuki K, Yamamoto A, Sakai N, Bando M, Tanimoto K, Yamaguchi Y, Sakaguchi T, Akhter H, Fujii G, Yoshimura S, Ogata S, Sohda M, Misumi Y, Nakamura N. YIPF5 and YIF1A recycle between the ER and the Golgi apparatus and are involved in the maintenance of the Golgi structure. Exp Cell Res. 2008;314:3427–3443. doi: 10.1016/j.yexcr.2008.07.023. [DOI] [PubMed] [Google Scholar]
- 23.Maddipati KR, Marnett LJ. Characterization of the major hydroperoxide-reducing activity of human plasma. Purification and properties of a selenium-dependent glutathione peroxidase. J Biol Chem. 1987;262:17398–17403. [PubMed] [Google Scholar]
- 24.Dencker L, Annerwall E, Busch C, Eriksson U. Localization of specific retinoid-binding sites and expression of cellular retinoic-acid-binding protein (CRABP) in the early mouse embryo. Development. 1990;110:343–352. doi: 10.1242/dev.110.2.343. [DOI] [PubMed] [Google Scholar]
- 25.Tanaka K, Imoto I, Inoue J, Kozaki K, Tsuda H, Shimada Y, Aiko S, Yoshizumi Y, Iwai T, Kawano T, Inazawa J. Frequent methylation-associated silencing of a candidate tumor-suppressor, CRABP1, in esophageal squamous-cell carcinoma. Oncogene. 2007;26:6456–6468. doi: 10.1038/sj.onc.1210459. [DOI] [PubMed] [Google Scholar]
- 26.Ryu DY, Levi PE, Hodgson E. Regulation of cytochrome P-450 isozymes CYP1A1, CYP1A2 and CYP2B10 by three benzodioxole compounds. Chem Biol Interact. 1995;96:235–247. doi: 10.1016/0009-2797(94)03594-x. [DOI] [PubMed] [Google Scholar]
- 27.Chung SS, Kim M, Youn BS, Lee NS, Park JW, Lee IK, Lee YS, Kim JB, Cho YM, Lee HK, Park KS. Glutathione peroxidase 3 mediates the antioxidant effect of peroxisome proliferator-activated receptor gamma in human skeletal muscle cells. Mol Cell Biol. 2009;29:20–30. doi: 10.1128/MCB.00544-08. [DOI] [PMC free article] [PubMed] [Google Scholar]
- 28.Yu YP, Yu G, Tseng G, Cieply K, Nelson J, Defrances M, Zarnegar R, Michalopoulos G, Luo JH. Glutathione peroxidase 3, deleted or methylated in prostate cancer, suppresses prostate cancer growth and metastasis. Cancer Res. 2007;67:8043–8050. doi: 10.1158/0008-5472.CAN-07-0648. [DOI] [PubMed] [Google Scholar]
- 29.Meister A. Glutathione-ascorbic acid antioxidant system in animals. J Biol Chem. 1994;269:9397–9400. [PubMed] [Google Scholar]
- 30.Yu S, Kong AN. Targeting carcinogen metabolism by dietary cancer preventive compounds. Curr Cancer Drug Targets. 2007;7:416–424. doi: 10.2174/156800907781386669. [DOI] [PubMed] [Google Scholar]
- 31.Khor TO, Huang MT, Kwon KH, Chan JY, Reddy BS, Kong AN. Nrf2-deficient mice have an increased susceptibility to dextran sulfate sodium-induced colitis. Cancer Res. 2006;66:11580–11584. doi: 10.1158/0008-5472.CAN-06-3562. [DOI] [PubMed] [Google Scholar]
- 32.Gloire G, Legrand-Poels S, Piette J. NF-kappaB activation by reactive oxygen species: fifteen years later. Biochem Pharmacol. 2006;72:1493–1505. doi: 10.1016/j.bcp.2006.04.011. [DOI] [PubMed] [Google Scholar]
- 33.Drevet JR. The antioxidant glutathione peroxidase family and spermatozoa: a complex story. Mol Cell Endocrinol. 2006;250:70–79. doi: 10.1016/j.mce.2005.12.027. [DOI] [PubMed] [Google Scholar]
- 34.DeFuria J, Bennett G, Strissel KJ, Perfield JW, 2nd, Milbury PE, Greenberg AS, Obin MS. Dietary blueberry attenuates whole-body insulin resistance in high fat-fed mice by reducing adipocyte death and its inflammatory sequelae. J Nutr. 2009;139:1510–1516. doi: 10.3945/jn.109.105155. [DOI] [PMC free article] [PubMed] [Google Scholar]
- 35.Lee YS, Kim AY, Choi JW, Kim M, Yasue S, Son HJ, Masuzaki H, Park KS, Kim JB. Dysregulation of adipose glutathione peroxidase 3 in obesity contributes to local and systemic oxidative stress. Mol Endocrinol. 2008;22:2176–2189. doi: 10.1210/me.2008-0023. [DOI] [PMC free article] [PubMed] [Google Scholar]
- 36.Hayward SW, Dahiya R, Cunha GR, Bartek J, Deshpande N, Narayan P. Establishment and characterization of an immortalized but non-transformed human prostate epithelial cell line: BPH-1. In Vitro Cell Dev Biol Anim. 1995;31:14–24. doi: 10.1007/BF02631333. [DOI] [PubMed] [Google Scholar]
- 37.Stokes KY, Cooper D, Tailor A, Granger DN. Hypercholesterolemia promotes inflammation and microvascular dysfunction: role of nitric oxide and superoxide. Free Radic Biol Med. 2002;33:1026–1036. doi: 10.1016/s0891-5849(02)01015-8. [DOI] [PubMed] [Google Scholar]
- 38.Murphy GJ, Holder JC. PPAR-gamma agonists: therapeutic role in diabetes, inflammation and cancer. Trends Pharmacol Sci. 2000;21:469–474. doi: 10.1016/s0165-6147(00)01559-5. [DOI] [PubMed] [Google Scholar]
- 39.Carlsson C, Borg LA, Welsh N. Sodium palmitate induces partial mitochondrial uncoupling and reactive oxygen species in rat pancreatic islets in vitro. Endocrinology. 1999;140:3422–3428. doi: 10.1210/endo.140.8.6908. [DOI] [PubMed] [Google Scholar]
- 40.Govindarajan R, Ratnasinghe L, Simmons DL, Siegel ER, Midathada MV, Kim L, Kim PJ, Owens RJ, Lang NP. Thiazolidinediones and the risk of lung, prostate, and colon cancer in patients with diabetes. J Clin Oncol. 2007;25:1476–1481. doi: 10.1200/JCO.2006.07.2777. [DOI] [PubMed] [Google Scholar]
Associated Data
This section collects any data citations, data availability statements, or supplementary materials included in this article.