Abstract
Objectives/Hypothesis
Optical coherence tomography (OCT) can provide high-resolution (~10–15 μm/pixel) images of vocal fold microanatomy, as demonstrated previously. We explored physiologically triggered Fourier-domain OCT for imaging vocal folds during phonation. The goal is to visualize dynamic histological cross sections and four-dimensional data sets where multiple planes are displayed in synchronized motion. If feasible, this approach could be a useful research tool and spur development of new clinical instrumentation.
Study Design
A Fourier-domain, triggered OCT system was created and tested in experiments on excised calf larynges to obtain preliminary observations and characterize important factors affecting image quality.
Methods
Larynges were imaged during phonation driven by warm, humidified air. A subglottal pressure signal was used to synchronize the OCT system with the phonatory cycle. Image sequences were recorded as functions of anatomical location or sub-glottal pressure. Implant materials were also imaged during vibration, both in isolation and after injection into a vocal fold.
Results
Oscillations of epithelium and lamina propria were observed, and parameters such as shape, amplitude, and velocity of the vocal fold mucosal waves were found to be measurable. Ripples of mucosal wave as small as 100 μm in vertical height were clearly visible. Internal strain was also observed in normal and implanted vocal folds.
Conclusions
Four-dimensional OCT of the vocal fold may help to more directly relate biomechanics to anatomy and disease. It may also be useful for assaying the functional rheology of implants in the context of real tissue. With further development, this technology has potential for clinical endoscopic application.
Keywords: Optical coherence tomography, oscillation, vocal fold, mucosal wave, stroboscopy, laryngology, biomechanics, dynamics, biomaterials, rheology
INTRODUCTION
Laryngeal videostroboscopy is a powerful clinical tool because it enables simultaneous assessment of vocal fold surface anatomy and a number of key functions of the larynx, especially the vibratory characteristics of the phonatory mucosa.1 Clinicians routinely integrate their observations of surface pathology (e.g., cancer, dysplasia, papillomatosis, scar, polyp, nodule, cyst) with abnormalities of vibration as seen with stroboscopy to assess the impact of lesions or treatment outcomes on glottal sound production. The deformability or pliability of the glottal mucosa is typically deduced by making these integrated observations while patients perform tasks to vary the frequency and intensity of their phonations. Although laryngeal videostroboscopy is widely used in the clinic, there are some limitations to this mode of assessment. One is that the imaging is limited to the surface, and thus there are no direct observations of subsurface pathology or tissue deformation as a function of depth. A second limitation is that it is very difficult to capture and quantify the three dimensions of motion of the mucosal wave with video-based imaging. Excursions of the medial edges of the vocal folds can be measured, at least in a relative sense, but axial displacements and the spreading of the mucosal wave across the superior surface of the vocal fold are very difficult to quantify. These limitations, which also apply to high-speed video imaging, could potentially be addressed by cross-sectional spatially calibrated imaging if it were feasible to obtain during phonation.
Restrictions in frame rate, resolution, and cost limit the usefulness of magnetic resonance imaging and computed tomography for functional vocal fold imaging at this juncture. Ultrasound has been used for imaging vocal fold vibration, which is possible when subjects phonate at a frequency near a harmonic of the relatively low ultrasound frame rate.2 Although this method does enable some visualization of the motion through the full depth of the vocal fold, it is cumbersome and does not provide adequate spatial or temporal resolution for most practical clinical applications. In contrast, optical coherence tomography3 (OCT) has shown promise for static, high-resolution imaging of many tissues, including vocal folds, to a depth of 1 to 2 mm. Recent developments in Fourier-domain OCT technology4 have dramatically increased image acquisition speeds. Although the imaging speeds of state-of-the-art OCT systems are still insufficient to image the vocal fold motion directly, we have reasoned that by employing a triggered mode, analogous to stroboscopy, it should be possible to capture high-resolution cross sections of moving vocal folds.
Since an initial report by Sergeev et al.5 in 1997, more than 40 articles describing OCT imaging of vocal folds have appeared. Most investigators have examined the potential of static OCT imaging for assessing histopathology or surgically induced alterations to the mucosa. Only three previous studies have used OCT in a more functional way. Burns et al.6 used video-rate OCT to monitor injection of a biomaterial into excised calf vocal folds. More relevant to our study are two recent reports where OCT images were obtained during phonation. Luerssen et al.7 and Yu et al.8 used OCT with scan rates of 10 and 40 frames/second, respectively, and obtained images where multiple cycles of oscillation are present within single video frames. Some information related to oscillation frequency and mucosal displacement is present in these images, but true cross-sectional movies of the mucosal wave cannot be obtained in this way because the scanning is slow and not locked to the oscillation.
In this article we describe a novel OCT technique that is capable of capturing sequential snapshots of vocal fold oscillation across the vibratory cycle. We refer to the method as four-dimensional (4D) OCT, to indicate capture of the x, y, and z spatial dimensions along with the fourth dimension of time. This technique is based on continuous acquisition of OCT image data followed by image registration using physiological signals. Because the image data are acquired continuously, it also offers the distinct advantage of faster image acquisition compared to conventional stroboscopic pulsed illumination or trigger-gated techniques. We have developed an OCT system that enables 1) high-resolution imaging extending perpendicular to the surface up to 2 mm deep into the vocal fold, 2) high-speed capture of the OCT data for display as dynamic, oscillating cross sections, and 3) spatial calibration such that vocal fold motion can be measured objectively and analyzed quantitatively. We present experimental results that illustrate the potential of this new technology to provide information not currently obtainable by other vocal fold imaging modalities.
MATERIALS AND METHODS
OCT System and Signal Processing
Figure 1 shows a schematic diagram depicting the physiologically triggered OCT system in an optical frequency domain imaging configuration. OCT uses principles of interferometry to form images based on the reflectivity of tissue structures to light. Typically infrared rather than visible, light is used for deeper penetration into the tissue up to 2 to 3 mm. There are two basic types of OCT, time-domain OCT, where depth is sampled by changing signal delay, and Fourier-domain OCT, where the depth is sampled in the spatial frequency domain by changing the frequency of the light using either a swept laser source or a diffraction grating, and reconstructed by a Fourier transform of the acquired interferometry data. A swept laser source was used in our imaging system, and a more complete description of the optical design can be found in Yun et al.9 A cross-section image is typically acquired by rapidly sweeping the OCT laser beam across the tissue to capture 500 to 1,000 axial lines of image data (termed A-lines, using the same nomenclature as for ultrasound).
Fig. 1.
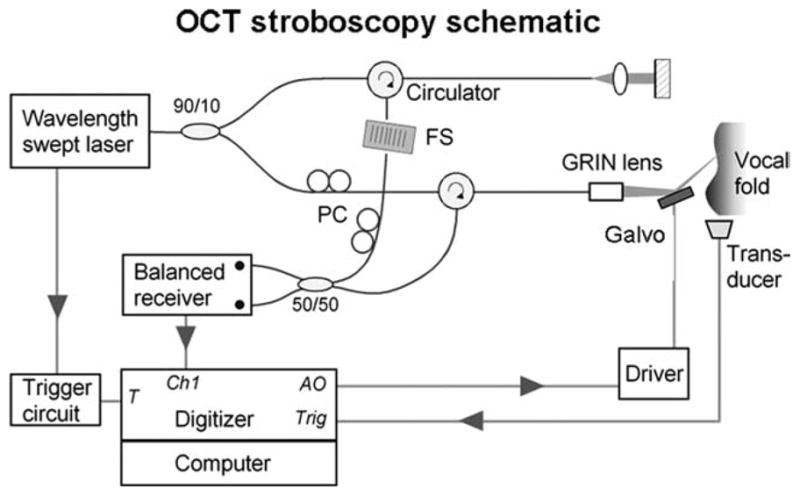
Schematic of the optical frequency domain imaging, optical coherence tomography (OCT) system showing its trigger connection to the hemilarynx apparatus. FS, frequency shifter; PC, polarization controller; GRIN, graded-index; T, trigger signal input; Ch1, analog input channel; AO, analog output; and Trig, trigger output.
The swept laser was comprised of a custom-built polygon-scanning semiconductor laser.10 The axial-line (A-line) acquisition rate was set to 10 kHz with a sweep range from 1,220 to 1,345 nm, resulting in an axial resolution of 12 μm in air. A theoretical lateral resolution of 15 μm was predicted based on using a 35-mm focusing lens in the sample arm. The average laser output was 50 mW, with 90% directed to the sample arm and 10% to the reference arm. The interference signal after the 50/50 coupler was detected with a balanced photodetector (Model 1817; New Focus Inc., Santa Clara, CA) and sequentially digitized at 10 MS/s with 12-bit resolution (Model PCI-6115 DAQ; National Instruments Corp., Austin, TX). Postprocessing steps, which were performed with MATLAB (The MathWorks, Inc., Natick, MA), included reference background subtraction, interference signal envelope windowing, k-space linearization, and optimization of brightness and contrast in the reconstructed images. Amira software was used for some three-dimensional (3D) and 4D reconstructions (Visage Imaging, Inc., San Diego, CA). Particle image velocimetry was performed using UraPiv and OpenPiv, freeware tools developed for MAT-LAB (http://www.openpiv.net).
For time synchronization, the OCT system was configured to use a trigger input derived from subglottal pressure signals. Alternatively, any low-noise signal locked to the fundamental frequency of phonation (F0) could be used. Subglottic pressure was detected with a PTW-1 transducer and amplified with an M-100A2 amplifier (both from Glottal Enterprises, Syracuse, NY). The signal was further amplified and bandpass filtered between 30 and 300 Hz with a programmable filter (Cyberamp; Molecular Devices, Sunnyvale, CA). The signal was fed to an oscilloscope (Model 2465B; Tektronix, Inc., Beaverton, OR) for monitoring and for generating a transistor-transistor logic (TTL) trigger-out signal to the OCT system. A broadband pressure signal was also recorded with a separate computer and digitizer (Model 1321; Molecular Devices).
Cross-sectional A-lines were acquired continuously at each location for the duration of one full vibratory cycle. At the end of each cycle, the galvanometer system was triggered by the TTL signal to increment the OCT sampling beam position by one step. Therefore, a complete 500 A-line scan required continuous acquisition spanning 500 cycles of vibration. As the F0s generally ranged from 80 to 120 Hz, the acquisition times typically ranged from 4 to 6 seconds. The number of phases per cycle sampled per location was determined by the F0. If F0 = 100 Hz, for example, the period was 10 ms and 100 phases were acquired during each period. In this example, the vibratory motion would be measured with a temporal resolution of 100 μs, or 1% of the total cycle time. Therefore, the temporal resolution decreases with increasing F0 because of reduced acquisition time per motion cycle, and the total time needed for acquiring data over a full cycle also decreases with increasing F0.
The transversal field of view was determined by the gain of the signal sent to the galvanometer and the focal length of the focusing lens. With a 35-mm focusing lens, the working distance was 8 cm from the galvanometer to the surface of the tissue. Because we typically scanned 500 A-lines over a range of 7 mm, the A-lines were 14 μm apart, which was close to the theoretical lateral resolution of 15 μm for our system. The axial field of view was 3.3 mm.
Initially, we used two simplified test setups: a mirror mounted on an axially vibrating acoustic minishaker (Brüel & Kjær, Nærum, Denmark), and a laterally oscillating platform driven at 60 Hz (modified Crest electric toothbrush; Procter & Gamble, Cincinnati, OH), on which we placed excised vocal folds or other elastic materials (Chang et al., unpublished data). The triggering was more precise and stable in these models than when imaging larynges. The models helped to characterize and optimize the imaging system because there was little degradation in the images that could be attributed to cycle-to-cycle variations in either triggering or target motion.
Hemilarynx Preparation
The hemilarynx preparation (Fig. 2), first developed by Jiang and Titze11 in 1993, has been a valuable tool for studying vocal fold physiology because it affords an excellent view of the medial surface of the vocal fold and a relatively normal mucosal wave is preserved. By using a 7-mm-wide beam-scan, it was possible to capture much of the dorsal-ventral extent of the mucosal wave in this preparation.
Fig. 2.
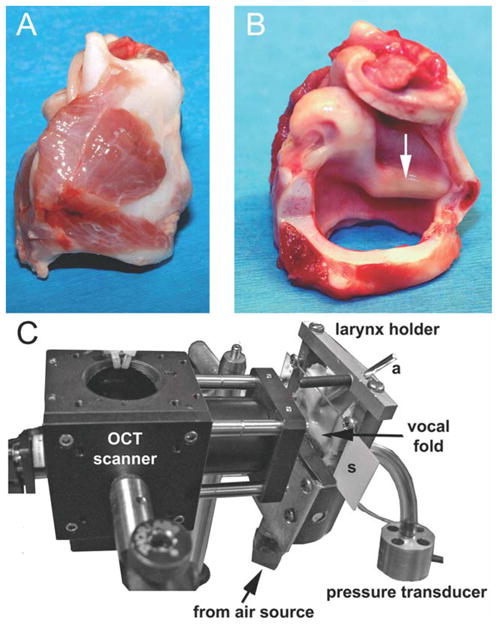
(A) Lateral view of intact calf larynx. (B) Same larynx after the right half has been largely removed. The membranous vocal fold is about 12-mm long. (C) The larynx has been mounted in the hemilarynx chamber and positioned next to the optical coherence tomography (OCT)-galvanometer module. a = brass rod used for holding the vocal process in adduction; s = removable microscope slide.
Fresh calf larynges were obtained from a local meatpacker and were used either immediately or were stored in saline-soaked gauze in a −80°C freezer until used. The length of the calf vocal fold is similar to the length of the human vocal fold, but ventricles are absent and the vocal folds are more broad and rounded. Figure 2 shows how the larynges were prepared and mounted in the custom-built hemilarynx chamber. Once a larynx was mounted, air leaks were sealed with fast-setting dental alginate (Jeltrate Plus; Dentsply Int’l., Milford, DE). Air used for driving phonation was warmed and humidified with a ConchaTherm-IV device (Hudson RCI, Research Triangle Park, NC). The pressure transducer was attached to a side port 2.5 cm below the vocal folds. An adjustable brass rod was positioned against the lateral aspect of the vocal process to maintain an adducted posture. The degree of adduction was fine tuned by placing paper or metal shims between the vocal process and the glass.
Imaging Experiments
To demonstrate some of the capabilities of the triggered 4D OCT system, we collected examples of the dynamic morphology of the mucosal wave, including: 1) single coronal planes at different phases of the vibratory cycle, 2) serial coronal sections ranging from posterior to anterior, and 3) sections where the level of the driving subglottal pressure was varied. We also tested the ability of the system to resolve transparent hydrogels during vibration on a shaker and after injection into the superficial lamina propria (SLP).
The static images in the figures only show a small subset of the data, which typically consisted of about 100 frames per cycle, often acquired at multiple coronal planes. The reader is encouraged to view the Supporting Information video files online for examples of oscillating vocal fold cross-sections.
RESULTS
Dynamic Morphology of the Mucosal Wave in a Single Coronal Plane
Figure 3 was obtained using triggered OCT. A cross section of the mucosal wave can be seen passing from inferior (left) to superior (right). The epithelium appears as a light band, and the boundary between epithelium and the underlying SLP is clearly seen. The horizontal lines are caused by reflections from the surfaces of the glass window.
Fig. 3.
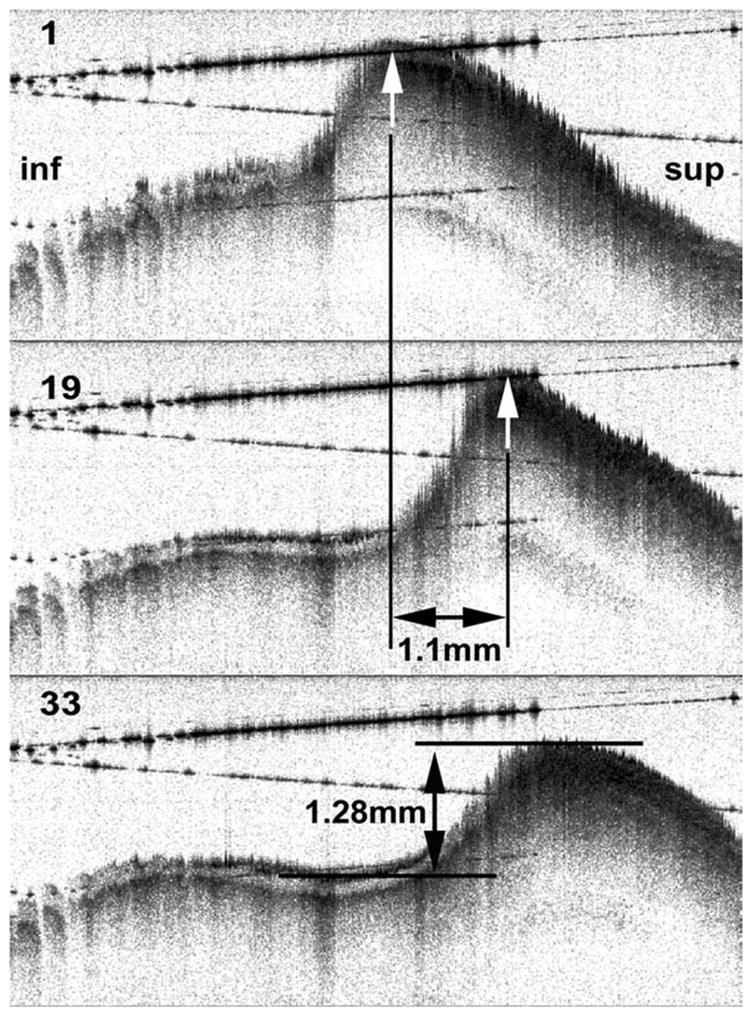
Frames 1, 19, and 33 from an optical coherence tomography movie sequence. Measurements of mucosal wave amplitude and displacement over time are shown. inf = inferior (subglottic direction); sup = superior.
Some jaggedness and loss of resolution are apparent where the tissue is more steeply sloped and undergoing rapid movement. These artifacts are probably attributable to position registration errors and the Doppler effect (see Discussion), both of which are most noticeable when tissue velocity is high relative to the A-line rate. Shadow effects (light streaks) can also seen below the region where there was moisture on the glass window (left side of images).
Measurements can be made quite accurately from such images, taking advantage of the fact that the OCT system is accurately calibrated in space. As an example, the displacement of the peak of the mucosal wave between frames 1 and frame 19 was measured to be 1.1 mm, and because the time interval between frames is known (2.96 ms), a mucosal wave velocity of 0.37 m/sec can be calculated. The amplitude of the mucosal wave can be measured, as in the middle panel. It is anticipated that these, and more sophisticated measures of surface dynamics, can eventually be made using automated algorithms and then systematically quantified across the vibratory cycle and for different phonation parameters.
Dynamic Morphology of Subepithelial Structures
In addition to measurements of surface motion, it is possible to view the motion of internal structures in the movie sequences. Although the SLP is relatively low in contrast, small structures that probably correspond to blood vessels, glands, and irregularities in the texture of the extracellular matrix can be resolved with OCT. These structures then provide landmarks for tracking movement-related deformation within the SLP. For instance, we observed that the motion of the subepithelial tissue near the peak of the mucosal wave often appears to be out of phase with the surface, lagging during adductory motion, catching up near impact, and leading during abduction. These observations are preliminary and obviously require more rigorous analysis in future studies.
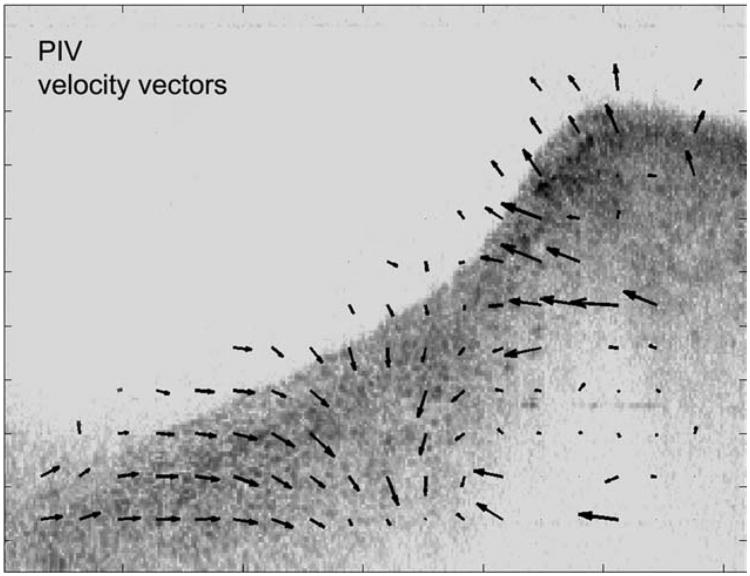
One possible analysis approach that could help to quantify such observations is shown in Figure 4, where particle image velocity software was used to estimate velocity vectors of 32 × 32 pixel blocks between subsequent frames. A similar method was used by Tsai et al.2 for tracking motion in ultrasound images of the vocal folds.
Fig. 4.
Single frame from an image sequence where particle image velocimetry (PIV) analysis was used to track motion between sequential frames across the full thickness of the cross section.
In Figure 4 the direction and velocity of motion in small, local regions of the tissue is indicated by the velocity vector arrows. This type of analysis can provide estimates of local tissue dynamics. In this example, there was a change in vector orientation seen at the left edge of the mucosal wave near the transition between vertical and horizontal traveling waves. Measures of internal tissue strain could eventually be very useful for understanding strain-related tissue injury (e.g., as a possible etiological factor in vocal fold nodules) and for testing basic tenets of vocal fold function, such as the cover-body theory.12
The Mucosal Wave Observed in Serial Coronal Sections
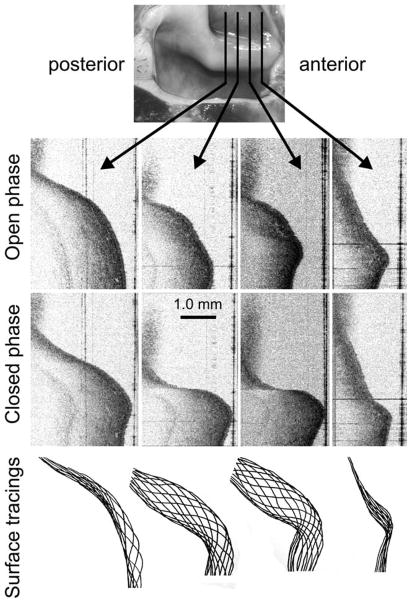
It was possible to observe the dynamic morphology of the mucosal wave at different anterior-posterior planes by moving the position of the OCT scanner relative to the hemilarynx preparation with a micrometer, which could also be accomplished with a two-dimensional (2D) galvanometer. Figure 5 shows four representative coronal sections out of the 11 that were acquired in this preparation; each of the eleven sections was separated by 1 mm and the sections shown are 3 mm apart.
Fig. 5.
Serial coronal sections through a mucosal wave. The planes shown at top were separated by 3 mm. Two phases of motion, open phase (near complete abduction) and closed phase (near complete adduction), are shown below. Some subepithelial structure is visible, which could be followed from frame to frame. At the bottom, the epithelial contour has been traced for 12 different phases for each section plane.
Near the anterior and posterior ends of the vocal fold the motion becomes more restricted (as expected). This can be appreciated in the tracings of the surface at 12 phase intervals for each section as seen at the bottom of the figure. An Supporting Information video (available online) shows a movie of all 11 sections in simultaneous motion.
We have explored the possibility of viewing the information-rich OCT data set using Amira 4D rendering software (three dimensions viewed across time). As shown in Figure 6, we imported the grayscale 2D information from the serial sections and from all time points into an Amira model to generate a 4D representation of the mucosal wave. Data between the sampled planes have been filled in by interpolation. Tools such as this might prove useful for synthesizing and reviewing data in future clinical applications. The rendered output is available online as a Supporting Information video.
Fig. 6.
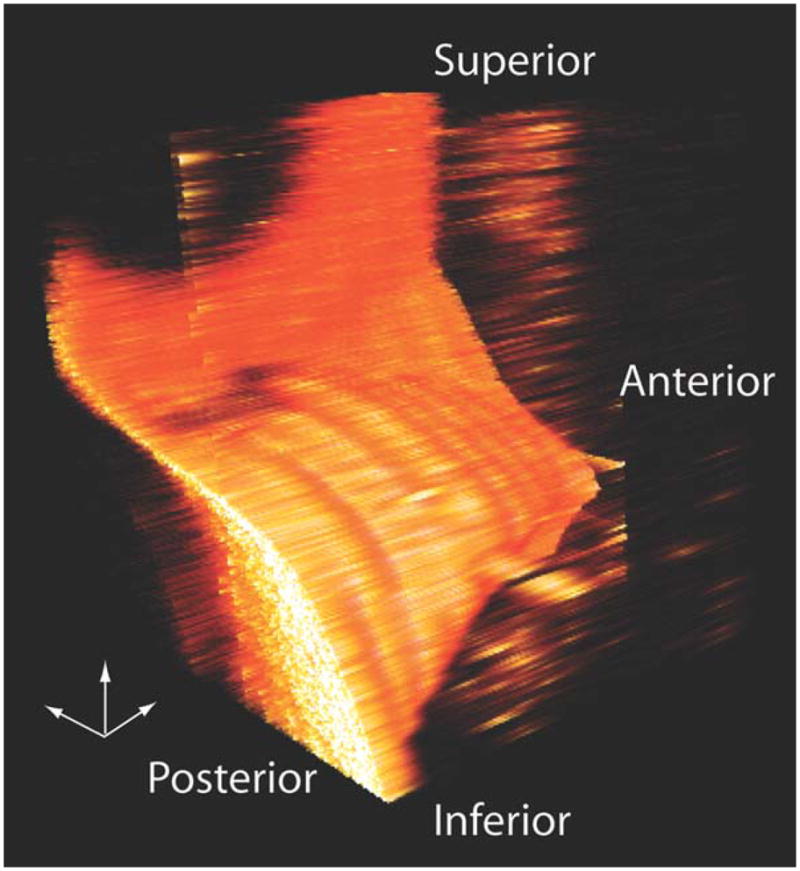
One frame from a dynamic three-dimensional (3D) reconstruction made from nine serial coronal sections using Amira software. The small 3D axis pointers are 1 mm in length. Data between the imaging planes was filled in by interpolation.
Mucosal Wave as a Function of Driving Pressure
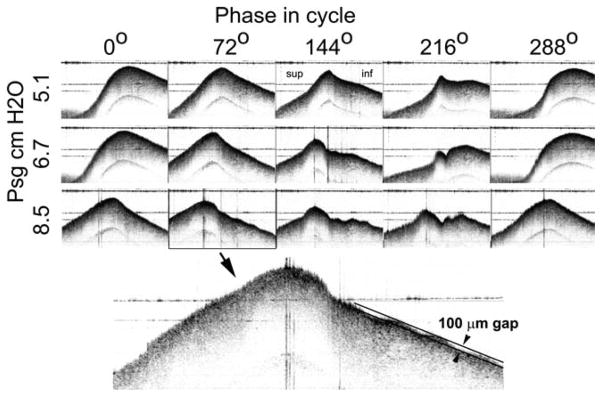
A series of movies was collected at the mid-membranous level for different levels of subglottal driving pressure. In this level series the shape of the mucosal wave became progressively more complex at higher pressures (e.g., see phases 144° and 216° in Fig. 7), with smaller waves appearing on the surface of the mucosal traveling wave.
Fig. 7.
Mucosal wave morphology is shown for three different driving pressures at five different phases in the vibratory cycle. The enlargement shows small amplitude waves on the vocal fold surface. For scale, the two black lines are separated by 100 μm.
The enlargement shows that the system was able to resolve small modes of oscillation of the surface whose amplitude is only about 100 μm. Details of mucosal wave shape on such a small scale have not been previously possible to observe with other technologies, save possibly the interferometric holographic system of Gardner.13
Imaging Biomaterials in Isolation and After Vocal Fold Injection
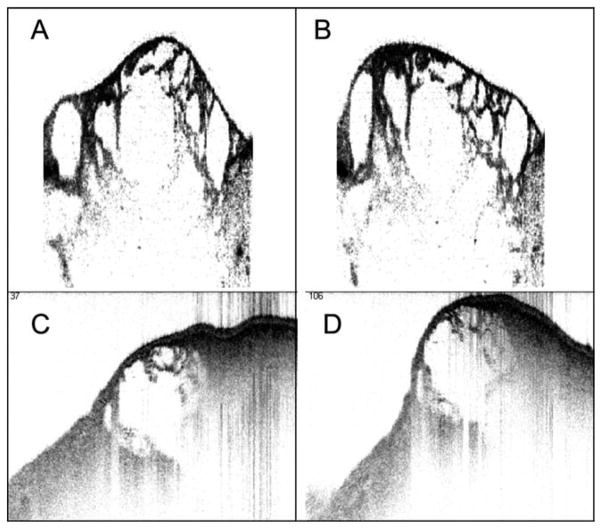
Figure 8A and Figure 8B show two frames from an OCT movie sequence of a hydrogel oscillating at 100 Hz on an acoustic shaker. The gel had been sheared by passing through a hypodermic needle, and the small constituent particles were outlined by adding a small amount of India Ink to the gel. In Figure 8C and Figure 8D a calf vocal fold was injected subepithelially with the same hydrogel (without ink). The vocal fold was mounted directly on an oscillating platform to observe the relative motion of the tissue and the gel. These preliminary tests of gel imaging show that it is feasible to track gel motion using 4D OCT. Although stretching and compression of the gel particles can be observed, multiple-plane imaging at closely spaced intervals is be needed to distinguish between movement of the particles through the plane of section and actual deformation of the particles.
Fig. 8.
(A, B) Four-dimensional (4D) optical coherence tomography (OCT) images of a transparent hydrogel oscillating on an acoustic shaker at 100 Hz. India ink was added to outline individual gel particles. (C, D) 4D OCT images of an excised vocal fold after injection of hydrogel beneath the epithelium. The specimen was mounted on a platform that was oscillating at ~60 Hz.
DISCUSSION
Dynamic Vocal Fold Morphology
4D OCT provides a novel means for correlating vocal fold anatomy and function. The motions of the vocal fold surface and internal structures were captured and could be displayed as snapshot still images, as sequences of images, as cross-sectional videos, and as dynamic 4D representations. This imaging method also shows promise for quantitative analysis of tissue dynamics and possibly for testing the biomechanical compatibility of implantable materials. We first considered some of the technical aspects and limitations of 4D OCT and then its potential applications.
OCT Technology and the Progress in Imaging Speed
The OCT system used in this article operates at an A-line acquisition rate of 10 kHz, whereas newer systems can reach speeds ranging from 60 kHz (continuous acquisition) to 370 kHz (short burst acquisition).14 These Aline rates translate to frame rates of from 120 to 740 Hz, where each frame consists of 500 A-lines. Faster imaging can reduce image acquisition time, allow for sampling additional cross-section planes, and can reduce Doppler-induced artifacts as described in the next section. However, the signal-to-noise ratio decreases inversely with the integration time, which will ultimately limit the maximum A-line rate practical for use in imaging vocal fold vibrations. The streaming of data to the computer can also become a bottleneck due to the enormous amount of information collected. For some applications, it may be sufficient to collect data more sparsely over the vocal fold surface. For example, if the goal were to capture motion at 15 locations along the vocal fold, they could be sampled at 4000 Hz using a 60 kHz A-line rate scanner, and triggering would not be necessary. Each location would still have high resolution (~15 μm) in the axial dimension, and this additional quantitative information could be a useful adjunct to high-speed or conventional videostroboscopy. In our next generation system we plan to target A-line rates of >60 kHz.
Limitations of 4D OCT Imaging
The motion sequences in this study were reconstructed based on many cycles of vibration, and therefore cycle-to-cycle variations in triggering or motion could lead to fuzziness and possible inaccuracies in the final images. This was most noticeable where the tissue was moving rapidly, probably because of greater differences in tissue position per unit time and the Doppler effect, which can exaggerate the apparent displacement when tissue velocity is high relative to A-line rate. Improvements in imaging speed and incorporation of a 2D galvanometer will reduce image acquisition time and degradation due to these factors. Similarly, motions that are not harmonically related to the trigger frequency could degrade resolution or add spurious artifacts due to aliasing. In future experiments we plan to correlate the OCT images with parallel high-speed video images to check for fidelity of the OCT sequences and better understand the limitations as a function of phonation parameters. Moreover, development of an algorithm to accommodate nonperiodic motions would greatly expand the utility of 4D OCT.
Two-dimensional cross-sectional imaging of motion does have potential for ambiguity. From a single plane it can be impossible to distinguish between deformation of a structure versus movement of the structure relative to the imaging plane (assuming the cross section of the object varies along the axis perpendicular to the image plane). This is a potential disadvantage of OCT imaging compared to other approaches where specific fleshpoints are marked and tracked optically.15–17 Therefore, for accurate measures of surface motion and for tracking of internal landmarks, it is necessary to sample multiple planes followed by 3D or 4D reconstruction (e.g., Fig. 6).
Two factors leading to distortion in OCT images also need to be considered if quantitative analysis is to be performed accurately. One is compensation for the refractive index of the tissue, which leads to apparent magnification of subsurface structures in the axial dimension by about 25%. This can be corrected by measuring the refractive index of the tissue with OCT18 and then applying a few image-processing steps.19 Doppler shifting of the reflected light from moving structures becomes a factor when the vocal fold moves by more than the magnitude of axial resolution during an A-line integration time.20 This corresponds to a velocity of 100 μm/ms in the axial direction in our current system. This error would be reduced by a factor of six in a 60-kHz Aline rate system. It is also possible that residual distortion can be compensated by warping the images based on local velocity tracking across frames.
Applications of 4D OCT Imaging
We believe there is a variety of scenarios where 4D OCT may prove useful in the laboratory and by incorporation into clinical endoscopy instrumentation: 1) studying surface and subepithelial tissue dynamics using in vivo and ex vivo mammalian models, 2) testing implantable subepithelial biomaterials designed to restore phonatory mucosal pliability, 3) incorporating into a clinical OCT endoscopy system for office-based examinations of vocal function to assess mucosal stiffness, and 4) differentiating intraepithelial dysplasia from cancer.
Studies of Surface and Subepithelial Tissue Dynamics
In previous studies the hemilarynx model was used extensively for characterizing vocal fold dynamics,11,15–17 and optical triangulation was used to reconstruct the motion of the vocal fold surface. Other methods were used for tracking the vocal fold surface, such as x-ray tracking of pellets21 and interferometry.13 An obvious advantage of 4D OCT is the high-resolution dynamic imaging of the surface and the upper 1 to 2 mm of the lamina propria, which cannot be accomplished with other methods. This allows new questions to be asked regarding the coupling between the epithelium and underlying tissue and the distribution and time course of strain in the SLP. Our preliminary observations suggest that we can see differential movement in the SLP as a function of depth, and we have begun to quantify this using motion-tracking software. Work remains to be done to validate such measures and to study the variation in strain within the SLP as a function of depth, location, and different phonatory parameters.
The OCT approach also provides finer-grained information about surface deformation than previous experiments that relied on marking the epithelium with an assortment of high-contrast targets for optical or x-ray imaging. For example, Berry et al.15 tracked nine fleshpoints using microsutures placed along a coronal plane in a canine hemilarynx experiment, whereas our imaging resolved 500 points along a similar axis, with an additional 512 points per location of depth information (albeit with limitations related to periodicity of the motion). One benefit of higher resolution is suggested by the images shown in Figure 7, where we observed small-scale waves riding on the larger mucosal wave. Such waves were observed to be low in amplitude and short in wavelength and would be difficult to detect with any other imaging method. The significance of such waves, which could be artifacts related to the artificial hemilarynx preparation, is currently unknown.
In 1983 Hirano commented on the clinical need for developing biomechanical models that could deal with pathological tissue in small parts of the vocal fold.12 4D OCT could help to provide the resolution, the depth information and the correlated observations of structure and function needed to develop and test these kinds of models. In particular, it should help in development and testing of finite-element models of the vocal fold.
Testing Implantable Biomaterials
Recently there has been great interest in developing biomaterials and surgical strategies for augmentation of the SLP.23 4D OCT could be used to help test the functional biomechanics of candidate materials as it is well suited for elastographic testing of tissue and implant materials. The images in Figure 8 show that it is feasible to image gels in isolation or after injection into vocal folds. Rheologic testing combined with imaging could provide direct information about how particle size and deformation contributes to the global rheological properties of implants. This approach, used in conjunction with the hemilarynx preparation, might be useful in determining whether implanted materials deform like surrounding tissue.
Clinical OCT Endoscopy System for Office-Based Examinations of Vocal Function
4D OCT imaging in the clinic could provide useful feedback to the phonosurgeon before, during, and after treatment. A considerable amount of work remains to be done before a clinical instrument is available. Recent work by Yu,8 however, shows the feasibility of office-based OCT imaging, and this group has made progress in developing the necessary optics for adjusting working distance. Stability of imaging and phonation across the capture period will be issues in achieving adequate dynamic image quality in vivo.
The maximum imaging depth of OCT is about 2 mm, which is about the same thickness of the normal lamina propria and sufficient to assess the rheological and vibratory impact of a number of vocal fold pathologies. This would allow for enhanced understanding of the vocal dysfunction associated with diminished subepithelial pliability due to lost or stiffened SLP. Mucosal stiffness is associated with vocal fold nodules, presbyphonia, successful glottic cancer treatment, idiopathic and phonotraumatic sulcus deformities, and scar from prior phonomicrosurgery. Vibratory function is thought to be related to the ratio of stiffened subepithelial tissue to the residual pliable SLP underlying the scar,24 and this method, by combining imaging and functional assessment, is well suited to testing that hypothesis.
Differentiating Intraepithelial Dysplasia From Cancer
Precancerous intraepithelial vocal fold dysplasia has been recognized as a disease entity for almost a century,2 and can be thought of as a window of opportunity for treatment prior to malignant degeneration.26 However, distinguishing intraepithelial cancer from microinvasive cancer can be difficult, even when examining these lesions with high-resolution stroboscopy and/or surgical microscopy.27 It is possible that the added dimension of time/motion with 4D OCT could enhance the capability of OCT to provide optical biopsies by revealing discontinuities in tissue motion around the perimeter of lesions that may be associated with invasion.
CONCLUSION
OCT can be triggered by physiological signals to obtain dynamic cross sections of the vocal fold across a vibratory cycle. The images obtained are spatially calibrated, enabling measure of vocal fold dynamics. Internal motion within the SLP can be observed and is amenable to analysis of tissue strain. Motion of the vocal fold surface is captured with high resolution enabling the observation of previously invisible, small amplitude waves riding on the mucosal wave. There is substantial potential for valuable research and clinical applications.
Supplementary Material
Acknowledgments
This work was supported in part by the Eugene B. Casey Foundations and the Institute of Laryngology and Voice Restoration, NIH grant RC1DK086242, and a Wellman graduate student fellowship (Ernest W. Chang). The authors have no other funding, financial relationships, or conflicts of interest to disclose.
The authors thank Christine Hsieh for her help with initial experiments; James T. Heaton, James A. Burns, and Kenneth R. Pearson for their helpful comments on the manuscript; and Alex Liberzon for assistance implementing the software for particle image velocimetry. This work was supported in part by the Eugene B. Casey Foundations and the Institute of Laryngology and Voice Restoration, NIH grant RC1DK086242 (Seok-Hyun Yun), and a Wellman graduate student fellowship (Ernest W. Chang).
Footnotes
Additional Supporting Information may be found in the online version of this article.
BIBLIOGRAPHY
- 1.Hirano M, Bless DM. Videostroboscopic Examination of the Larynx. San Diego, CA: Singular; 1993. [Google Scholar]
- 2.Tsai CG, Chen JH, Shau YW, Hsiao TY. Dynamic B-mode ultrasound imaging of vocal fold vibration during phonation. Ultrasound Med Biol. 2009;35:1812–1818. doi: 10.1016/j.ultrasmedbio.2009.06.002. [DOI] [PubMed] [Google Scholar]
- 3.Fujimoto JG, Brezinski ME, Tearney GJ, et al. Optical biopsy and imaging using optical coherence tomography. Nat Med. 1995;1:970–972. doi: 10.1038/nm0995-970. [DOI] [PubMed] [Google Scholar]
- 4.Bouma BE, Yun SH, Vakoc BJ, Suter MJ, Tearney GJ. Fourier-domain optical coherence tomography: recent advances toward clinical utility. Curr Opin Biotechnol. 2009;20:111–118. doi: 10.1016/j.copbio.2009.02.007. [DOI] [PMC free article] [PubMed] [Google Scholar]
- 5.Sergeev A, Gelikonov V, Gelikonov G, et al. In vivo endoscopic OCT imaging of precancer and cancer states of human mucosa. Opt Express. 1997;1:432–440. doi: 10.1364/oe.1.000432. [DOI] [PubMed] [Google Scholar]
- 6.Burns JA, Kim KH, Kobler JB, deBoer JF, Lopez-Guerra G, Zeitels SM. Real-time tracking of vocal fold injections with optical coherence tomography. Laryngoscope. 2009;119:2182–2186. doi: 10.1002/lary.20654. [DOI] [PubMed] [Google Scholar]
- 7.Luerssen K, Lubatschowski H, Ursinus K, Gasse H, Koch R, Ptok M. Optical coherence tomography in the diagnosis of vocal folds [in German] HNO. 2006;54:611–615. doi: 10.1007/s00106-005-1373-4. [DOI] [PubMed] [Google Scholar]
- 8.Yu L, Liu G, Rubinstein M, Saidi A, Wong BJ, Chen Z. Office-based dynamic imaging of vocal cords in awake patients with swept-source optical coherence tomography. J Biomed Opt. 2009;14:064020. doi: 10.1117/1.3268442. [DOI] [PMC free article] [PubMed] [Google Scholar]
- 9.Yun S, Tearney G, de Boer J, Iftimia N, Bouma B. High-speed optical frequency-domain imaging. Opt Express. 2003;11:2953–2963. doi: 10.1364/oe.11.002953. [DOI] [PMC free article] [PubMed] [Google Scholar]
- 10.Yun SH, Boudoux C, Tearney GJ, Bouma BE. High-speed wavelength-swept semiconductor laser with a polygon-scanner-based wavelength filter. Opt Lett. 2003;28:1981–1983. doi: 10.1364/ol.28.001981. [DOI] [PubMed] [Google Scholar]
- 11.Jiang JJ, Titze IR. A methodological study of hemilaryngeal phonation. Laryngoscope. 1993;103:872–882. doi: 10.1288/00005537-199308000-00008. [DOI] [PubMed] [Google Scholar]
- 12.Hirano M, Kakita Y. Cover-body theory of vocal cord vibration. In: Daniloff BN, editor. Speech Science. San Diego, CA: College Hill Press; 1985. pp. 33–41. [Google Scholar]
- 13.Gardner GM, Castracane J, Conerty M, Parnes SM. Electronic speckle pattern interferometry of the vibrating larynx. Ann Otol Rhinol Laryngol. 1995;104:5–12. doi: 10.1177/000348949510400102. [DOI] [PubMed] [Google Scholar]
- 14.Adler DC, Huber R, Fujimoto JG. Phase-sensitive optical coherence tomography at up to 370,000 lines per second using buffered Fourier domain mode-locked lasers. Opt Lett. 2007;32:626–628. doi: 10.1364/ol.32.000626. [DOI] [PubMed] [Google Scholar]
- 15.Berry DA, Montequin DW, Tayama N. High-speed digital imaging of the medial surface of the vocal folds. J Acoust Soc Am. 2001;110:2539–2547. doi: 10.1121/1.1408947. [DOI] [PubMed] [Google Scholar]
- 16.Dollinger M, Berry DA, Berke GS. Medial surface dynamics of an in vivo canine vocal fold during phonation. J Acoust Soc Am. 2005;117:3174–3183. doi: 10.1121/1.1871772. [DOI] [PubMed] [Google Scholar]
- 17.Dollinger M, Tayama N, Berry DA. Empirical Eigenfunctions and medial surface dynamics of a human vocal fold. Methods Inf Med. 2005;44:384–391. [PubMed] [Google Scholar]
- 18.Tearney GJ, Brezinski ME, Southern JF, Bouma BE, Hee MR, Fujimoto JG. Determination of the refractive index of highly scattering human tissue by optical coherence tomography. Opt Lett. 1995;20:2258. doi: 10.1364/ol.20.002258. [DOI] [PubMed] [Google Scholar]
- 19.Westphal V, Rollins A, Radhakrishnan S, Izatt J. Correction of geometric and refractive image distortions in optical coherence tomography applying Fermat’s principle. Opt Express. 2002;10:397–404. doi: 10.1364/oe.10.000397. [DOI] [PubMed] [Google Scholar]
- 20.Yun SH, Tearney G, de Boer J, Bouma B. Motion artifacts in optical coherence tomography with frequency-domain ranging. Opt Express. 2004;12:2977–2998. doi: 10.1364/opex.12.002977. [DOI] [PMC free article] [PubMed] [Google Scholar]
- 21.Kusuyama T, Fukuda H, Shiotani A, Nakagawa H, Kanzaki J. Analysis of vocal fold vibration by x-ray stroboscopy with multiple markers. Otolaryngol Head Neck Surg. 2001;124:317–322. doi: 10.1067/mhn.2001.113513. [DOI] [PubMed] [Google Scholar]
- 22.Fujimura O. Vocal Physiology: Voice Production, Mechanisms, and Functions. New York, NY: Raven Press; 1988. pp. 259–260. [Google Scholar]
- 23.Kutty JK, Webb K. Tissue engineering therapies for the vocal fold lamina propria. Tissue Eng Part B Rev. 2009;15:249–262. doi: 10.1089/ten.TEB.2008.0588. [DOI] [PubMed] [Google Scholar]
- 24.Zeitels SM, Hillman RE, Desloge R, Mauri M, Doyle PB. Phonomicrosurgery in singers and performing artists: treatment outcomes, management theories, and future directions. Ann Otol Rhinol Laryngol Suppl. 2002;190:21–40. doi: 10.1177/0003489402111s1203. [DOI] [PubMed] [Google Scholar]
- 25.Jackson C. Cancer of the larynx: is it preceded by a recognizable precancerous condition? Ann Surg. 1923;77:1–14. [PMC free article] [PubMed] [Google Scholar]
- 26.Zeitels SM, Akst LM, Burns JA, Hillman RE, Broadhurst MS, Anderson RR. Office-based 532-nm pulsed KTP laser treatment of glottal papillomatosis and dysplasia. Ann Otol Rhinol Laryngol. 2006;115:679–685. doi: 10.1177/000348940611500905. [DOI] [PubMed] [Google Scholar]
- 27.Dailey SH, Spanou K, Zeitels SM. The evaluation of benign glottic lesions: rigid telescopic stroboscopy versus suspension microlaryngoscopy. J Voice. 2007;21:112–118. doi: 10.1016/j.jvoice.2005.09.006. [DOI] [PubMed] [Google Scholar]
Associated Data
This section collects any data citations, data availability statements, or supplementary materials included in this article.


