

Abstract
Our goal in this study was to determine to what extent the physiologic consequences of ovariectomy (OVX) in bones are exacerbated by a lack of daily activity such as walking. We forced 14-week-old female rats to be inactive for 15 weeks with a unique experimental system that prevents standing and walking while allowing other movements. Tibiae, femora, and 4th lumbar vertebrae were analyzed by peripheral quantitative computed tomography (pQCT), microfocused X-ray computed tomography (micro-CT), histology, histomorphometry, Raman spectroscopy, and the three-point bending test. Contrary to our expectation, the exacerbation was very much limited to the cancellous bone parameters. Parameters of femur and tibia cortical bone were affected by the forced inactivity but not by OVX: (1) cross-sectional moment of inertia was significantly smaller in Sham-Inactive rat bones than that of their walking counterparts; (2) the number of sclerostin-positive osteocytes per unit cross-sectional area was larger in Sham-Inactive rat bones than in Sham-Walking rat bones; and (3) material properties such as ultimate stress of inactive rat tibia was lower than that of their walking counterparts. Of note, the additive effect of inactivity and OVX was seen only in a few parameters, such as the cancellous bone mineral density of the lumbar vertebrae and the structural parameters of cancellous bone in the lumbar vertebrae/tibiae. It is concluded that the lack of daily activity is detrimental to the strength and quality of cortical bone in the femur and tibia of rats, while lack of estrogen is not. Our inactive rat model, with the older rats, will aid the study of postmenopausal osteoporosis, the etiology of which may be both hormonal and mechanical.
Electronic supplementary material
The online version of this article (doi:10.1007/s00774-010-0241-9) contains supplementary material, which is available to authorized users.
Keywords: Underuse, Osteocyte, Osteoporosis, SOST/sclerostin, Raman spectroscopy and quality of bone
Introduction
While rats after ovariectomy (OVX) have provided an excellent animal model for postmenopausal osteoporosis for over a quarter of a century [11, 14], there are no comparable rat models for inactive lifestyles, namely those characterized by a lack of daily walking. Studies so far are limited to rat models with locally immobilized legs as in hind-limb unloading, which decreases periosteal bone formation. When hind-limb unloading follows OVX, endocortical resorption is augmented and cortical bone mineral density (BMD) decreases. Changes in the major parameters of bone such as mechanical properties, BMD and bone mineral content (BMC) occur when the two interventions are combined [3, 15, 32]. Similar results were reported for cancellous bone [34]. Collectively, these animal studies suggest that both postmenopausal estrogen depletion and a reduced physical activity, or hypokinesis, are factors that play roles in the pathogenesis of postmenopausal osteoporosis. Krall and Dawson-Hughes [18] have reported that walking habits among elderly women are related to bone density and the rate of bone loss. Conversely, disuse osteoporosis, or osteopenia, occurs in a more severe state or in physically disabled patients, and takes place regardless of age, gender, and estrogen status [19]. Nevertheless, the goal of osteoporosis research is to develop methods to effectively prevent all fractures and progressive bone loss [21]. We therefore sought to characterize the effect of estrogen deficiency and lack of physical activity on bone and the combined effect of these two variables. We developed a caged-rat model in which the cage prevents rats from standing or walking while allowing other movements. The model allows us to explore mechanisms of hypokinetic or underuse osteoporosis caused by a lack of daily activity, such as standing and walking.
Materials and methods
Animals and experimental design
The protocol for the experiment was approved by the animal care and use committee of Kanagawa Dental College. Female Wistar rats, purchased from Japan SLC (Hamamatsu, Japan), were maintained at the Kanagawa Dental College animal facility with MF feed (Oriental Yeast Co., Ltd, Japan), which contains 1.12 g calcium and 0.9 g phosphorus in 100 g of feed. They underwent either an OVX or a sham operation at 14 weeks of age (referred to as the OVX and Sham groups, respectively). Except for rats in the Baseline group, each rat was then maintained for 15 weeks either in a cage that allowed relatively free movement or in a smaller cage that restricted movement (Walking and Inactive groups, respectively; Fig. 1a, b). We performed four independent experiments in which six animals were assigned to each of four groups that are formed by intersecting pairs of the above groups: Sham-Walking, Sham-Inactive, OVX-Walking and OVX-Inactive. The rats in the Inactive group could turn around from taking water or food but could not stand on their feet or walk. The animals appeared content and free of distress. At 1 week into the experiment the mean serum corticosterone level of the rats in the Inactive group was similar to that of the Walking group: 29 versus 27 ng/ml. Both of these values are less than two-thirds of the value in rats subjected to hind-limb suspension (data not shown).
Fig. 1.
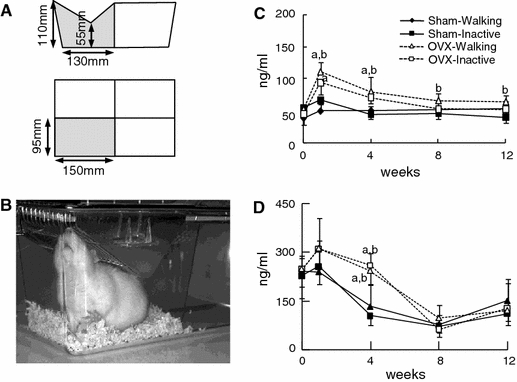
Experimental conditions and metabolic bone markers. a Dimensions of the cages used for restraining rats. b Photograph of a rat in a restraining cage. c Serum levels of CTx. d Serum levels of osteocalcin. In c and d, solid squares and triangles show mean values for the Sham-Walking and Sham-Inactive rat groups, respectively, and open squares and triangles show median values for the OVX-Walking and OVX-Inactive rat groups, respectively. Vertical bars show the SEM. Differences with P values of <0.05 are statistically significant. The letter “a” represents a significant difference between the OVX groups and the Sham-Walking group, and the letter “b” represents a significant difference between the OVX groups and the Sham-Inactive group
Blood was collected via tail vein prior to OVX and at weeks 1, 4, 8, and 12 (at time 14:00), centrifuged to remove cells and the residual clot, and kept frozen at −80°C. The animals were pair-fed by the method of Scarpace et al. [27] with a minor modification. Specifically, pellets consumed by the Sham animals were periodically measured for 3 days to determine the amount to be fed to other groups. At approximately week 15, calcein was injected twice over 7 days at 6 mg/kg of body weight. One day following the last injection, all the rats were killed. The right femurs and tibiae were excised and stored at −80°C until quantitative analyses (peripheral quantitative computed tomography (pQCT), biomechanical analyses, and confocal laser Raman spectroscopy). Some tissue specimens from excised left limbs, as well as the fourth lumbar vertebra (L4), were fixed overnight with 4% fresh formaldehyde, and then rinsed and placed into 70% ethanol for histopathologic studies. The remaining bones were decalcified as described below in the “Histology” section.
Biochemical markers of bone turnover
The serum levels of type I collagen C-terminal cross-linked telopeptides (CTx) and osteocalcin were analyzed using the ELISA kits RatLaps and Rat-MID Osteocalcin (Nordic Bioscience, Herlev Hovedgade, Denmark). According to the manufacturer’s instructions, all samples were assayed in duplicate. A standard curve was generated from which concentrations were extrapolated.
pQCT analysis
For the the pQCT analysis, isolated bones were measured using XCT Research SA+ pQCT instrument (Stratec Medizintechnik GmbH, Pforzheim, Germany) with a tube voltage of 50 kV and a tube current of 550 μA using a voxel size of 80 × 80 × 460 μm. Cortical bone was defined as the voxels of bone with BMD above 690 mg/cm3. Trabecular bone was below 395 mg/cm3 [7]. Femur slices at 3 and 15 mm from the distal end were used for cancellous and cortical BMD measurements. For the slice at 15 mm from the distal end, we measured periosteal and endocortical perimeters and calculated cortical area and the cross-sectional moment of inertia (CSMI) on the frontal plane [8, 13]. CSMI was defined by the pQCT software as ∑ai(yi − yc)2, where ai is the voxel area and yi − yc is the distance in the vertical direction from each voxel to the horizontal axis passing through the center of the area. The sum was performed over the voxels that were defined as cortical bone by the attenuation threshold. We performed measurements of tibia slices at 5 and 17 mm from the proximal end. A 1.5-mm slice in the middle of the L4 vertebra was scanned to determine cancellous BMD and BMC. Three replicate scans of the 460 μm thick slices were performed for each measurement.
Microfocused X-ray computed tomography (micro-CT)
A micro-CT equipped with a microfocus X-ray tube (focus size 8 × 8 µm, MCT-100MF, Hitachi Medical Corporation, Tokyo, Japan) produced a three-dimensional (3D) image of each femur from 200 image slices between 1.5 to 2.75 mm proximal to the growth plate. The tube voltage, tube current, magnification, and voxel size were 70 kV, 100 mA, 7× and 17.8 × 17.8 × 17.8 µm, respectively. Using TRI/3D BON software (Ratoc System Engineering Co. Ltd, Tokyo, Japan), 3D structural parameters such as bone volume (BV, mm3), bone surface area (BS, mm2), bone volume fraction (BV/TV, %), trabecular thickness (Tb.Th, μm), trabecular number (Tb.N, 1 mm−1) and trabecular separation (Tb.Sp, μm), were calculated [26]. For the bone regions we separated cortical bone from trabecular bone by 3D space filtration of the bone marrow cavity; data from the each slice were converted to binary data using a threshold obtained by a discriminant analysis in which the pixel value histograms of background and bone were assumed to be normally distributed. We then chose the threshold as an intermediate pixel value lying on the tails of the two normal distributions.
Mechanical testing
The mechanical properties of the right tibiae were measured using the three-point bending method and an MZ-500S mechanical testing device (Maruto CO. Ltd, Tokyo, Japan). The bending load was applied at 17 mm from the proximal end of the tibia on the posterior surface at a speed of 10 mm/min until fracture, with the anterior surface of the tibia face down on supports separated by 13 mm. The ultimate force, breaking force, stiffness (slope of the load–displacement curve), and work-to-failure (area under the load–displacement curve before fracture) were measured as whole-bone mechanical properties. The intrinsic biomechanical properties such as ultimate stress were calculated using the formula
 |
where Fu is ultimate force and L is the span of the support points (13 mm), c is the half-width of mid-shaft in the load direction from the pQCT pictogram, and I is the CSMI. As in Jamsa et al. [13] we used the slope of the elastic part of the load–displacement curve to give an approximation for the displacement for calculations, because the calculation of elastic modulus has been reported to be inaccurate for the three-point bending test.
Confocal laser Raman spectroscopic measurements
Confocal laser Raman microspectroscopy was used to determine the composition and relative intensities of mineral and matrix in the mid-shaft anterior cortex of the right tibia 17 mm from the proximal end. Values for anterior mineral matrix ratio were similar among periosteal, intracortical and endocortical bone compartments (data not shown). Therefore, we chose the intracortical compartment for our measurements. A Nicolet Almega XR Dispersive Raman microscope system equipped with the OMNIC Atlμs imaging software program (ThermoFisher Scientific, Inc., MA) was used as previously reported [20]. An area less than 1 μm3 can be mapped using Atlμs mapping with a visualized sample on the video microscope. A high-brightness, low-intensity laser operating at 780 nm was used as the excitation source with a laser power of 35 mW. Each spectrum is the sum of ten 10 s measurements. In the Raman system, the confocal aperture has a pinhole of 50 μm diameter. The image area of the CCD used for capturing the grating spectra was reduced to 360 lines/mm in the confocal mode. The Rayleigh line was removed from the collected Raman scattering by a holographic notch filter located in the collection path. Raman scattering was detected using a CCD camera at a spectral resolution of 3.85 cm−1. The peak areas were calculated between the following Raman shift numbers: PO3−4 ν1, 981.9–925.7 cm−1; PO3−4 ν4, 631.0–545.8 cm−1; CO2−3 ν1, 1087.9–1052.1 cm−1; amide I, 1716.3–1541.2 cm−1; amide III, 1298.1–1214.4 cm−1; CH2 wag, 1492.6–1363.6 cm−1 as in Akkus et al. [1]. Crystallinity was determined as the inverse of the width of the phosphate symmetric-stretch band (PO3−4 ν1 at 959 cm−1) at half the maximum intensity value [37].
Histology
For sclerostin staining, the distal halves of six left femurs from the four treatment/control groups were decalcified in 0.5 M EDTA for 14 days at 4°C and embedded in paraffin to make 4 μm sections. The Baseline rat group was not examined. Anti-mouse SOST goat polyclonal antibody AF1589 (R & D Systems, Minneapolis, MN) was used at 20 μg/ml. Sclerostin-positive brown cells, stained with 3,3′-diaminobenzidine tetrahydrochloride as a peroxidase substrate for the secondary anti-goat IgG, and the total, including hematoxylin-counterstained blue cells, were counted. To estimate the number of sclerostin-positive osteocytes, we counted more than 200 cells in each area, and five areas across the entire width were counted in six specimens from each group.
Bone canaliculi were stained by Bodian’s method, a method we have described previously [12]. Briefly, deparaffinized 4 μm tibia sections were incubated in a protein–silver solution containing copper pellets at 37°C for 24 h and then reduced with 5% formalin in 1% hydroquinone for 30 min at room temperature. The sections were then treated with 0.5% gold chloride solution for 50 min and with 2% oxalic acid solution for 60 min. Finally, the sections were dehydrated and embedded for microscopic observations.
Statistical analysis
Except in Fig. 1, all data values are presented individually with the horizontal lines showing median values ± SEM. Statistical evaluation was by analysis of variance (ANOVA) with Bonferroni’s multiple comparison test. To compare two groups, the Mann–Whitney test was used. P < 0.05 was defined as significant; ***P < 0.001, **P < 0.01, *P < 0.05. For data analysis, a commercially available statistics package, Prism 4 (GraphPad Software, La Jolla, CA), was used. In figures, asterisks show differences between treatment/control groups and pound symbols show differences between the Baseline and Sham-Walking groups. Due to the fact that the 14-week rats grew during the 15-week experiment, many parameters changed because of this growth.
Results
Body weight and bone measurements
There was no significant difference in the body weight values or the lengths of L4 vertebra, femur, or tibia between the four experimental groups. Forced inactivity caused no significant effect (data are supplied in Supplementary Table S1). Values in the treatment groups may be greater than the 14-week baseline values because of normal skeletal growth.
Biochemical markers of bone turnover
The serum levels of type I collagen CTx and Rat-MID osteocalcin were analyzed for bone resorption and bone formation levels, respectively (Fig. 1c, d). At weeks 1 and 4 after the operation, the CTx values of the OVX-Walking group were significantly elevated compared to both Sham groups (P < 0.05). The CTx values of OVX-Inactive rats were also significantly higher than those of the Sham-Walking group at 1 week (Fig. 1c, P < 0.05). At weeks 8 and 12, these CTx values were elevated only compared to the Sham-Inactive group (P < 0.05). The osteocalcin levels of the OVX rats were significantly higher than those of Sham rats at 4 weeks (Fig. 1d, P < 0.05). Forced inactivity had no apparent effect on osteocalcin.
Cancellous bone parameters as determined by micro-CT and pQCT analysis
The effect of forced inactivity and OVX on cancellous bone parameters was assessed by micro-CT and pQCT. Figure 2a shows representative reconstructions from 3D micro-CT images of L4 vertebra and of tibia epiphysis at 14 weeks (Baseline) and after 15-week treatment at 29 weeks. Rats in both the OVX-Walking and OVX-Inactive groups showed severe osteoporotic thinning of cancellous bone. Micro-CT results show that the Sham-Inactive BV/TV value alone is significantly different from the Sham-Walking counterpart in tibial structural measurements, while all parameters in OVX-Inactive L4 vertebra and Tb.Sp in OVX-Inactive tibia are significantly different from those in the OVX-Walking group in a catabolic manner (Table 1, P < 0.05). Inactivity elicited no deficit in the tibia and was mostly insignificant in L4 cancellous bone unless combined with ovariectomy (Table 1). The pQCT analysis (Fig. 2b) showed that cancellous BMD was significantly lower only in the OVX groups against the Sham groups (P < 0.05). The BMD value was also significantly lower in the OVX-Inactive group than in the OVX-Walking group in L4 vertebra.
Fig. 2.
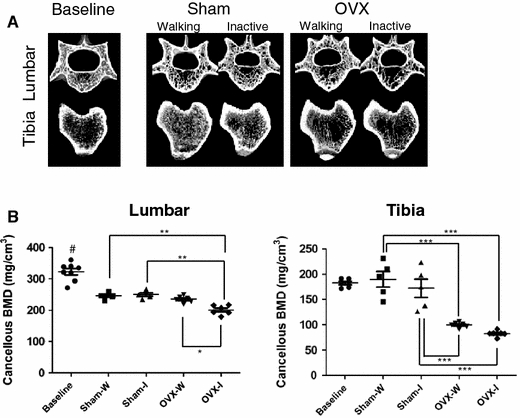
Effect of inactivity on micro-CT and pQCT parameters for both Inactive groups. a Representative 3D images of a lumbar vertebra (L4) and tibia at 14 weeks (Baseline, BL) and after 15 weeks of forced inactivity (at 29 weeks). b Cancellous BMD values from pQCT measurements. Filled circles, squares, triangles, down-pointing triangles and diamonds represent individual values in Baseline, Sham-Walking, Sham-Inactive, OVX-Walking and OVX-Inactive groups, respectively. Data values for each rat are plotted together with three horizontal lines the show the values of the median and ± SEM. Asterisks above connected pairs of values indicate significant differences (***, **, and * correspond to P < 0.001, P < 0.01 and P < 0.05, respectively). A pound symbol indicates a significance difference (P < 0.05) between the Baseline and Sham-Walking groups
Table 1.
Parameters by micro-CT analysis of 4th lumbar (L4) and tibia epiphysis
| Parameter | Baseline (14 weeks) | Treatment (29 weeks) | |||
|---|---|---|---|---|---|
| Sham-Walking | Sham-Inactive | OVX-Walking | OVX-Inactive | ||
| BV/TV (%) | |||||
| L4 | 41.3 (1.4) | 27.0 (1.5) | 26.2 (1.5) | 23.8 (1.0)a | 19.6 (1.3)abc |
| Tibia | 22.1 (3.6) | 17.3 (1.2) | 13.8 (1.6)a | 6.0 (0.6)ab | 3.6 (0.4)ab |
| Tb.Th (μm) | |||||
| L4 | 71.4 (2.3) | 69.1 (1.4) | 66.8 (2.1) | 67.5 (1.2) | 64.3 (1.9)abc |
| Tibia | 56.0 (0.7) | 61.0 (1.4) | 55.6 (1.8) | 54.3 (1.8) | 48.6 (1.6)a |
| Tb.N (mm−1) | |||||
| L4 | 5.80 (0.07) | 3.99 (0.15) | 3.93 (0.11) | 3.57 (0.11) | 3.09 (0.1)abc |
| Tibia | 3.87 (0.24) | 2.76 (0.16) | 2.49 (0.23) | 1.14 (0.08)ab | 0.71 (0.07)ab |
| Tb.Sp (μm) | |||||
| L4 | 102.1 (3.2) | 182.2 (10.2) | 187.5 (8.6) | 213.7 (9.1) | 260.7 (15.1)abc |
| Tibia | 204.4 (15.9) | 304.6 (23.4) | 347.2 (48.7) | 828.6 (61.5)ab | 1373.2 (112.8)abc |
Values are the median (SE); n = 6/group. Within the treatment groups, aP < 0.05, versus Sham-Walking; bP < 0.05, versus Sham-Inactive; cP < 0.05, versus OVX-Walking by Bonferroni’s multiple comparison test. Except for the BV/TV (Tibia) and Tb.Th (L4 and Tibia), all values in the Sham-Walking group are significantly different from the Baseline values, P < 0.05
Cancellous lumbar bone parameters determined by histomorphometry
To confirm that inactivity in Sham rats has no significant effect on the above-mentioned L4 cancellous bone parameters, dynamic histomorphometry was introduced. For all parameters related to bone formation (Fig. 3a–g), significant differences were between Sham and OVX groups (P < 0.05). In addition to the formative parameters, two measures of resorption, osteoclast surfaces (Oc.S/BS) (Fig. 3f) and osteoclast number (N.Oc/B.Ar) (Fig. 3g), were significantly higher for the OVX-Inactive rats than for the Sham-Walking rats (P < 0.001). OVX-Inactive rats showed higher values than for the Sham-Inactive rats (P < 0.01). Sham-Inactive rats showed higher value than for the Sham-Walking rats, only in the N.Oc/B.Ar (P < 0.05). Additive effect of inactivity on ovariectomy was observed.
Fig. 3.
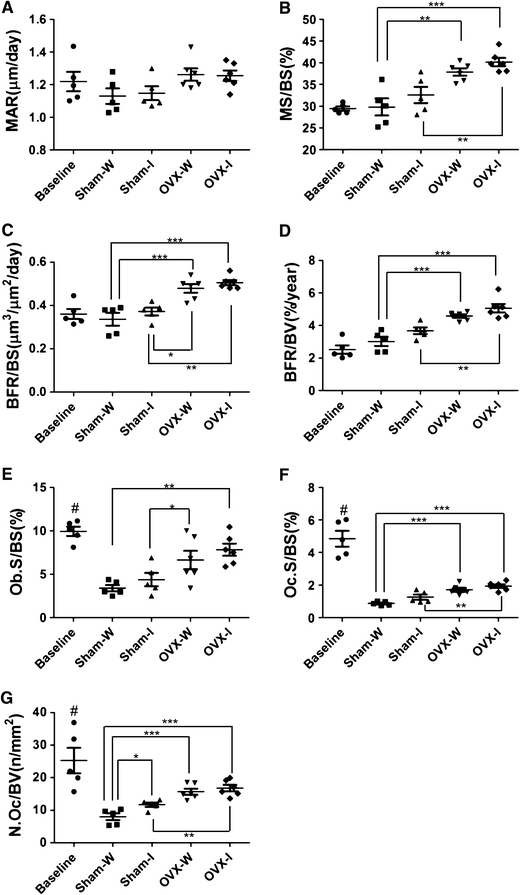
Histomorphometric 2D parameters of cancellous bone in L4 lumbar vertebrae. Parameters are a mineral apposition rate (MAR), b mineralized surface percent (MS/BS), c ratio of bone formation rate to bone surface area (BFR/BS), d ratio of bone formation rate to bone volume (BFR/BV), e osteoblast surface area per unit bone surface area (Ob.S/BS), f osteoclast surface area per unit bone surface area (Oc.S/BS), and g osteoclast number per unit surface area (N.Oc/B.Ar). As in Fig. 2b, individual values are shown, asterisks over connected pairs indicate significant differences, and a poundsymbol indicates a significance difference (P < 0.05) between the Baseline and Sham-Walking groups
Characteristics of cortical bone for inactive and walking rats
Inactivity caused a difference between Sham-Inactive and Sham-Walking rat bones that is apparent in the pQCT tibial tomograms (Fig. 4a). Statistical analysis of the CSMI values corroborated the differences apparent in the tomograms. For tibia samples there was a significant difference in CSMI between both the Sham-Inactive and Sham-Walking and between the Sham-Inactive and OVX-Walking groups. For femur samples, there was a significant difference in CSMI only between the Sham-Inactive and Sham-Walking groups (Fig. 4b, P < 0.05). pQCT also showed that femoral and tibial cortical area (Ct.Ar), marrow area (Ma.Ar) and cortical perimeters (Ps-Pm and Ec-Pm) and cortical BMC (significant only in femur) in Sham-Inactive rats were less than the values for their Walking counterparts, with the exception of BMD and cortical thickness (Ct.Th). In OVX groups, fewer parameters exhibited significant differences between the Inactive and Walking groups as in cortical BMC and area (Ct.Ar) for both femur and tibia and pericortical perimeter (Ps-Pm) for tibia alone (Table 2, P < 0.05). Values for femur and tibia were found to be highly correlated (cortical BMC: r2 = 0.822 at P < 0.001, cortical area: r2 = 0.864 at P < 0.001, CSMI: r2 = 0.681 at P < 0.01; n = 24). As shown in the Ec-Pm and Ma.Ar, the marrow cavity was significantly narrower in the Sham-Inactive group compared to both Walking groups (Table 2). To characterize the narrow marrow space in the Sham-Inactive cortex, Bodian’s staining was introduced to visualize the endocortical surface layers of osteocytes (Fig. 4c). In the tibia of the Walking rats, osteocytes and their canaliculi were more regularly arranged along the lamellar layers as in the tibia of the Baseline 14-week-old rats. In Sham-Walking bones, osteocytes were arranged in lines within the perfectly aligned lamellar stacking structure. The canaliculi are typically perpendicular to the lacunae and the lamellar boundaries. On the contrary, in the endocortical bone of Inactive rats, the osteocyte lacunae were not arranged in lines, but instead were associated with knotty canaliculi running in zigzags.
Fig. 4.
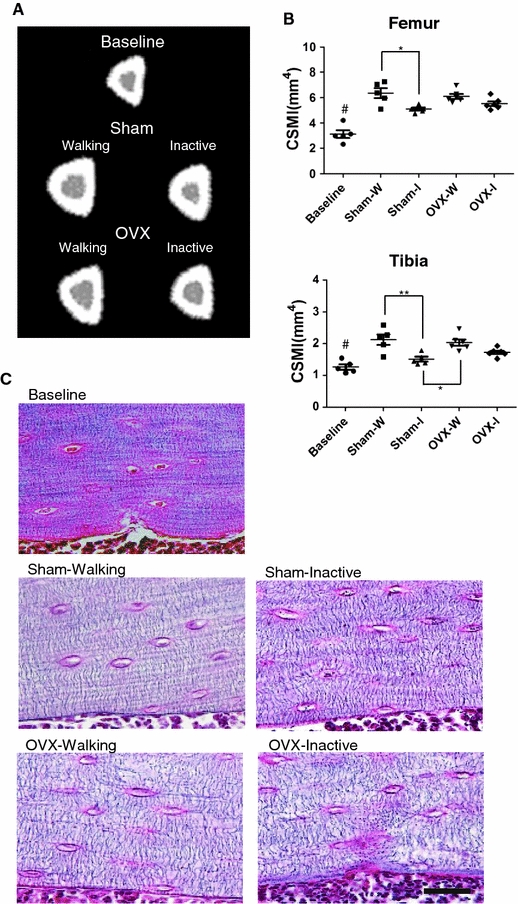
Characterization of tibial and femoral cortical bone. a Cross-sectional pQCT tomograms of tibia show differences brought by 15-weeks of inactivity, OVX, or both. b Cross-sectional moment of inertia (CSMI, axis on the frontal plane) calculated from the pQCT measurements as described in “Materials and methods”. Some other parameters are provided in Table 2. As in Fig. 2b, individual values are shown, asterisks over connected pairs indicate significant differences, and a pound symbol indicates a significance difference (P < 0.05) between the Baseline and Sham-Walking groups. c Characteristics of osteocyte canaliculi visualized by Bodian’s staining in the endocortical surface area at mid-shaft of the left tibia. Four experimental groups and the baseline group are compared. Bars represent 50 μm
Table 2.
Parameters by pQCT analysis of femur and tibia diaphysis
| Parameter | Baseline (14 weeks) | Treatment (29 weeks) | |||
|---|---|---|---|---|---|
| Sham-Walking | Sham-Inactive | OVX-Walking | OVX-Inactive | ||
| Ct.BMD (mg/cm3) | |||||
| Femur | 1279 (4) | 1367 (5) | 1368 (3) | 1366 (3) | 1375 (3) |
| Tibia | 1235 (3) | 1347 (3) | 1345 (5) | 1355 (5) | 1354 (7) |
| Ct.BMC (mg/mm) | |||||
| Femur | 4.9 (0.1) | 8.3 (0.2) | 7.4 (0.2)a | 8.3 (0.2)b | 7.5 (0.1)ac |
| Tibia | 3.4 (0.1) | 5.6 (0.2) | 5.3 (0.1) | 6.0 (0.1)b | 5.2 (0.1)c |
| Ct.Ar (mm2) | |||||
| Femur | 3.8 (0.1) | 6.1 (0.1) | 5.5 (0.1)a | 6.0 (0.1)b | 5.4 (0.1)ac |
| Tibia | 2.7 (0.1) | 4.2 (0.1) | 3.9 (0.2)a | 4.3 (0.1)b | 3.9 (0.1)c |
| Ct.th (mm) | |||||
| Femur | 0.54 (0.01) | 0.68 (0.01) | 0.66 (0.01) | 0.68 (0.02) | 0.63 (0.01) |
| Tibia | 0.49 (0.01) | 0.68 (0.02) | 0.68 (0.01) | 0.71 (0.02) | 0.64 (0.01) |
| Ma.Ar (mm2) | |||||
| Femur | 2.46 (0.09) | 3.71 (0.20) | 3.06 (0.05)a | 3.57 (0.08)b | 3.45 (0.07) |
| Tibia | 1.35 (0.04) | 1.50 (0.10) | 1.03 (0.03)a | 1.33 (0.08)b | 1.30 (0.04)b |
| Ps-Pm (mm) | |||||
| Femur | 8.9 (0.1) | 11.1 (0.2) | 10.4 (0.1)a | 10.9 (0.1)b | 10.5 (0.1) |
| Tibia | 7.1 (0.1) | 8.3 (0.2) | 7.8 (0.1)a | 8.4 (0.1)b | 8.1 (0.1)c |
| Ec-Pm (mm) | |||||
| Femur | 5.6 (0.1) | 6.8 (0.2) | 6.2 (0.1)a | 6.7 (0.1)b | 6.6 (0.1) |
| Tibia | 4.1 (0.1) | 4.3 (0.2) | 3.6 (0.1)a | 4.1 (0.1)b | 4.1 (0.1) |
| CSMI (mm4) | |||||
| Femur | 3.0 (0.3) | 6.4 (0.4) | 5.1 (0.1)a | 6.1 (0.2) | 5.5 (0.2) |
| Tibia | 1.2 (0.1) | 2.2 (0.2) | 1.4 (0.1)a | 2.0 (0.1)b | 1.7 (0.1) |
Values are the median (SE); n = 6/group. Within the treatment groups, aP < 0.05, versus Sham-Walking; bP < 0.05, versus Sham-Inactive; cP < 0.05, versus OVX-Walking by Bonferroni’s multiple comparison test. All values in the Sham-Walking group except for the tibial Ec-Pm are significantly different from the Baseline values, P < 0.05
Mechanical properties
The mechanical properties of tibia were analyzed by the three-point bending test. The tibia was chosen because of less change due to growth during the 15-week experiment. From the measurements of ultimate force, stiffness and work-to-failure, material properties such as ultimate stress, elastic modulus and toughness were calculated. Although there was a trend of lower measured values in the Inactive groups than in the Walking groups (Supplementary Fig. S1A–C), the differences between the four experimental/control groups were not significant (Supplementary Fig. S1A–F). However, the combined Inactive group (Sham-Inactive and OVX-Inactive) showed significantly lower values than the combined Walking group in the ultimate force/ultimate stress parameters (Fig. 5a, d). While the trend shows lower toughness and higher elastic modulus values for the Inactive group, no other parameters showed any significance (P < 0.05).
Fig. 5.
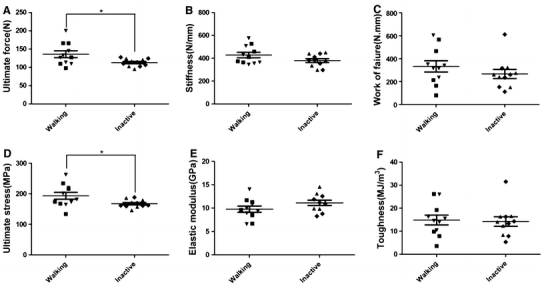
Effects of inactivity and OVX on mechanical properties of tibia. The whole-bone mechanical properties measured were a ultimate force, b stiffness (slope of the load–displacement curve), and c work-to-failure (area under the load–displacement curve before fracture). The intrinsic biomechanical properties are d ultimate stress, e elastic modulus, and f toughness. Individual values are marked as in Fig. 2b. Significance was presented as in Fig. 2b between the combined Walking and combined Inactive groups (***P < 0.001 and *P < 0.05). Separate results for four groups can be found in Supplementary Fig. S1
Cortical bone analysis by confocal laser Raman microspectroscopy
The matrix and mineral components in anterior intra-cortical bone were studied by confocal laser Raman microspectroscopy in the femur and tibia (Fig. 6a). Raman spectra of tibia reveal the resolvable mineral factor to be carbonated apatite (Fig. 6b). The peak wave numbers were almost identical to those reported by Tarnowski et al. [30], and the resolvable matrix factor was of a collagenous protein. The profiles of mineral parameters such as carbonate/phosphate ratio and crystallinity were similar for all five groups, and the Sham-Inactive mineral-to-matrix ratio showed a trend of generally higher ratio regardless of mineral or matrix species (Supplemental Fig. S2).
Fig. 6.
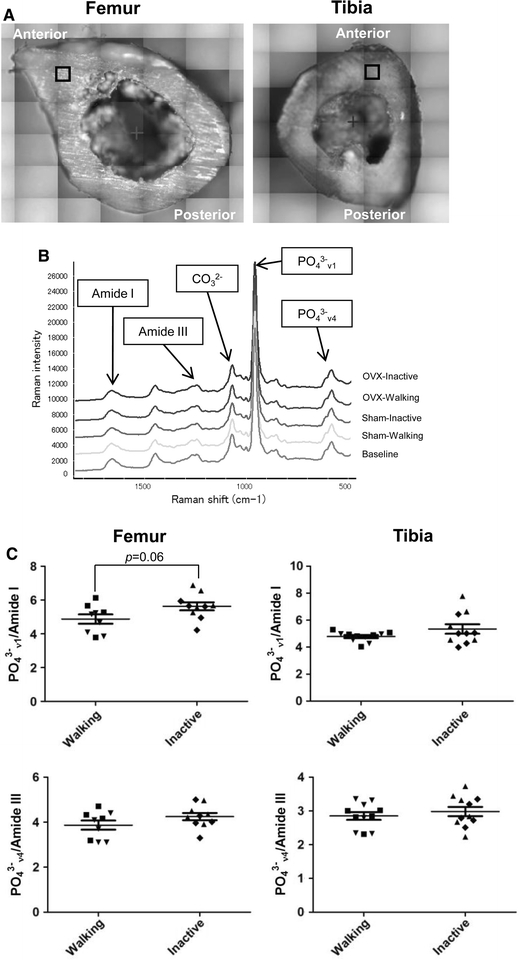
Effect of interventions on mineral and matrix parameters analyzed by intracortical measurements of bone components by confocal laser Raman vibrational spectroscopy. a Site of measurements in femur and tibia, b representative tibia spectra from the five groups including a Baseline (BL) 14-week control, and c ratios of peak intensities from PO3−4 ν4, 580 cm−1; PO3−4 ν1, 959 cm−1; CO2−3, 1072 cm−1; amide III 1242 cm−1 and amide I, 1666 cm−1 are shown. Individual values are marked as in Fig. 2b. The difference between PO3−4 ν1/amide I in the combined Walking and the combined Inactive groups was not significant except in femur, where P = 0.06. Separate results for four groups can be found in Supplementary Fig. S2
In the combined Inactive group, the mineral-to-matrix ratio showed higher values than the Walking counterpart (Fig. 6c, PO3−4 ν1/amide I in femur, P = 0.06), while Sham and OVX groups were not significantly different (data not shown). Profiles of PO3−4 ν4, amide III and their ratio PO3−4 ν4/amide III, are also examined since PO3−4 ν1 and amide I, commonly used for the determination of mineral and organic components, are sensitive to the orientation and the polarization direction of the incident light, while bands such as amide III, PO3−4 ν2 and PO3−4 ν4 are less susceptible to these orientational effects [16]. In fact, PO3−4 ν1/amide I showed lower P value than PO3−4 ν4/amide III (Fig. 6c).
Characteristics of osteocytes
Cortical osteocytes in the anterior segment were characterized by immunohistochemical staining of sclerostin, a SOST gene product found in osteocytes (Fig. 7a, b). The expression of sclerostin, which modulates the proliferation and differentiation of osteoblasts, inhibits bone formation [29, 33, 35]. In the cortices of the Inactive group, strong sclerostin staining appeared evenly throughout the mid- and outer cortex, spread through the canaliculi, on cells and on the lacuna wall except for the endocortical surfaces. In contrast, there was only a limited expression of sclerostin in the corresponding specimens from the Walking group. Immunoreactive cells and negative blue-stained cells alternated in patches. Even when present, sclerostin was localized mainly on the cell bodies or on the lacuna walls (Fig. 7b). Counts of sclerostin-positive osteocytes per unit area in the cortex in Fig. 7c showed that the number for the Sham-Inactive group (161 ± 18) is significantly larger than the number for the Sham-Walking group (121 ± 21) (P < 0.05).
Fig. 7.
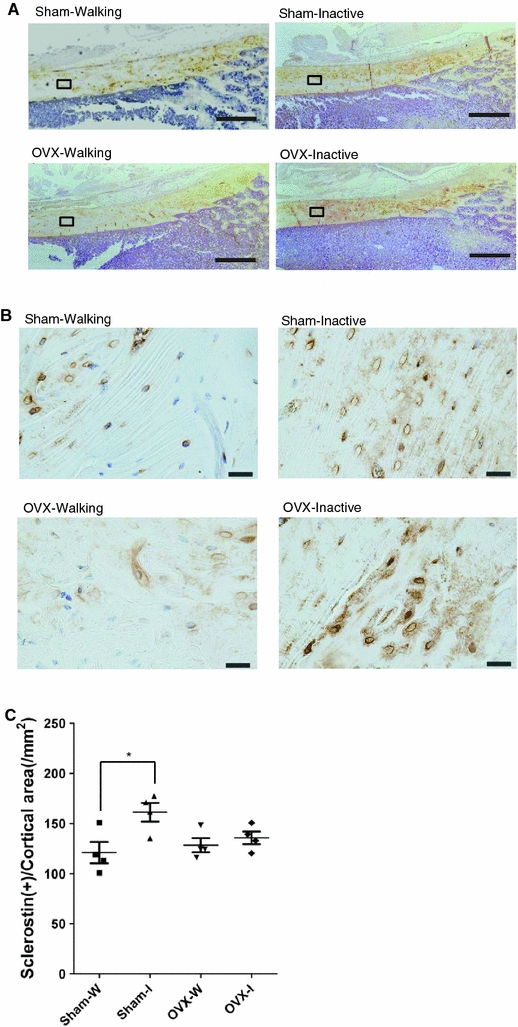
Immunohistochemical staining of sclerostin (a, b) and the numbers of positively-stained osteocytes (c) in the Walking and Inactive rat groups. Cortical sections were prepared from decalcified bone from the distal half of the left femur that had been embedded in paraffin. Localization of sclerostin visible in the intracortical area bounded by rectangles in a was magnified as in b. Original magnifications are ×10 (a) and ×40 (b). Bars represent 500 μm in a and 50 μm in b. Note the heavy staining of lacuno-canalicular network in both the Sham-Inactive and OVX-Inactive rat groups in b; stained cell bodies and lacunae were detected in patches in the Walking rat groups. In c, number of stained cells were compared by counting over two hundred cells in each of the five areas in each sample (n = 4). Individual values are marked as in Fig. 2b. *Significance between the intervention/control groups (P < 0.05). The Baseline rat group was not examined
Discussion
Although postmenopausal estrogen loss is an essential factor in the pathogenesis of osteoporosis in elderly women, there is no proper measure to estimate how lack of physical activity contributes to this pathogenesis. It will be beneficial to identify the two components experimentally in order to better understand postmenopausal osteoporosis. Our model was not intended to entirely deprive rats of movement. Rather, we wished to mimic the conditions of elderly women who walk less than a mile a week [18]. Our data show that inactivity causes local deterioration of cortical bone material properties such as ultimate stress as well as of geometry, but that estrogen deprivation does not (Figs. 4, 5, 6, 7, S1). It should be noted, however, that the overall turnover of bone, as judged by the serum bone turnover markers, is solely dependent on estrogen status. To our surprise, fewer cortical parameters exhibited significant differences between the OVX-Inactive and OVX-Walking groups than between the Sham-Inactive and Sham-Walking groups. Specifically, deterioration does not necessarily accompany anomalous resorption or degradation of bone matrix.
Entirely different results from our underuse model have been reported in most hind-limb unloading models of rodents. In rapid endocortical bone loss in hind-limb-unloaded male mice at 10–14 weeks of age, osteoclasts were reported to play a critical role; sympathetic nervous tone mediates unloading-induced 40–60% loss of trabecular BV/TV in 10 days, which acts through suppression of bone formation by osteoblasts and enhancement of resorption by osteoclasts [17]. Earlier, Bagi et al. [3] reported in female SD rats at 15 weeks of age that ovariectomization and hind-limb-unloading both increased endocortical resorption surface, endocortical perimeter, and expansion of the marrow cavity after 12-week intervention. These results with similar age rodents are entirely different from those obtained with our inactive rat model; however, other models with much younger rats showed rather similar results to ours: hind-limb unloading did not increase marrow area in a 2-week experiment, which started when the rats were 4–5 weeks of age [10]. In an extreme case, bandaging the leg at 4 weeks of age and a longer 20-week unloading caused severe constriction of marrow volume to 18% of the control leg as reported for the endocortical bone of rat tibia [36]. In the underused hind-limb bones of 14-week rats in the current study, cortical BMD is not lower, nor is cortical thickness more decreased in the Sham-Inactive group than in the Sham-Walking group after a 15-week intervention. The difference in the tibial trabecular bone BV/TV was only 20% with and without the 15-week inactivity. Moreover, in L4 vertebrae a trend towards higher osteoblast recruitment and activity are found in inactive rat groups (Fig. 3). In the endocortical bone the marrow area was significantly smaller, as shown in Table 2. We observed higher mineralized perimeter and bone formation rates in the Sham-Inactive group than in the Sham-Walking group (data not shown). In one of the few studies of reduced walking-related strain, Thomas et al. [31] reported a similar effect on trabeculae (29% loss of trabecular BV/TV after 12 weeks) and a 90% increase in endocortical bone formation rate/bone surface (BFR/BS) in an adult sheep model of hock-joint immobilization. Although it is in a hoofed animal, endocortical bone formation occurred as a result of forced underuse in an adult animal. The reasons for the variable responses, either because of skeletal growth or the involvement of a β-agonist, remain to be resolved. Unfortunately, our use of skeletally immature rats prevented us from differentiating the effects of growth from those of inactivity. In our study, we used 14-week-old rats, which grew significantly during the 15-week experiment. The effect of ovariectomy was similar to that observed in the 10-week rats [28] in that no significant difference in the marrow area was observed in comparison to the Sham groups. In the future, we will use skeletally mature rats as a model to study the effects of inactivity in postmenopausal osteoporosis.
In our current experiment using adult rats in a new model system of inactivity, we have shown that the major structural parameters determining the strength of cortical bone depend on physical activity and not on estrogen status. First, the geometric parameters showed that for the Sham-Inactive group, the periosteal and endocortical perimeters were significantly shorter, the cross-sectional area of the marrow was significantly less, and the CSMI was significantly less compared to the values for walking rats (P < 0.05). A difference in strength is predictable in part from such structural changes, which give rise to different CSMI [9, 13]. Beck et al. [4] reported that women who were more active had geometrically stronger femurs although the effects are underestimated when using BMD as an outcome. Secondly, the Inactive rat tibia can be weaker with more sclerostin-positive osteocytes per area of cortical bone (Fig. 7c) that results in inhibited activity and apoptosis of osteoblasts connected to these osteocytes as discussed below [2, 12, 25, 33, 35]. In addition, if the ratio of cortical bone mineral/matrix ratio, obtained by vibrational Raman spectroscopy, is significantly larger in the Inactive rat group than in the Walking group, this means that mineral intensity per unit matrix intensity is higher. The BMC values derived from pQCT analysis, however, showed that Inactive rat femur have a significantly lower BMC than in the Walking rats. This means that the matrix intensity in the cortical bone of the Sham-Inactive rat group is lower. Lower matrix intensities are derived not only from >C=O vibration (amide I and amide III) but also from >CH2 vibration (a trend, data not shown). Whether it is the difference in mineral/matrix content or the orientation, which was reported by Kazanci et al. as prevalent in PO3−4 ν1/amide I ratio [16], Inactive rat cortex is different from that in the Walking rat. Comparing the inbred strains of mice, Courtland et al. reported that A/J mouse femora had a higher mineral/matrix ratio and a significantly larger (21%) modulus (34.9 ± 4.4 GPa) than C57BL/6J (B6) femora (27.4 ± 4.1 GPa). Such B6 femora, however, performed 47% more work-to-failure than A/J femora and demonstrated toughness by nearly 60% more total strain [6]. The indication that A/J femora are more brittle than B6 femora [6], appears similar to our data comparing Inactive rat tibia against the Walking controls. Although not significant, modulus values are higher and toughness (work of failure) values are lower in the Inactive groups (Fig. 5e, f, c), supporting the brittleness of the tibial cortex. As seen in Supplementary Figs. S1 and S2, estrogen status is not a determinant of material properties.
The smaller marrow area in the Sham-Inactive group, which may have resulted from the slower growth as a consequence of inactivity (Fig. 4; Table 2), explains, at least in part, the geometrical differences such as the smaller CSMI and the poor mechanical properties in the Inactive rat underused bone. We have reported that younger osteocytes maintain the synthetic activity and are more sensitive to stretching than their older, deeply embedded counterparts [22, 23]. Although in Fig. 4, we have not been able to quantify the degree of orderliness of the osteocyte layers close to the endocortical surface, many images of Inactive rat tibia suggest that the lacuno-canalicular orientation is irregular in the endocortical surface. In contrast, the cells in the Walking rat bone have a more orderly appearance within the parallel lamellae. In accordance with the less sclerostin staining of the surface osteocytes apparent in inactive rats, younger osteocytes towards the surface were reported to express no sclerostin [24]. Sclerostin, the SOST gene product of osteocytes, was originally reported as a bone morphogenetic protein (BMP) antagonist secreted from osteocytes. It modulates proliferation and differentiation of osteoblasts and thus inhibits bone formation. The osteoblasts also become apoptotic, where sclerostin is transmitted through the canalicular network [12, 33, 35]. In this study as well, the results suggest that the inhibitory message is distributed within the cortical bone of Inactive rat tibiae. Moreover, previous reports suggest that sclerostin, which antagonizes the action of Wnt, is strongly associated with the lack of mechanotransduction through the Wnt-β-catenin pathway [2, 25]. These findings correlate with the staining profiles that we observed in Fig. 7. In the Inactive rat intracortical osteocytes, heavy sclerostin staining is generally distributed along the canaliculi, except in the above-mentioned cells at the endocortical surface area. A larger number of sclerostin-positive cells per area were found only in the Sham-Inactive rat group (Fig. 7c). In this regard, OVX experiments showed that the lack of SOST-sclerostin plays a critical role in the drift of cortical bone in 30-week-old female SOST knockout (KO) mice observed 8 weeks after OVX [5]. While SOST-KO mice have high bone mass and high BMD in cortical bone, they showed a greater decline after OVX than did wild-type mice in the midshaft femur, in which the endocortical perimeter lengthened to expand the marrow cavity by 70%. The long bones of ovariectomized SOST-KO mice may represent an extreme case of enlarged perimeters generally found in ambulant postmenopausal females. It is possible that sclerostin somehow protects long bones in inactive postmenopausal females. Further studies on the crosstalk between the signaling pathways of sclerostin and estrogen, especially in older rats, will shed light on the role of osteocytes in underused conditions. We propose that daily activity, such as walking, is an independent determinant of the properties of rat cortical bone in femur and tibia. Our inactive rat model will be useful in the future study of the role that daily activity plays in the development of osteoporosis.
Electronic supplementary material
Below is the link to the electronic supplementary material.
Figure S1. Effects of inactivity and ovariectomy on mechanical properties of tibia. The whole-bone mechanical properties measured were (A) ultimate force, (B) stiffness (slope of the load-displacement curve), and (C) work of failure (area under the load-displacement curve before fracture). The intrinsic biomechanical properties are (D) ultimate stress, (E) elastic modulus, and (F) toughness. Filled circles, squares, triangles, down-pointing triangles and diamonds represent individual values in Baseline, Sham-Walking, Sham-Inactive, OVX-Walking and OVX-Inactive groups, respectively (PPT 2417 kb)
Figure S2. Effect of interventions on mineral and matrix parameters analyzed by intracortical measurements of bone components by confocal laser Raman vibrational spectroscopy. Ratios of peak intensities from PO3−4 ν4, 580 cm−1; PO3−4 ν1, 959 cm−1; CO2−3, 1072 cm−1; amide III 1242 cm−1 and amide I, 1666 cm−1 are shown. Crystallinity was determined as the inverse of the width of the phosphate symmetric-stretch band (PO3−4 ν1 at 959 cm−1) at half the maximum intensity value. Individual values are marked as in Fig. S1. (DOC 35 kb)
Acknowledgments
We thank Mamoru Komatsu, ThermoFischer Scientific, Japan, and Dr. Hideaki Takahashi, Niigata University of Health and Welfare, for their helpful discussion and support during the course of this study. We also thank Y. Funayama for his technical assistance. This investigation was supported in part by grants-in-aid from the Ministry of Science, Education, and Culture of Japan to YM-T.
References
- 1.Akkus O, Adar F, Schaffler MB. Age-related changes in physicochemical properties of mineral crystals are related to impaired mechanical function of cortical bone. Bone. 2004;34:443–453. doi: 10.1016/j.bone.2003.11.003. [DOI] [PubMed] [Google Scholar]
- 2.Armstrong VJ, Muzylak M, Sunters A, Zaman G, Saxon LK, Price JS, Lanyon LE. Wnt/beta-catenin signaling is a component of osteoblastic bone cell early responses to load-bearing and requires estrogen receptor alpha. J Biol Chem. 2007;282:20715–20727. doi: 10.1074/jbc.M703224200. [DOI] [PubMed] [Google Scholar]
- 3.Bagi CM, Mecham M, Weiss J, Miller SC. Comparative morphometric changes in rat cortical bone following ovariectomy and/or immobilization. Bone. 1993;14:877–883. doi: 10.1016/8756-3282(93)90318-5. [DOI] [PubMed] [Google Scholar]
- 4.Beck TJ, Kohlmeier LA, Petit MA, Wu G, Leboff MS, Cauley JA, Nicholas S, Chen Z (2010) Confounders in the association between exercise and femur bone in postmenopausal women. Med Sci Sports Exerc. doi:10.1249/MSS.0b013e3181e57bab [DOI] [PubMed]
- 5.Brommage R, Liu J, Suwanichkul A, Powell DR. High bone mass in sclerostin-deficient knockout mice. Musculoskelet Neuronal Interact. 2006;6:392. [Google Scholar]
- 6.Courtland HW, Nasser P, Goldstone AB, Spevak L, Boskey AL, Jepsen KJ. Fourier transform infrared imaging microspectroscopy and tissue-level mechanical testing reveal intraspecies variation in mouse bone mineral and matrix composition. Calcif Tissue Int. 2008;83:342–353. doi: 10.1007/s00223-008-9176-8. [DOI] [PMC free article] [PubMed] [Google Scholar]
- 7.Ferretti JL. Peripheral quantitative computed tomography (pQCT) for evaluating structural and mechanical properties of small bone. In: An YH, Draughn RA, editors. Mechanical testing of bone and the bone-implant interface. Boca Raton: CRC Press; 2000. pp. 385–405. [Google Scholar]
- 8.Ferretti JL, Capozza RF, Zanchetta JR. Mechanical validation of a tomographic (pQCT) index for noninvasive estimation of rat femur bending strength. Bone. 1996;18:97–102. doi: 10.1016/8756-3282(95)00438-6. [DOI] [PubMed] [Google Scholar]
- 9.Ferretti JL, Mondelo N, Capozza RF, Cointry GR, Zanchetta JR, Montuori E. Effects of large doses of olpadronate (dimethyl-pamidronate) on mineral density, cross-sectional architecture, and mechanical properties of rat femurs. Bone. 1995;16:285S–293S. doi: 10.1016/8756-3282(95)00022-6. [DOI] [PubMed] [Google Scholar]
- 10.Globus RK, Bikle DD, Halloran B, Morey-Holton E. Skeletal response to dietary calcium in a rat model simulating weightlessness. J Bone Miner Res. 1986;1:191–197. doi: 10.1002/jbmr.5650010205. [DOI] [PubMed] [Google Scholar]
- 11.Hori M, Takahashi H, Konno T, Inoue J, Haba T, Sakurada T, Noda T, Fujimoto K. Effect of elcatonin on experimental osteoporosis induced by ovariectomy and low calcium diet in beagles. Nippon Yakurigaku Zasshi. 1984;84:91–98. doi: 10.1254/fpj.84.91. [DOI] [PubMed] [Google Scholar]
- 12.Inoue K, Mikuni-Takagaki Y, Oikawa K, Itoh T, Inada M, Noguchi T, Park JS, Onodera T, Krane SM, Noda M, Itohara S. A crucial role for matrix metalloproteinase 2 in osteocytic canalicular formation and bone metabolism. J Biol Chem. 2006;281:33814–33824. doi: 10.1074/jbc.M607290200. [DOI] [PubMed] [Google Scholar]
- 13.Jamsa T, Jalovaara P, Peng Z, Vaananen HK, Tuukkanen J. Comparison of three-point bending test and peripheral quantitative computed tomography analysis in the evaluation of the strength of mouse femur and tibia. Bone. 1998;23:155–161. doi: 10.1016/S8756-3282(98)00076-3. [DOI] [PubMed] [Google Scholar]
- 14.Kalu DN. Evaluation of the pathogenesis of skeletal changes in ovariectomized rats. Endocrinology. 1984;115:507–512. doi: 10.1210/endo-115-2-507. [DOI] [PubMed] [Google Scholar]
- 15.Kawano S, Kanda K, Ohmori S, Izumi R, Yasukawa K, Murata Y, Seo H. Effect of estrogen on the development of disuse atrophy of bone and muscle induced by tail-suspension in rats. Environ Med. 1997;41:89–92. [PubMed] [Google Scholar]
- 16.Kazanci M, Roschger P, Paschalis EP, Klaushofer K, Fratzl P. Bone osteonal tissues by Raman spectral mapping: orientation-composition. J Struct Biol. 2006;156:489–496. doi: 10.1016/j.jsb.2006.06.011. [DOI] [PubMed] [Google Scholar]
- 17.Kondo H, Nifuji A, Takeda S, Ezura Y, Rittling SR, Denhardt DT, Nakashima K, Karsenty G, Noda M. Unloading induces osteoblastic cell suppression and osteoclastic cell activation to lead to bone loss via sympathetic nervous system. J Biol Chem. 2005;280:30192–30200. doi: 10.1074/jbc.M504179200. [DOI] [PubMed] [Google Scholar]
- 18.Krall EA, Dawson-Hughes B. Walking is related to bone density and rates of bone loss. Am J Med. 1994;96:20–26. doi: 10.1016/0002-9343(94)90111-2. [DOI] [PubMed] [Google Scholar]
- 19.Leblanc AD, Schneider VS, Evans HJ, Engelbretson DA, Krebs JM. Bone mineral loss and recovery after 17 weeks of bed rest. J Bone Miner Res. 1990;5:843–850. doi: 10.1002/jbmr.5650050807. [DOI] [PubMed] [Google Scholar]
- 20.Matsumoto Y, Mikuni-Takagaki Y, Kozai Y, Miyagawa K, Naruse K, Wakao H, Kawamata R, Kashima I, Sakurai T. Prior treatment with vitamin K2 significantly improves the efficacy of risedronate. Osteoporos Int. 2009;20:1863–1872. doi: 10.1007/s00198-009-0888-z. [DOI] [PMC free article] [PubMed] [Google Scholar]
- 21.Meunier PJ, Delmas PD, Eastell R, McClung MR, Papapoulos S, Rizzoli R, Seeman E, Wasnich RD. Diagnosis and management of osteoporosis in postmenopausal women: clinical guidelines. International Committee for Osteoporosis Clinical Guidelines. Clin Ther. 1999;21:1025–1044. doi: 10.1016/S0149-2918(99)80022-8. [DOI] [PubMed] [Google Scholar]
- 22.Mikuni-Takagaki Y, Suzuki Y, Kawase T, Saito S. Distinct responses of different populations of bone cells to mechanical stress. Endocrinology. 1996;137:2028–2035. doi: 10.1210/en.137.5.2028. [DOI] [PubMed] [Google Scholar]
- 23.Miyauchi A, Notoya K, Mikuni-Takagaki Y, Takagi Y, Goto M, Miki Y, Takano-Yamamoto T, Jinnai K, Takahashi K, Kumegawa M, Chihara K, Fujita T. Parathyroid hormone-activated volume-sensitive calcium influx pathways in mechanically loaded osteocytes. J Biol Chem. 2000;275:3335–3342. doi: 10.1074/jbc.275.5.3335. [DOI] [PubMed] [Google Scholar]
- 24.Poole KE, Bezooijen RL, Loveridge N, Hamersma H, Papapoulos SE, Lowik CW, Reeve J. Sclerostin is a delayed secreted product of osteocytes that inhibits bone formation. FASEB J. 2005;19:1842–1844. doi: 10.1096/fj.05-4221fje. [DOI] [PubMed] [Google Scholar]
- 25.Robling AG, Niziolek PJ, Baldridge LA, Condon KW, Allen MR, Alam I, Mantila SM, Gluhak-Heinrich J, Bellido TM, Harris SE, Turner CH. Mechanical stimulation of bone in vivo reduces osteocyte expression of Sost/sclerostin. J Biol Chem. 2008;283:5866–5875. doi: 10.1074/jbc.M705092200. [DOI] [PubMed] [Google Scholar]
- 26.Ruegsegger P, Koller B, Muller R. A microtomographic system for the nondestructive evaluation of bone architecture. Calcif Tissue Int. 1996;58:24–29. doi: 10.1007/BF02509542. [DOI] [PubMed] [Google Scholar]
- 27.Scarpace PJ, Matheny M, Moore RL, Tumer N. Impaired leptin responsiveness in aged rats. Diabetes. 2000;49:431–435. doi: 10.2337/diabetes.49.3.431. [DOI] [PubMed] [Google Scholar]
- 28.Sibonga JD, Dobnig H, Harden RM, Turner RT. Effect of the high-affinity estrogen receptor ligand ICI 182, 780 on the rat tibia. Endocrinology. 1998;139:3736–3742. doi: 10.1210/en.139.9.3736. [DOI] [PubMed] [Google Scholar]
- 29.Sutherland MK, Geoghegan JC, Yu C, Turcott E, Skonier JE, Winkler DG, Latham JA. Sclerostin promotes the apoptosis of human osteoblastic cells: a novel regulation of bone formation. Bone. 2004;35:828–835. doi: 10.1016/j.bone.2004.05.023. [DOI] [PubMed] [Google Scholar]
- 30.Tarnowski CP, Ignelzi MA, Jr, Wang W, Taboas JM, Goldstein SA, Morris MD. Earliest mineral and matrix changes in force-induced musculoskeletal disease as revealed by Raman microspectroscopic imaging. J Bone Miner Res. 2004;19:64–71. doi: 10.1359/jbmr.0301201. [DOI] [PubMed] [Google Scholar]
- 31.Thomas T, Vico L, Skerry TM, Caulin F, Lanyon LE, Alexandre C, Lafage MH. Architectural modifications and cellular response during disuse-related bone loss in calcaneus of the sheep. J Appl Physiol. 1996;80:198–202. doi: 10.1152/jappl.1996.80.1.198. [DOI] [PubMed] [Google Scholar]
- 32.Tou JC, Foley A, Yuan YV, Arnaud S, Wade CE, Brown M. The effect of ovariectomy combined with hindlimb unloading and reloading on the long bones of mature Sprague–Dawley rats. Menopause. 2008;15:494–502. doi: 10.1097/gme.0b013e318148bbad. [DOI] [PubMed] [Google Scholar]
- 33.Bezooijen RL, Roelen BA, Visser A, Wee-Pals L, Wilt E, Karperien M, Hamersma H, Papapoulos SE, Ten DP, Lowik CW. Sclerostin is an osteocyte-expressed negative regulator of bone formation, but not a classical BMP antagonist. J Exp Med. 2004;199:805–814. doi: 10.1084/jem.20031454. [DOI] [PMC free article] [PubMed] [Google Scholar]
- 34.Westerlind KC, Wronski TJ, Ritman EL, Luo ZP, An KN, Bell NH, Turner RT. Estrogen regulates the rate of bone turnover but bone balance in ovariectomized rats is modulated by prevailing mechanical strain. Proc Natl Acad Sci USA. 1997;94:4199–4204. doi: 10.1073/pnas.94.8.4199. [DOI] [PMC free article] [PubMed] [Google Scholar]
- 35.Winkler DG, Sutherland MK, Geoghegan JC, Yu C, Hayes T, Skonier JE, Shpektor D, Jonas M, Kovacevich BR, Staehling-Hampton K, Appleby M, Brunkow ME, Latham JA. Osteocyte control of bone formation via sclerostin, a novel BMP antagonist. EMBO J. 2003;22:6267–6276. doi: 10.1093/emboj/cdg599. [DOI] [PMC free article] [PubMed] [Google Scholar]
- 36.Yamamoto N, Takahashi HE, Jee WSS, Ma LYF. Mechanical stress and bone tissue: histomorphometric study. J Jpn Soc Bone Morphometry. 1997;7:11–16. [Google Scholar]
- 37.Yerramshetty JS, Lind C, Akkus O. The compositional and physicochemical homogeneity of male femoral cortex increases after the sixth decade. Bone. 2006;39:1236–1243. doi: 10.1016/j.bone.2006.06.002. [DOI] [PubMed] [Google Scholar]
Associated Data
This section collects any data citations, data availability statements, or supplementary materials included in this article.
Supplementary Materials
Below is the link to the electronic supplementary material.
Figure S1. Effects of inactivity and ovariectomy on mechanical properties of tibia. The whole-bone mechanical properties measured were (A) ultimate force, (B) stiffness (slope of the load-displacement curve), and (C) work of failure (area under the load-displacement curve before fracture). The intrinsic biomechanical properties are (D) ultimate stress, (E) elastic modulus, and (F) toughness. Filled circles, squares, triangles, down-pointing triangles and diamonds represent individual values in Baseline, Sham-Walking, Sham-Inactive, OVX-Walking and OVX-Inactive groups, respectively (PPT 2417 kb)
Figure S2. Effect of interventions on mineral and matrix parameters analyzed by intracortical measurements of bone components by confocal laser Raman vibrational spectroscopy. Ratios of peak intensities from PO3−4 ν4, 580 cm−1; PO3−4 ν1, 959 cm−1; CO2−3, 1072 cm−1; amide III 1242 cm−1 and amide I, 1666 cm−1 are shown. Crystallinity was determined as the inverse of the width of the phosphate symmetric-stretch band (PO3−4 ν1 at 959 cm−1) at half the maximum intensity value. Individual values are marked as in Fig. S1. (DOC 35 kb)