

Abstract
The C-terminal domain of subunit ε of the bacterial FoF1 ATP synthase is reported to be an intrinsic inhibitor of ATP synthesis/hydrolysis activity in vitro, preventing wasteful hydrolysis of ATP under low-energy conditions. Mutants defective in this regulatory domain exhibited no significant difference in growth rate, molar growth yield, membrane potential, or intracellular ATP concentration under a wide range of growth conditions and stressors compared to wild-type cells, suggesting this inhibitory domain is dispensable for growth and survival of Escherichia coli.
FoF1 ATP synthases are ubiquitous enzymes that synthesize ATP using a transmembrane electrochemical potential of protons or proton motive force (PMF) generated by the respiratory chain across the cytoplasmic membrane of bacteria, the thylakoid membrane of chloroplasts, or the mitochondrial inner membrane (4, 5, 37). The enzyme consists of two parts: membrane-embedded Fo subcomplex (a complex of subunits a, b, and c in bacteria) and hydrophilic F1 subcomplex (composed of subunits α, β, γ, δ, and ε). The enzyme is also known as a molecular motor, which is composed of the stator subcomplex (α, β, δ, a, and b) and the rotor subcomplex (γ, ε, and c), and its rotation is coupled to ATP synthesis and proton flow across the membrane (20, 31, 52). The reaction of the enzyme is reversible; ATP is hydrolyzed into ADP and inorganic phosphate, the rotor subcomplex rotates in reverse, and protons are extruded to the periplasmic side, resulting in the generation of PMF. Although some bacteria utilize the reverse reaction under particular conditions, the primary function of FoF1 ATP synthase is generation of ATP from the PMF. Therefore, the direction of the activity of FoF1 ATP synthase is regulated to avoid wasteful ATP hydrolysis.
Subunit ε in bacterial FoF1 has been known to be an intrinsic inhibitor of F1 and FoF1 complex (18, 21, 23) and is proposed to have a regulatory function (10, 11, 42). Although the inhibitory effects of subunit ε vary among species, in general, ε inhibits ATP hydrolysis activity while repressing ATP synthesis activity to a lesser degree (14, 27). This regulatory function of the ε subunit is mediated almost exclusively by the C-terminal region of ε, which is comprised of two antiparallel α-helices (18, 49, 50). Biochemical and crystallographic studies have revealed that the C-terminal helices can adopt two different conformations (34, 46, 47, 48). In the retracted conformation, the α-helices form a hairpin-like structure and sit on the N-terminal β-sandwich domain of the ε subunit. When the ε subunit exhibits an inhibitory effect, it adopts a more extended conformation in which the C-terminal α-helices extend along the γ subunit, which composes the central stalk. It has also been shown that basic, positively charged residues on the second α-helix of the ε subunit interact with negatively charged residues in the DELSEED segment of subunit β to exert the inhibitory effect (12).
Escherichia coli mutants deleted in the entire ε subunit exhibit a reduced growth rate and growth yield, and this effect is proposed to be a result of a deficiency in assembly of the Fo and F1 complexes (21). The N-terminal β-sandwich domain of the ε subunit is responsible for the assembly of Fo and F1 and is therefore important for efficient coupling between proton translocation through Fo and ATP synthesis/hydrolysis in F1 (15, 39). Deletion of the ε subunit leads to dissociation of the FoF1 complex and wasteful ATP hydrolysis by free (cytoplasmic) F1 and dissipation of PMF through free Fo (21, 22, 51).
While the importance of the entire ε subunit in the whole-cell physiology of E. coli is fairly well established, the role of the regulatory C-terminal region of ε has received little attention and warrants investigation to determine if the regulatory functions (e.g., inhibition of ATP hydrolysis) observed in vitro are manifested in the physiology of E. coli under various growth conditions. To address this question, we constructed isogenic E. coli mutants that were deleted in the C-terminal region of ε subunit (εDC) and used these strains to compare physiological properties of wild-type versus εDC cells under a wide range of environmental conditions and stressors.
The C-terminal domain of the ε subunit regulates ATPase activity in inverted membrane vesicles of E. coli.
To elucidate the proposed regulatory function of the C-terminal helices of subunit ε in the whole-cell physiology of E. coli, chromosomal unmarked and marked (kanamycin resistance cassette) nonpolar deletions of the C-terminal domain of the ε subunit were constructed (Table 1). All chromosomal mutants were constructed using pWM97, as previously described (29). To construct the εDC mutant lacking the C-terminal region of the ε subunit (deleted from residue 94 to 139), designated strain NEMG1 (atpC′ Δ94-139) (Table 1), the following primer pairs were used to amplify (wild-type DNA) a region 700 bp upstream of the atpC start codon (viz. 5′-TTTGAGCTCTGACAACATCTATCGTTACACCCTGGCCGG-3′, SacI) and 279 bp into the coding region of atpC (viz. 5′-TTTGCTAGCTTACGCTTCGTCGAGATCCTGGCCGCGAATTGCGG-3′, including the stop codon and an NheI restriction site). This produced an amplicon of 978 bp (fragment 1). A second PCR product (fragment 2, 721 bp) was generated that includes the stop codon of atpC (viz. 5′-TTTGCTAGCTAACACCGGCTTGAAAAGCACAAAAGCCAGTCTGG-3′ and an NheI site) and 700 bp downstream of this stop codon (viz. 5′-TTTTCTAGAACGCTGGAGTGTTTCGACAGAGATCAGCGGC-3′, including an XbaI restriction site). The two products were ligated (fragment 3) by NheI digestion and cloned into the SacI-XbaI site of pWM97 to generate pNT01 (Table 1). To generate the ε mutant lacking the C-terminal region of the ε subunit using a kanamycin resistance (Kmr) cassette, designated strain NEMG2 [atpC[prime] (94-139)::Kmr] (εDC::Km) (Table 1), the Kmr cassette was cloned from pUC4K and inserted into the NheI site of fragment 3 and then cloned into the SacI-XbaI site of pWM97 to generate pNT02 (Table 1). All plasmid constructs were confirmed by DNA sequencing. pWM97 and its derivatives were maintained in JM109(λ-pir) because the replicon of this plasmid, oriRR6Kγ, requires the Π protein for replication (30). The resultant pWM97 derivatives (pNT01 and pNT02) were electroporated into EMG2 cells (wild type), which are unable to maintain pWM97. After incubation of the transformants in Luria-Bertani (LB) medium, merodiploids in which the plasmid was integrated into the chromosome were isolated by selecting for ampicillin resistance. Lethality in LB with 5% sucrose (the sacB gene) was confirmed. The merodiploid was incubated in LB without ampicillin and sucrose to induce the second homologous recombination event, in which the integrated plasmid region is recombined out. The recombinant was selected by resistance to 5% sucrose and ampicillin sensitivity. All mutants were confirmed by PCR and Southern hybridization. To construct the complementing atpC construct (pNT03) (Table 1), DNA fragments containing the promoter of the atp operon (Patp), to drive atpC expression from the native promoter, and the atpC structural gene and Shine-Dalgarno box were amplified from E. coli EMG2 chromosomal DNA by PCR using the following primer pairs: atpIF (5′-TTTGAATTCTCTGTGTCGCTCGTGAGTCGAAACGTTGC-3′) (EcoRI) and atpIR (5′-TTTCTCGAGTTACCCTTTGTTGTTAATTACAGCCGG-3′) (XhoI); atpCF (5′-TTTCTCGAGCGCCTTAATCGGAGGGTGATATGGC-3′) (XhoI) and atpCR (5′-TTTGTCGACTTACATCGCTTTTTTGGTCAACTCGATAACGCGC-3′) (SalI). The fragments were ligated at the XhoI site and cloned into the EcoRI-SalI site of pHSG575 (Table 1). The construct pNT03 (Patp-atpC) was confirmed by DNA sequencing and transformed into strain NEMG1 (εDC) to generate NEMG3 (AtpC+) (Table 1).
Table 1.
Strains and plasmids used in this study
| Strain or plasmid | Genotypea | Source | Reference |
|---|---|---|---|
| EMG2 (εWT) | Wild type | CGCSb | 2 |
| NEMG1 (εDC) | EMG2 atpC′ Δ94–139 | This study | This study |
| NEMG2 (εDC::Km) | EMG2 atpC′ (94–139)::Kmr | This study | This study |
| NEMG3 (AtpC+) | NEMG1 (εDC) harboring pNT03 Patp-atpC, Cmr | This study | This study |
| JM109(λ-pir) | recA1 endA1 gyrA96 thi hsdR17 supE44 relA1 Δ(lac-proAB) F′[traD36 proAB lacIqlacZΔM15] λ-pir | Lab stock | 33 |
| pWM97 | oriRR6KγoriTRP4, Ampr, sacB lacZα | NBRPc | 29 |
| pNT01 | pWM97 harboring atpC′ Δ94–139 | This study | This study |
| pNT02 | pWM97 harboring atpC′ (94–139)::Kmr | This study | This study |
| pHSG575 | oripSC101, Cmr, lacZα Plac | Lab stock | 44 |
| pNT575 | pHSG575, ΔPlac | This study | This study |
| pNT03 | pNT575, Patp-atpC | This study | This study |
| pUC4K | oripBR322, Ampr Kmr(Tn903), lacZα | Lab stock | 45 |
Kmr, kanamycin resistance; Ampr, ampicillin resistance; Cmr, chloramphenicol resistance; Plac, promoter of lac operon; Patp, promoter of atp operon.
CGCS, The Coli Genetic Stock Center, Yale University.
NBRP, National BioResource Project, National Institute of Genetics, Japan.
The properties of the E. coli εDC strain were compared to those of its isogenic wild-type parent strain (εWT) (Fig. 1). Strains were grown in LB broth (36), and membrane vesicles of E. coli were prepared as described by Suzuki et al. (40, 43). ATP hydrolysis activity was measured using three different assays: an ATP regeneration assay detecting liberation of ADP, detection of inorganic phosphate, and detection of protons using phenol red based on previously published assays (11, 16, 41, 42). The reactions were initiated by the addition of 3 μg membrane vesicles into 1 ml of assay mixture. Where indicated, lauryldimethylamine oxide (LDAO) was used at a final concentration of 0.3%. Inverted membrane vesicles of the εDC mutant exhibited 1.3-fold-higher levels of ATPase activity than those of the εWT strain with increasing concentrations of ATP (Fig. 1A). LDAO, a nonionic detergent, has been shown to activate F1 and FoF1 and to prevent interaction of the ε subunit with the β subunit, leading to a disappearance of the inhibitory effect of the ε subunit (9, 25). When LDAO was included in the ATPase assay, both εDC and εWT were activated by LDAO, but the activities of ATP hydrolysis were comparable (Fig. 1A), suggesting that the ATP hydrolysis activity of the α3β3γ complex is not impaired in the εDC strain.
Fig. 1.

Enzymatic activities of εWT and εDC in inverted membrane vesicles of E. coli. (A) ATP hydrolysis activities of εWT (closed circles and closed triangles [0.3% LDAO]) and εDC (open circles and open triangles [0.3% LDAO]) strains as a function of ATP concentration measured at 37°C using the ATP-regenerating assay as described in Materials and Methods. (B) Left panel: ATP hydrolysis activities of εWT and εDC strains, measured by the liberation of inorganic phosphate (NP assay) or liberation of ADP using the ATP-regenerating assay (PK assay). Where indicated, ADP (NP assay) or Pi (PK assay) was added at 0.5 mM or 2 mM, respectively. Right panel: ATP hydrolysis activities of εWT and εDC strains, measured using the phenol red assay with or without the addition of 0.5 mM ADP or 2 mM Pi. (C) Effect of Pi on ATP-dependent proton translocation was determined at 37°C by the quenching of ACMA. (D) ATP synthesis of εWT and εDC strains at pH 8.0 and 37°C with 0.5 mg of inverted membrane vesicles preincubated for 2 min with 2.5 mM NADH with stirring before the reaction was initiated using 0.75 mM ADP and 2.5 mM Pi. Each point is the result of three experimental replicates, and the standard error associated with these measurements is shown.
Mg-ADP inhibition of FoF1 ATP hydrolysis activity is a well-described regulatory mechanism (13, 53). A combination of Mg-ADP and inorganic phosphate (Pi) has also been reported to inhibit the ATP hydrolysis activity of FoF1 (8). To determine what effect the ε subunit has on this inhibition by ADP and Pi, ATP hydrolysis activity in the presence of these compounds was measured in the εDC and εWT strains (Fig. 1B). Three different ATPase assays were used for these experiments; liberation of inorganic phosphate (Pi) in the presence of ADP (NP assay), liberation of ADP in the presence of inorganic phosphate (PK assay), and proton-pumping activity in the presence of ADP and Pi (phenol red). Using these ATP hydrolysis assays, the εDC strain displayed consistently higher rates of ATPase activity than the εWT strain, and this was unaffected by the presence of high concentrations of Pi (2 mM) (Fig. 1B). In contrast, ADP inhibited both εDC and εWT ATP hydrolysis activity (Fig. 1B). A third assay using phenol red as an indicator of ATPase activity (proton pumping) was used to determine what effect ADP and Pi had in combination on ATPase activity (Fig. 1B, right panel). Using this assay, the εDC strain displayed consistently higher rates of ATPase activity, which were not significantly affected by Pi, than did the εWT strain. ADP inhibited the ATP hydrolysis activity of both the εDC and εWT strains, and a combination of ADP and Pi had a synergistic inhibitory effect on the εWT strain but no greater effect than that of ADP alone for the εDC strain (Fig. 1B, right panel). These data demonstrate that ADP-Pi strongly inhibits ATP hydrolysis by the εWT strain but not the εDC strain, demonstrating that this inhibition requires the presence of the C-terminal helices of the ε subunit. Pi with ADP has been reported to modulate ATP hydrolysis activity and the coupling efficiency of FoF1 from E. coli (8). Although there has been no direct evidence that subunit ε binds Pi, its trypsin sensitivity changes depending on the presence of Pi (28).
Previous work has reported that an E. coli ε mutant defective in the C-terminal region of ε (i.e., truncated after Gln-87) was uncoupled in proton-pumping activity, suggesting a role for the ε subunit as a coupling factor (6). To address this hypothesis, ATP-dependent proton-pumping activities were measured in εDC and εWT inverted membrane vesicles using 9-amino-6-chloro-2-methoxyacridine (ACMA) quenching as described previously (40, 43). The composition of the reaction mixture was 10 mM HEPES-KOH (pH 7.5), 100 mM KCl, 5 mM MgCl2, 300 ng/ml ACMA, 1 mM ATP. ACMA quenching was reversed by the addition of the uncoupler carbonyl cyanide-p-trifluoromethoxyphenylhydrazone (FCCP; 1 μg/ml). The ATP-dependent proton-pumping activities were comparable between the εDC and εWT strains (Fig. 1C). When proton-pumping activity was measured in the presence of increasing inorganic phosphate concentrations, the proton-pumping activity of the εWT strain was inhibited to a greater extent than that of the εDC strain (Fig. 1C), consistent with the phenol red data in Fig. 1B. Our data are consistent with the notion that despite deletion of the C-terminal region of ε, the enzyme remains coupled for proton pumping. It should be noted that the mutant EMG2 atpC′ Δ94-139 used in our study is truncated from residue 94 of the ε subunit, versus the Gln-87-truncated ε mutant previously reported to be uncoupled (6).
To determine the role that the C-terminal region of the ε subunit plays in ATP synthesis activity driven by the PMF, ATP synthesis measurements were performed using inverted membrane vesicles energized with NADH (Fig. 1D). NADH-driven ATP synthesis activity was measured by using a luciferin-luciferase system as previously described (43). The reaction was carried out at 37°C. The activity that synthesized 1 μmol of ATP per min was defined as 1 unit. The rate of ATP synthesis was approximately 20% higher for the εDC strain than for the εWT strain (Fig. 1D). The explanation for the higher rate of ATP synthesis in the εDC strain is not clear, but the data suggest that the C-terminal domain of the ε subunit is not required for efficient coupling between the PMF and ATP synthesis.
Role of ε subunit in vivo: growth kinetics of the εDC strain versus those of the εWT strain in batch and continuous growth.
The in vitro assays suggested that the εDC FoF1 complex is moderately elevated in ATPase activity and is less sensitive to regulation by ADP-Pi. If the C-terminal domain of the ε subunit is playing a crucial role in regulating and/or coupling FoF1 ATP synthase activity in vivo, this may be manifested in the growth kinetics of E. coli at high and low growth rates. To investigate this hypothesis, we measured a range of energetic properties for the εDC and εWT strains growing in batch (fast growth, 25-min doubling time in LB medium) and carbon-limited continuous culture (slow growth, 6.9-h doubling time) in nutrient-rich LB medium and minimal medium (see Tables S1, S2, and S3 in the supplemental material).
When the εDC and εWT strains were grown in batch culture using LB medium, no significant differences were observed in the maximum specific growth rate, final optical density at 600 nm (OD600), external pH, dry weight, membrane potential (Δψ), or intracellular ATP concentration (see Table S1 in the supplemental material). The same was true for cells grown in M9 minimal medium with the following carbon and energy sources: glucose and succinate (see Table S1). Results with acetate as the sole carbon and energy source were also comparable (data not shown). For the determination of Δψ, cells (three 1-ml samples) from exponential phase (batch cultures) and steady state (continuous culture) were taken directly from the flask or fermenter and added immediately to a glass tube containing [3H]methyltriphenylphosphonium iodide ([3H]TPP+)(30 to 60 Ci/mmol; 2.4 nM, final concentration). After incubation for 5 min at 37°C, the cultures (900 μl in triplicate) were filtered rapidly through a 0.45-μM cellulose-acetate filter (Sartorius) as adapted from Zilberstein et al. (54). The filters were washed twice with 2 ml of 100 mM LiCl and dried for 60 min at 40°C. Filters were resuspended in 2 ml of scintillation liquid, and counts per min (cpm) were determined using an LKB Wallac 1214 Rackbeta liquid scintillation counter (PerkinElmer Life Sciences). The intracellular volume (2.8 ± 0.5 μl mg of protein−1) was determined previously (38). The ΔΨ across the cell membrane was calculated from the uptake of [3H]TPP+ according to the Nernst relationship. Nonspecific [3H]TPP+ binding was estimated from cells which had been treated with carbonyl cyanide m-chlorophenylhydrazone (CCCP) (250 μM) for 20 min prior to addition of [3H]TPP+. ATP was extracted from cells by perchloric acid and KOH-NaHCO3 treatment after separation of the cells from the growth medium as previously described (24) and frozen at −70°C. Prior to analysis, samples were thawed and potassium perchlorate was removed by centrifugation (13,000 × g, 5 min, 4°C). The ATP concentration was determined by the luciferin-luciferase method (26). Light output was immediately measured with a luminometer (model FB12; EG&G Berthold) using ATP as a standard.
Under anaerobic conditions, there were no significant differences between the εDC and εWT strains grown on either glucose (fermentative conditions) or glycerol-nitrate (anaerobic respiration) (see Table S2 in the supplemental material). For anaerobic batch culture, rubber-sealed Hungate test tubes with 10 ml of growth medium were used under a nitrogen headspace (O2 free). For anaerobic growth with 40 mM glycerol and 20 mM nitrate, 1 μM Na2MoO4 and 1 μM Na2SeO3 were added to M9 minimal medium (36) with additional iron (10 μM FeSO4), and methylene blue (1.5 μg/ml) was used as an indicator of anaerobiosis. Anaerobic cultures were inoculated (0.1%) using a hypodermic syringe and grown at 37°C without shaking.
During batch growth, the rate of substrate consumption is often greater than that required for growth, i.e., the catabolic and anabolic rates are not precisely matched and energy spilling mechanisms may occur (35). However, in carbon-limited continuous culture at low growth rates, the catabolic and anabolic rates are more tightly coupled (7, 35), and therefore factors that might result in energy wasting/spilling (e.g., unregulated ATP hydrolysis) will be greater and reflected in reduced cell yields. For carbon-limited continuous-culture experiments, a 250-ml culture vessel with a working volume of 150 ml of M9 minimal medium was used (36) with an appropriate carbon source (i.e., glucose, succinate, or acetate, each at a 0.2% final concentration). All carbon sources were confirmed to be limiting for growth at the concentrations used in this study. After inoculation (0.1% inoculum), the culture was left in batch mode, maintaining 50% air saturation, until the OD600 reached 80% of the steady-state OD600 and then switched to continuous mode at a dilution rate of 0.10 h−1, corresponding to a doubling time of 6.9 h. The chemostat was then left running for at least four volume changes before analysis of energetic parameters (membrane potential, ATP content, and substrate utilization) and cell growth (dry weight) was performed. To monitor culture growth, samples were withdrawn aseptically when required, and the OD600 was measured (1-cm light path length). To calculate the molar growth yield (g [dry weight] of cells/g of substrate consumed) on glucose and succinate, cells (50 ml in triplicate) were harvested by filtration, and the filters (0.45 μm; Millipore) were dried at 105°C until a constant dry weight was achieved on consecutive days. Cell-free supernatants were assayed for succinate and glucose. Succinate and glucose were determined using the following detection kits: 10176281035 for succinate and 10716251035 for glucose (Roche).
When the εDC and εWT strains were grown in carbon-limited continuous culture at a dilution rate of 0.1 h−1, the steady-state OD600, cell dry weight, molar growth yield, membrane potential, and intracellular ATP were comparable between the two strains during growth on glucose or succinate (see Table S3 in the supplemental material). The results for acetate were also comparable (data not shown). These data indicate that prominent regulatory features of the ε subunit identified in vitro (e.g., inhibition of ATPase activity, uncoupling of proton translocation, and ATP synthesis) do not appear to play a significant role during growth of E. coli on a range of substrates (fermentable versus nonfermentable), aerobic or anaerobic growth, and high or low growth rate in minimal medium.
Role of the ε subunit during cellular stress.
During the facultative lifestyle of E. coli, various stressors (e.g., low pH, reactive oxygen species, and nutrient deprivation/stationary phase) are encountered, and intracellular ATP is essential for mounting an appropriate physiological response. Initial experiments focused on the growth rate and final OD600 of the εDC and εWT strains grown under a number of environmental stresses and nutrient limitations (Table 2). The only significant difference observed between the εDC and εWT strains was during growth in low-salt medium (Table 2, 1 mM NaCl or 1 mM KCl). The doubling time of the εDC mutant was 50% slower than that of the εWT strain, and this effect was specific for Na+ or K+ ions (Table 2). No differences were noted in the MICs between the εDC and εWT strains for the following ionophores and protonophores: nigericin (K+/H+), monensin (Na+/H+), valinomycin (K+), CCCP (H+), and dinitrophenol (data not shown). We tested the effect of various salt concentrations (0 to 100 mM NaCl) on ATP hydrolysis activity of inverted membrane vesicles for the εDC and εWT strains and found no significant effect on ATPase activity in this concentration range (data not shown).
Table 2.
Effects of stress on growth of εWT and εDC strains
| Stressora | Growth of strainb |
|||
|---|---|---|---|---|
| εWT strain |
εDC strain |
|||
| μmax (h−1) | Final OD | μmax (h−1) | Final OD | |
| Nutrient limitation | ||||
| 0.05% glucose | 0.82 | 0.69 | 0.82 | 0.71 |
| 0.05% succinate | 0.72 | 0.28 | 0.70 | 0.28 |
| 1 mM phosphate | 0.56 | 0.88 | 0.56 | 0.91 |
| 2 mM nitrogen | 0.51 | 0.85 | 0.51 | 0.88 |
| 1 mM NaCl | 0.72 | 0.92 | 0.33 | 0.80 |
| 1 mM KCl | 0.69 | 0.82 | 0.39 | 0.75 |
| 20 μM MgCl2 | 0.69 | 0.82 | 0.71 | 0.87 |
| 2 μM CaCl2 | 0.69 | 0.81 | 0.69 | 0.81 |
| External pH | ||||
| pH 5.0 | 0.17 | 0.68 | 0.13 | 0.66 |
| pH 9.0 | 0.20 | 0.70 | 0.16 | 0.67 |
| Temp | ||||
| 40°C | 0.58 | 0.94 | 0.62 | 0.91 |
| 20°C | 0.51 | 0.88 | 0.51 | 0.87 |
| Additive | ||||
| 250 mM NaCl | 0.78 | 0.91 | 0.83 | 0.88 |
| 250 mM KCl | 0.19 | 0.57 | 0.19 | 0.62 |
All experiments were performed in M9 succinate (0.2%) minimal medium, except where glucose was the nutrient limitation, under the experimental conditions listed.
All values reported are the means of data from two to four experimental replicates, and the experimental error associated with these values was less than 15%. μmax, maximum specific growth rate.
The cell viability characteristics of strains NEMG1 (εDC), EMG2 (εWT), and NEMG3 (complemented εDC) were studied during nutrient starvation in nongrowing cultures (Fig. 2A). Bacterial cell viability was monitored by cell counts based on CFU per ml of culture, where serial dilutions of bacterial cell culture in phosphate-buffered saline were plated on LB agar plates supplemented with appropriate antibiotics. When the cell viability of all three strains was monitored following 24 h of growth in succinate-containing minimal medium (stationary-phase cultures), no significant differences were noted in cell viability even after 28 days (Fig. 2A). To add greater stress on the cells, competition experiments between all strains were performed, and cell viability was monitored (Fig. 2B). For these experiments, we used the following combinations of strains to allow enumeration of individual strains through kanamycin resistance/sensitivity: εWT strain versus εDC::Kmr strain and NEMG1 (εDC) strain versus NEMG3 (pNT03-complemented εDC) strain. In minimal medium, the population of the εDC, εDC::Kmr, and εWT strains were comparable after 28 days, suggesting that the εDC and εDC::Kmr mutants were not compromised in fitness relative to the εWT strain. When the same experiment was performed at low salt concentrations (i.e., 1 mM NaCl), the εDC and εDC::Kmr mutants showed a 1-log decrease in cell survival compared with the εWT and complemented εDC (pNT01) strains (Fig. 2C), suggesting an inability to compete with the εWT strain under these conditions.
Fig. 2.
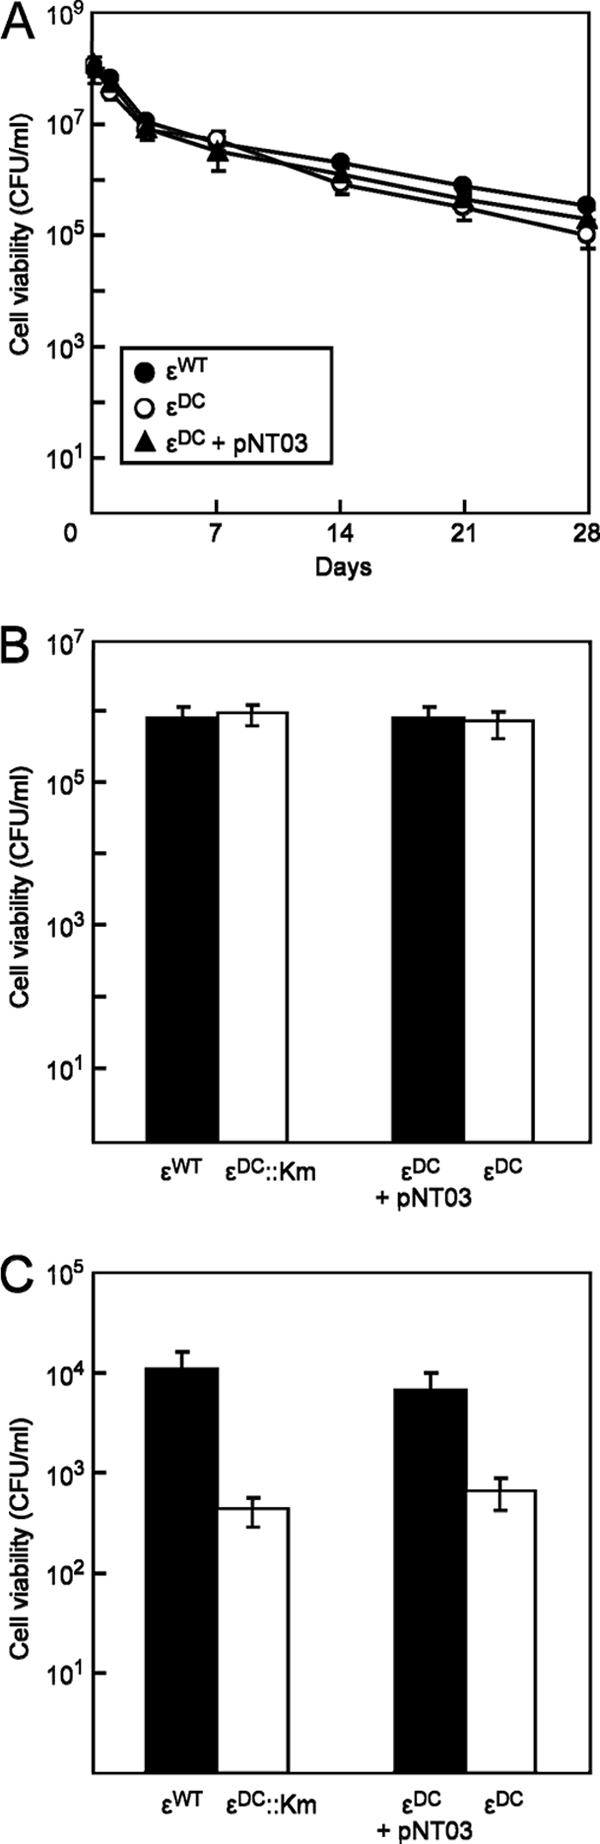
Cell viability of εWT and εDC strains in stationary-phase batch cultures. (A) Viability of EMG2 (εWT), NEMG1 (εDC), and NEMG3 (εDC + pNT03 AtpC+) cells as monocultures in M9 succinate (0.2%) minimal medium at 37°C after 24 h of growth (stationary phase). (B and C) Viability of cocultures EMG2 (εWT) versus NEMG2 (εDC::km) and NEMG1 (εDC) versus NEMG3 (εDC + pNT03 AtpC+) in M9-succinate medium (B) or in M9-succinate minimal medium containing 1 mM NaCl (C). Cultures were mixed in mid-log phase and grown for a further 24 h (stationary phase), and cell viability was determined after 28 days at 37°C. For all experiments, cellular viability was determined by measuring CFU by plating out appropriate dilutions on LB agar, supplemented with kanamycin where indicated, and enumerating them after 1 day of growth at 37°C. Results are shown as the means ± SEM for technical replicates of each time point.
Conclusions.
A large number of studies have reported that the ε subunit has a significant role in FoF1 assembly, coupling, and regulation of enzyme activity. The C-terminal domain of the ε subunit is proposed to act as a regulator and/or coupling factor of ATPase activity, but no studies have been performed to determine if these regulatory mechanisms operate in vivo and how important the ε subunit is in the physiology of E. coli. No significant differences were noted in growth rate, molar growth yield, membrane potential, or intracellular ATP concentration between the εWT and εDC strains under a wide range of growth conditions tested and when cells were subjected to various stressors (e.g., nutrient limitation, low and high pH, and temperature). One exception was the impaired survival and growth of the εDC strain in low-salt (i.e., Na+ or K+ ions) medium. The physiological explanation for this remains unclear, but intracellular concentrations of Na+ and K+ ions are precisely controlled by various antiporters (e.g., Na+/H+ and K+/H+) (3, 32) and the K+-translocating Kdp-ATPase (1), and maintenance of such gradients at low salt levels may perturb energy generation via the ATP synthase, particularly in an εDC mutant.
The general lack of ε-subunit-mediated regulation of ATP synthase/ATPase activity in vivo may reflect the extraordinary metabolic flexibility (e.g., aerobic and anaerobic respiration and fermentation) of E. coli. Subunit ε of E. coli has been shown to bind ATP, but the affinity is low (dissociation constant [Kd] = 22 mM) (50). This is in contrast to obligate aerobes like Bacillus species, where the Kd is in the range of 0.67 to 2.2 mM (17, 19). Experiments have not been performed to determine a physiological role for subunit ε in the growth of Bacillus species and other obligate aerobes, and this is the focus of ongoing studies.
Supplementary Material
ACKNOWLEDGMENTS
M.B. and G.M.C. were supported by a Marsden Grant from the Royal Society, New Zealand.
Footnotes
Supplemental material for this article may be found at http://jb.asm.org/.
Published ahead of print on 18 February 2011.
REFERENCES
- 1. Altendorf K., Epstein W. 1996. The Kdp-ATPase of Escherichia coli, p. 403–420 In Lee A. G. (ed.), Biomembranes. JAI press Inc., Greenwich, CT [Google Scholar]
- 2. Bachmann B. J. 1972. Pedigrees of some mutant strains of Escherichia coli K-12. Bacteriol. Rev. 36:525–557 [DOI] [PMC free article] [PubMed] [Google Scholar]
- 3. Booth I. R. 1985. Regulation of cytoplasmic pH in bacteria. Microbiol. Rev. 49:359–378 [DOI] [PMC free article] [PubMed] [Google Scholar]
- 4. Boyer P. D. 1997. The ATP synthase—a splendid molecular machine. Annu. Rev. Biochem. 66:717–749 [DOI] [PubMed] [Google Scholar]
- 5. Capaldi R. A., Aggeler R. 2002. Mechanism of the F1F0-type ATP synthase, a biological rotary motor. Trends Biochem. Sci. 27:154–160 [DOI] [PubMed] [Google Scholar]
- 6. Cipriano D. J., Dunn S. D. 2006. The role of the ε subunit in the Escherichia coli ATP synthase: the C-terminal domain is required for efficient energy coupling. J. Biol. Chem. 281:501–507 [DOI] [PubMed] [Google Scholar]
- 7. Cook G. M., Russell J. B. 1994. Energy-spilling reactions of Streptococcus bovis and resistance of its membrane to proton conductance. Appl. Environ. Microbiol. 60:1942–1948 [DOI] [PMC free article] [PubMed] [Google Scholar]
- 8. D'Alessandro M., Turina P., Melandri B. A. 2008. Intrinsic uncoupling in the ATP synthase of Escherichia coli. Biochim. Biophys. Acta 1777:1518–1527 [DOI] [PubMed] [Google Scholar]
- 9. Dunn S. D., Tozer R. G., Zadorozny V. D. 1990. Activation of Escherichia coli F1-ATPase by lauryldimethylamine oxide and ethylene glycol: relationship of ATPase activity to the interaction of the ε and β subunits. Biochemistry 29:4335–4340 [DOI] [PubMed] [Google Scholar]
- 10. Feniouk B. A., Yoshida M. 2008. Regulatory mechanisms of proton-translocating FOF1-ATP synthase. Results Probl. Cell Differ. 45:279–308 [DOI] [PubMed] [Google Scholar]
- 11. Feniouk B. A., Suzuki T., Yoshida M. 2006. The role of subunit epsilon in the catalysis and regulation of FOF1-ATP synthase. Biochim. Biophys. Acta 1757:326–338 [DOI] [PubMed] [Google Scholar]
- 12. Hara K. Y., Kato-Yamada Y., Kikuchi Y., Hisabori T., Yoshida M. 2001. The role of the βDELSEED motif of F1-ATPase: propagation of the inhibitory effect of the ε subunit. J. Biol. Chem. 276:23969–23973 [DOI] [PubMed] [Google Scholar]
- 13. Hyndman D. J., Milgrom Y. M., Bramhall E. A., Cross R. L. 1994. Nucleotide-binding sites on Escherichia coli F1-ATPase: specificity of noncatalytic sites and inhibition at catalytic sites by MgADP. J. Biol. Chem. 269:28871–28877 [PubMed] [Google Scholar]
- 14. Iino R., Hasegawa R., Tabata K. V., Noji H. 2009. Mechanism of inhibition by C-terminal α-helices of the ε subunit of Escherichia coli FOF1-ATP synthase. J. Biol. Chem. 284:17457–17464 [DOI] [PMC free article] [PubMed] [Google Scholar]
- 15. Jounouchi M., et al. 1992. Escherichia coli H+-ATPase: role of the δ subunit in binding F1 to the FO sector. Arch. Biochem. Biophys. 292:376–381 [DOI] [PubMed] [Google Scholar]
- 16. Kato Y., et al. 1997. Thermophilic F1-ATPase is activated without dissociation of an endogenous inhibitor, ε subunit. J. Biol. Chem. 272:24906–24912 [DOI] [PubMed] [Google Scholar]
- 17. Kato-Yamada Y. 2005. Isolated ε subunit of Bacillus subtilis F1-ATPase binds ATP. FEBS Lett. 579:6875–6878 [DOI] [PubMed] [Google Scholar]
- 18. Kato-Yamada Y., et al. 1999. ε subunit, an endogenous inhibitor of bacterial F1-ATPase, also inhibits F0F1-ATPase. J. Biol. Chem. 274:33991–33994 [DOI] [PubMed] [Google Scholar]
- 19. Kato-Yamada Y., Yoshida M. 2003. Isolated ε subunit of thermophilic F1-ATPase binds ATP. J. Biol. Chem. 278:36013–36016 [DOI] [PubMed] [Google Scholar]
- 20. Kinosita K., Jr., Adachi K., Itoh H. 2004. Rotation of F1-ATPase: how an ATP-driven molecular machine may work. Annu. Rev. Biophys. Biomol. Struct. 33:245–268 [DOI] [PubMed] [Google Scholar]
- 21. Klionsky D. J., Brusilow W. S., Simoni R. 1984. In vivo evidence for the role of the ε subunit as an inhibitor of the proton-translocating ATPase of Escherichia coli. J. Bacteriol. 160:1055–1060 [DOI] [PMC free article] [PubMed] [Google Scholar]
- 22. Kuki M., Noumi T., Maeda M., Amemura A., Futai M. 1988. Functional domains of ε subunit of Escherichia coli H+-ATPase (FOF1). J. Biol. Chem. 263:17437–17442 [PubMed] [Google Scholar]
- 23. Laget P. P., Smith J. B. 1979. Inhibitory properties of endogenous subunit ε in the Escherichia coli F1 ATPase. Arch. Biochem. Biophys. 197:83–89 [DOI] [PubMed] [Google Scholar]
- 24. Larsson C. M., Olsson T. 1979. Firefly assay of adenine nucleotides from algae: comparison of extraction methods. Plant Cell Physiol. 20:145–155 [Google Scholar]
- 25. Lotscher H., Capaldi R. A. 1984. Interconversion of high and low adenosinetriphosphatase activity forms of Escherichia coli F1 by the detergent lauryldimethylamine oxide. Biochemistry 23:4140–4143 [DOI] [PubMed] [Google Scholar]
- 26. Lundin A., Thore A. 1975. Comparison of methods for extraction of bacterial adenine nucleotides determined by firefly assay. Appl. Microbiol. 30:713–721 [DOI] [PMC free article] [PubMed] [Google Scholar]
- 27. Masaike T., Suzuki T., Tsunoda S. P., Konno H., Yoshida M. 2006. Probing conformations of the β subunit of F0F1-ATP synthase in catalysis. Biochem. Biophys. Res. Commun. 342:800–807 [DOI] [PubMed] [Google Scholar]
- 28. Mendel-Hartvig J., Capaldi R. A. 1991. Catalytic site nucleotide and inorganic phosphate dependence of the conformation of the ε subunit in Escherichia coli adenosinetriphosphatase. Biochemistry 30:1278–1284 [DOI] [PubMed] [Google Scholar]
- 29. Metcalf W. W., et al. 1996. Conditionally replicative and conjugative plasmids carrying lacZα for cloning, mutagenesis, and allele replacement in bacteria. Plasmid 35:1–13 [DOI] [PubMed] [Google Scholar]
- 30. Miller V. L., Mekalanos J. J. 1988. A novel suicide vector and its use in construction of insertion mutations: osmoregulation of outer membrane proteins and virulence determinants in Vibrio cholerae requires toxR. J. Bacteriol. 170:2575–2583 [DOI] [PMC free article] [PubMed] [Google Scholar]
- 31. Noji H., Yasuda R., Yoshida M., Kinosita K., Jr 1997. Direct observation of the rotation of F1-ATPase. Nature 386:299–302 [DOI] [PubMed] [Google Scholar]
- 32. Padan E., Schuldiner S. 1994. Molecular physiology of the Na+/H+ antiporter in Escherichia coli. J. Exp. Biol. 196:443–456 [DOI] [PubMed] [Google Scholar]
- 33. Penfold R. J., Pemberton J. M. 1992. An improved suicide vector for construction of chromosomal insertion mutations in bacteria. Gene 118:145–146 [DOI] [PubMed] [Google Scholar]
- 34. Rodgers A. J., Wilce M. C. 2000. Structure of the γ-ε complex of ATP synthase. Nat. Struct. Biol. 7:1051–1054 [DOI] [PubMed] [Google Scholar]
- 35. Russell J. B., Cook G. M. 1995. Energetics of bacterial growth: balance of anabolic and catabolic reactions. Microbiol. Rev. 59:48–62 [DOI] [PMC free article] [PubMed] [Google Scholar]
- 36. Sambrook J., Fritsch E. F., Maniatis T. 1989. Molecular cloning, a laboratory manual, 2nd ed., vol. 3 Cold Spring Harbor Laboratory Press, Cold Spring Harbor, NY [Google Scholar]
- 37. Senior A. E., Nadanaciva S., Weber J. 2002. The molecular mechanism of ATP synthesis by F1F0-ATP synthase. Biochim. Biophys. Acta 1553:188–211 [DOI] [PubMed] [Google Scholar]
- 38. Shepherd M., Sanguinetti G., Cook G. M., Poole R. K. 2010. Compensations for diminished terminal oxidase activity in Escherichia coli: cytochrome bd-II-mediated respiration and glutamate metabolism. J. Biol. Chem. 285:18464–18472 [DOI] [PMC free article] [PubMed] [Google Scholar]
- 39. Skakoon E. N., Dunn S. D. 1993. Location of conserved residue histidine-38 of the ε subunit of Escherichia coli ATP synthase. Arch. Biochem. Biophys. 302:272–278 [DOI] [PubMed] [Google Scholar]
- 40. Suzuki T., Ueno H., Mitome N., Suzuki J., Yoshida M. 2002. F0 of ATP synthase is a rotary proton channel: obligatory coupling of proton translocation with rotation of c-subunit ring. J. Biol. Chem. 277:13281–13285 [DOI] [PubMed] [Google Scholar]
- 41. Suzuki T., Suzuki J., Mitome N., Ueno H., Yoshida M. 2000. Second stalk of ATP synthase: cross-linking of γ subunit in F1 to truncated FOb subunit prevents ATP hydrolysis. J. Biol. Chem. 275:37902–37906 [DOI] [PubMed] [Google Scholar]
- 42. Suzuki T., et al. 2003. F0F1-ATPase/synthase is geared to the synthesis mode by conformational rearrangement of ε subunit in response to proton motive force and ADP/ATP balance. J. Biol. Chem. 278:46840–46846 [DOI] [PubMed] [Google Scholar]
- 43. Suzuki T., Ozaki Y., Sone N., Feniouk B. A., Yoshida M. 2007. The product of uncI gene in F1FO-ATP synthase operon plays a chaperone-like role to assist c-ring assembly. Proc. Natl. Acad. Sci. U. S. A. 104:20776–20781 [DOI] [PMC free article] [PubMed] [Google Scholar]
- 44. Takeshita S., Sato M., Toba M., Masahashi W., Hashimoto-Gotoh T. 1987. High-copy-number and low-copy-number plasmid vectors for lacZα-complementation and chloramphenicol- or kanamycin-resistance selection. Gene 61:63–74 [DOI] [PubMed] [Google Scholar]
- 45. Taylor L. A., Rose R. E. 1988. A correction in the nucleotide sequence of the Tn903 kanamycin resistance determinant in pUC4K. Nucleic Acids Res. 16:358. [DOI] [PMC free article] [PubMed] [Google Scholar]
- 46. Uhlin U., Cox G. B., Guss J. M. 1997. Crystal structure of the ε subunit of the proton-translocating ATP synthase from Escherichia coli. Structure 5:1219–1230 [DOI] [PubMed] [Google Scholar]
- 47. Wilkens S., Dahlquist F. W., McIntosh L. P., Donaldson L. W., Capaldi R. A. 1995. Structural features of the ε subunit of the Escherichia coli ATP synthase determined by NMR spectroscopy. Nat. Struct. Biol. 2:961–967 [DOI] [PubMed] [Google Scholar]
- 48. Wilkens S., Capaldi R. A. 1998. Solution structure of the ε subunit of the F1-ATPase from Escherichia coli and interactions of this subunit with β subunits in the complex. J. Biol. Chem. 273:26645–26651 [DOI] [PubMed] [Google Scholar]
- 49. Xiong H., Zhang D., Vik S. B. 1998. Subunit ε of the Escherichia coli ATP synthase: novel insights into structure and function by analysis of thirteen mutant forms. Biochemistry 37:16423–16429 [DOI] [PubMed] [Google Scholar]
- 50. Yagi H., et al. 2007. Structures of the thermophilic F1-ATPase ε subunit suggesting ATP-regulated arm motion of its C-terminal domain in F1. Proc. Natl. Acad. Sci. U. S. A. 104:11233–11238 [DOI] [PMC free article] [PubMed] [Google Scholar]
- 51. Yoshida M. 1977. Reconstitution of thermostable ATPase capable of energy coupling from its purified subunits. Proc. Natl. Acad. Sci. U. S. A. 74:936–940 [DOI] [PMC free article] [PubMed] [Google Scholar]
- 52. Yoshida M., Muneyuki E., Hisabori T. 2001. ATP synthase—a marvelous rotary engine of the cell. Nat. Rev. Mol. Cell Biol. 2:669–677 [DOI] [PubMed] [Google Scholar]
- 53. Yoshida M., Allison W. S. 1983. Modulation by ADP and Mg2+ of the inactivation of the F1-ATPase from the thermophilic bacterium, PS3, with dicyclohexylcarbodiimide. J. Biol. Chem. 258:14407–14412 [PubMed] [Google Scholar]
- 54. Zilberstein D., Schuldiner S., Padan E. 1979. Proton electrochemical gradient in Escherichia coli cells and its relation to active transport of lactose. Biochemistry 18:669–673 [DOI] [PubMed] [Google Scholar]
Associated Data
This section collects any data citations, data availability statements, or supplementary materials included in this article.