

Abstract
Bacterial cells evolved under prolonged stress often have a growth advantage in stationary phase (GASP); we expect GASP cells to maintain a proliferative state and dominate wild-type cells during starvation, especially when nutrients are limited and the medium has been conditioned. However, when we compete GASP mutants against wild-type cells in a chain of microfluidic microhabitat patches (MHPs) with alternating nutrient-rich and nutrient-limited regions, we observe the reverse effect: wild-type cells achieve maximum relative density under nutrient-limited conditions, while GASP cells dominate nutrient-rich regions. We explain this surprising observation in terms of ideal free distributions, where we show that wild-type cells maximize their fitness at high cell density by redistributing themselves to sparsely populated MHPs. At the microscopic level, we describe how biofilm formation also contributes to the population redistribution. We conclude by discussing the implications of these results for social interactions of more complex organisms.
INTRODUCTION
A population of wild-type Escherichia coli will cease to proliferate in response to deteriorating growth conditions. The response to such conditions is regulated by the rpoS gene (20), which triggers the expression of several cell protection mechanisms as a response to decreasing nutrient levels, increased density, or changes in pH (12). In response to limited nutrients, cells shift from growth to maintenance of basic cellular functions, a state called stationary phase (15).
Under prolonged starvation, however, cells may evolve the ability to grow despite stressful environmental conditions (8). First observed by Zambrano et al. (24), these resistant populations are called GASP mutants, because they have a growth advantage in stationary phase. E. coli carrying mutations affecting the rpoS gene, one of which is the rpoS819 allele, will not stop growing in response to the stresses found in stationary-phase cultures. Experiments in well-mixed, homogenized environments, such as test tubes, have shown that GASP cells containing the rpoS819 allele have, under prolonged starvation conditions, a fitness advantage over wild-type (WT) strains (23).
Natural environments, however, are rarely homogeneous and well mixed. Feast or famine, where long periods of starvation are mediated by short bursts of population growth, is a more accurate description of the conditions encountered by bacteria in the wild. Furthermore, natural environments are spatially heterogeneous, and different species are usually competing for space and nutrient resources. In this paper, we use a microfluidic device to recreate the feast-or-famine and heterogeneous aspects of natural environments to study the competition between wild-type and GASP mutant strains of bacteria.
The microfluidic device used, shown in Fig. 1 A, is fundamentally different from other cell culture systems, such as chemostats and test tubes. Each device consists of 85 microhabitat patches (MHPs) along a line, each of which is 100 by 100 by 8 μm in size, linked by 5-μm-wide and 50-μm-long inter-MHP channels. Cells retain their ability to swim and can migrate between MHPs. Each MHP can harbor approximately 15,000 cells, assuming a cell size of 0.6 μm3 (19) and a very loose packing fraction of slightly more than 10%. Comparing this to E. coli cells at an optical density at 600 nm (OD600) of 1, where 1 ml contains approximately 109 cells, we would get only 80 cells per MHP. In fact, cells inside our MHP system reach densities close to those of the intestinal microbiota (1011 cells/ml [9]).
Fig. 1.

(A) Two strains of Escherichia coli compete inside a microhabitat patch (MHP) system. The MHPs are 100 by 100 by 8 μm in size, and every other chamber has access to nutrient. A linear series of 85 such chambers is microfabricated in silicon. The nanoslits (yellow) allow nutrient to diffuse slowly from the nutrient reservoirs (purple) into only one of the chambers (blue). Cells retain their ability to swim and can move between MHPs using the inter-MHP channels (red). We performed the experiments in a device consisting of 42 such two-state systems placed on a linear array. (B) A computer-controlled microscope scanned the array of 85 MHPs and recorded a fluorescence micrograph of each MHP every 15 min.
Nutrients can diffuse into the MHPs from reservoirs of Luria-Bertani (LB) broth on each side of the MHP array through 250-nm-deep nanoslits, shown in yellow in Fig. 1A. Nutrient and waste, but not the cells, can diffuse in and out of each MHP through the nanoslits; unlike chemostats, no cells are removed from the system. We impose a high level of spatial heterogeneity on the bacterial populations by restricting the amount of nutrient reaching each MHP. The percentages of nanoslits vary from 100% open in one MHP to 0% open in the next. We refer to the former as nutrient rich (NR) and the latter as nutrient poor (NP). Since each NP MHP is surrounded by two NR MHPs, waste and conditioned medium can diffuse from the NR into the NP MHPs through the inter-MHP channels. We thus expect the nutrient composition of the NP regions to be closer to that of conditioned medium than rich medium.
Our previous experiments showed that mixing populations of wild-type and GASP cells allows a larger population of both types of bacteria to flourish relative to the case when only one type is present (14). In experiments described here, we observe that wild-type cells initially perform better in NR MHPs but at later times redistribute themselves into the NP MHPs. Conversely, GASP cells perform better than wild-type cells in nutrient-rich MHPs. We explain this anomalous population redistribution using ideal free distributions. We also describe the collective cell behavior inside each MHP and show that multicellular interactions influence the dynamics of the population distribution.
MATERIALS AND METHODS
Strain construction.
The strains used are based on wild-type E. coli strain W3110 (K-12 derived) carrying a gene expressing either green fluorescent protein μ2 (GFPμ2) or monomeric red fluorescent protein 1 (mRFP1) fused to lacZ and under the control of the Lac repressor. Expression of the fluorescent proteins is induced by the addition of IPTG (isopropyl-β-d-thiogalactopyranoside) to the medium at a concentration of 1 μM. We create the GASP strains by inserting the rpoS819 allele, which comes from the ZK819 donor strain (24), through P1 transduction into each of the GFPμ2- or mRFP1-producing wild-type strains. In order to confirm the presence of the rpoS819 allele in our constructs, we sequenced the PCR products obtained with forward primer 5′-TCACCCGTGAACGTGTTC-3′ and reverse primer 5′-GTTAACGACCATTCTCG-3′ using GENEWIZ as a sequencing service. The only difference between alleles is a 46-bp insertion in the rpoS gene of the sequence (AAATTCCTGCAAACGCAGGGGCTGAATATCGAAGCGCTGTTCCGCG). We also confirm that the strain carrying the rpoS819 allele displays a GASP phenotype by performing competition experiments using conventional cell culture techniques and observing competition dynamics identical to those initially reported in reference 24 (data not shown). Cells still retain their ability to express genes needed for the synthesis of flagellar components. Furthermore, none of the genes related to biofilm expression, quorum sensing, or chemotaxis have been altered or removed.
Device fabrication.
To fabricate the silicon microfluidic device, we used standard photolithography and Bosch etching techniques. Three different photolithographic masks were used to pattern (i) the nanoslits, (ii) the MHP array, and (iii) the nutrient reservoirs. We first etched the nanoslits (250 nm) using a PlasmaLab 80+ RIE system (Oxford). Then, the MHPs (8 μm) and the nutrient reservoirs (50 μm) were etched in successive steps using a Unaxis 770 Deep Si etcher (Plasmatherm). A protective layer of photoresist was spun after the last etching step. We sandblasted ports through the silicon and sealed the top of the device with a poly(dimethylsiloxane) (PDMS)-coated coverslip. The wetting and the sterilization steps were performed at the same time by autoclaving the device in LB broth.
Cell culture.
The strains were grown separately to an optical density at 600 nm of 0.5 inside a test tube containing rich medium (LB broth). Ten microliters of a 50:50 mixture of GFP- and RFP-producing cells was introduced inside the device through one of the sandblasted ports (close to MHP number 1). After inoculation, the back of the device was sealed with uncured PDMS and a glass slide. Cells were free to swim between MHPs and were able to reach the other side of the device within a few hours. Each experiment was performed twice, where the fluorophore of each strain was exchanged to make sure that the observed dynamics were not an artifact of the FP construct.
Time lapse microscopy.
We measured the fluorescence density of each population. A computer-controlled microscope (Eclipse 90i; Nikon) scanned and recorded digital micrographs of each MHP every 15 min using a digital charge-coupled device (CCD) camera (Retiga 1300; Qimaging Inc.). The microscope recorded the green (excitation, 470/40 nm; emission, 525/50 nm) and the red (excitation, 560/55 nm; emission, 645/75 nm) fluorescence channels, corresponding to the GFP- and RFP-producing bacterial populations.
Image analysis.
The fluorescence intensity of each image was used to measure the density of cells present in each MHP. The pixel intensities of each of the GFP and RFP channels were recorded. We assumed a linear relationship between the number of cells present and the measured fluorescence intensity. Although we have not measured precisely the number of cells in each MHP, we estimated it by assuming that the total density in a single MHP in a competition experiment is approximately 15,000 cells/MHP. To account for the difference in intensity of the two fluorophores, a calibration was performed by mixing GFP- and RFP-producing cells in the GASP and wild-type-only experiments and comparing their respective intensities. We measured the fluorescence intensity of RFP to be 1.8 times greater than that of GFP, and all data have been rescaled accordingly.
RESULTS
We first performed experiments in which we inoculated the device with a 1:1 ratio of GFP-expressing wild-type and RFP-expressing GASP cells. Farrell and Finkel (7) show that GASP mutants are adapted to growth in medium which has been depleted of most nutrients (conditioned medium), so we expected them to outcompete wild-type cells in NP MHPs. Conversely, we expected wild-type cells to avoid the NP MHPs and perform better in NR MHPs because their fitness, when competing against GASP mutants, is higher in fresh medium than under conditioned medium conditions (7).
However, we observed the reverse distribution: 40 h after inoculation, the final density of wild-type cells was considerably higher in the nutrient-poor regions, while GASP cells dominated only in the nutrient-rich habitats. An example of this inverted distribution for MHP 80 to 81 is shown in Fig. 2 A, where the relative frequency of the WT rpoS allele is only 20% in the nutrient-rich MHP and 75% in the nutrient-poor MHP. The same is also true throughout the device: Fig. 2B shows that the relative frequency of the WT rpoS allele is highly correlated with access to nutrients. The absolute fraction varies with position across the device, but the local population distribution of wild-type cells is always higher in the NP regions than in the NR MHPs. Although large-scale variations are present across the device, the standard error in the allele frequency is less than 5%, as measured from the variation with respect to a 10-MHP spatial average.
Fig. 2.

(A) Population distribution at T = 40 h of the wild-type (green; carrying a WT rpoS allele) and GASP (red; carrying an rpoS819 allele) coculture experiment. Wild-type cells are dominant in the nutrient-poor (NP) region, while GASP cells dominate the nutrient-rich (NR) MHP. (B) Frequency of the WT rpoS allele in nutrient-rich (○) and nutrient-poor (•) MHPs. The population distribution correlates strongly with the nutrient distribution. Although proximity to the inoculation ports (MHP positions less than 15 and greater than 70) affects the absolute population fraction, the local distribution of wild-type cells is always at a relatively higher frequency in NP regions than in the NR habitats.
Perhaps more surprising are the dynamics which led to this final distribution of wild-type and GASP cells. Figure 3 A shows the fluorescence intensity of each fluorophore for MHP 68 to 85 as a function of time. After an incubation period from 0 to 10 h (where cell densities are too small to emit a detectable amount of fluorescence), we observed that wild-type cells were initially the dominant species in the NP regions. The time evolution of the wild-type fraction in the NR and NP MHPs is shown in Fig. 3B and C, respectively. The average number of cells in each NR and NP MHP, as averaged over the 85 MHPs, is also shown in the insets of Fig. 3B and C.
Fig. 3.

(A) Montage of the epifluorescent micrographs for the competition experiment. Wild-type cells are initially populating the NR regions, but starting at 20 h, cells collectively redistribute themselves and GASP cells become the dominant strain in the NR MHPs. (B) Time evolution of the population composition in NR MHPs. The white region denotes time for which the fluorescence intensity is below the detection threshold of the CCD. The inset shows the growth curves of both strains. (C) The fraction of WT rpoS cells inside an NP MHP does not significantly change over time. The distribution remains dominated mainly by the wild-type cells. As shown in the inset, wild-type cells maintain a cell density higher than GASP cells for the whole experiment.
We observed that wild-type cells are initially dominating in the NR regions and reach a maximum frequency of slightly above 75% at 10 h. As shown in the inset of Fig. 3B, the maximum frequency reached by the wild-type cells occurred a few hours before the cells reach their highest density in the NR MHPs. At later times, however, the relative fraction of cells in the NR regions decreased progressively to reach less than 30%, 40 h after inoculation.
On the other hand, the wild-type fraction in the NP MHPs was stable at ∼60% following entrance into stationary phase, which corresponds to times after which cell densities remained constant. The inset of Fig. 3C shows that wild-type cells outcompeted GASP cells early in the experiment and maintained their dominance over time.
Wild-type cells, which are initially adapted to rich medium, ended up dominating in regions where the medium had been conditioned. Conversely, GASP cells, although more adapted to conditioned medium, reached higher densities in the nutrient-rich habitats. The spatial redistribution occurred 20 h after inoculation, and by that time cells had entered stationary phase and very little growth was occurring in the NR and NP MHPs.
DISCUSSION
Ideal free distributions.
The constant cell density observed in stationary-phase cultures of bacteria does not necessarily imply that proliferation and cell death are in perfect balance. In fact, we observe that stationary-phase cells are still active, and researchers have shown that cells maintain a moderate (up to 20% [22]) level of protein synthesis. Cells in stationary phase are still motile and are able to migrate in search of a better environment. The concept of ideal free distributions (IFDs) was initially introduced in an ecological context to describe how a collection of organisms will populate habitats with spatially heterogeneous resource levels. We use it here to describe how cells populate their microenvironment under starvation conditions.
Several empirical (1, 3) and theoretical (13, 17) studies have used the IFD model to describe how a collection of organisms populates a multihabitat ecosystem. The IFD model states that each individual of a species will populate the habitat that maximizes its fitness. Using the per capita growth rate as a definition of fitness (4), the fitness (V) of an individual in a given habitat is given by V = r(1 − ρ/K), for a growth rate r, a total cell density ρ, and a carrying capacity K. Hence, the likelihood that a cell will populate a given habitat will decrease with the number of cells already present.
We first apply the IFD to a single species inside a two-habitat system. Krivan and Sirot (18) derive from the IFD model that the long-term population distribution in a two-habitat system will stabilize to K1/(K1 + K2), where the carrying capacities K1 and K2 represent the maximum number of individuals each habitat can harbor. Note that the final distribution does not depend on the growth rate in each habitat, which is given by the amount and quality of nutrients present. In our case, if we consider the situation where both chambers fill to capacity (i.e., the carrying capacity is dictated by the volume of the habitat, which is the same for each NR and NP MHP), we obtain a final distribution of 50% in the NR and 50% in the NP MHPs. Although the fact that cells populate habitats which support little growth may seem counterintuitive, remember that cells are free to move between habitats. Cells may still populate the NP MHPs, provided that the fitness in NR MHPs is below that of NP MHPs.
Experimentally, we study the effect of the IFD by repeating the experiment described in the previous section with all cells carrying a single rpoS allele. We measure their distributions after they reach stationary phase and obtain an evenly distributed wild-type population. Wild-type cells, on average, reach a final density (Kw) of 9,400 and 9,800 cells per MHP in the NR and NP regions, respectively. We also measure an evenly distributed population of GASP cells, where they reach an averaged final density (Kg) in the NR and NP regions of 11,000 and 11,500 cells per MHP, respectively. The slightly higher densities of both strains in the NP region, about 5% in each case, may be due to nonlinearities between the intensity and the cell number at high densities. Indeed, as we will later show, cells form dense aggregates in NR regions which may shield some of the fluorescence reaching the CCD.
The IFD of a two-species, two-habitat system has also been thoroughly studied by Krivan and Sirot (18). The fitness of wild-type cells in the NR MHPs will depend on the density of wild-type (ρw) and GASP (ρg) cells as
| (1) |
for a given growth rate rw,NR, a competition parameter αw, and carrying capacity Kw. The fitness WNR of rpoS819 cells is obtained by replacing w with g in the above equation. Kw and Kg are measured as the final density reached in the control experiments. The growth rates are highly dependent on the nutrient content in each habitat; we previously measured a very low growth rate in regions having no access to nutrient in an MHP system (14), meaning that rNP ≪ rNR. It follows that VNP ≪ VNR, and we can assume that fitness VNP is ∼0 and WNP is ∼0. The parameter αw can be thought of as the strength of the interaction between the two strains: it describes by how much the presence of the other strain will affect the final density of a population.
We estimate α by measuring the correction to the final density in NR MHPs in competition experiments (ρw and ρg, both measured at 40 h) versus the control ones (Kg and Kw). For wild-type cells, we obtain, from (ρw + αw·ρg) = Kw, that αw is 0.4. For GASP cells, the final density under competition is roughly the same as in the GASP-only experiment (both are ∼11,000 cells per MHP), so the competition parameter αg is zero; GASP cells are not significantly affected by the presence of wild-type cells.
In Fig. 4 A and B, we plot VNR/rw and WNR/rg by substituting the measured densities ρw and ρg in equation 1. Wild-type cells in the NR region maintain a proliferative state until (ρw + 0.4·ρg) = Kw. This occurs at T = 13 h, when the fitness VNR has just decreased to zero. After 13 h, as the density of GASP cells continues to increase, VNR becomes negative. Cells are then faced with a negative fitness in the NR MHPs and a slightly positive one in the NP MHPs. Wild-type cells thus maximize their fitness by preferentially occupying the NP regions.
Fig. 4.

Fitness of the WT rpoS cells (A) and of the rpoS819 cells (B) in the nutrient-rich regions, as calculated by inserting the measured cell densities in equation 1. After the measured fitness becomes negative at 13 h (arrow; where VNR ≈ VNP), individuals following the IFD will cease to favor the nutrient-rich regions. Conversely, the fitness of the rpoS819 cells in the nutrient-rich region never decreases below zero, so GASP cells will preferentially favor the nutrient-rich regions.
GASP cells, on the other hand, never reach a point where WNR is less than WNP, as shown in Fig. 4B. Although they grow at a lower rate than wild-type cells, their fitness is always positive. As a consequence, GASP cells have no incentive to leave the NR MHPs as the density there increases.
The IFD provides a possible explanation, at the population level, for the observed inversion in the spatial distribution of competing wild-type and GASP cells. Although the IFD model is generic enough to be applicable to many ecological systems, the microscopic details of how the inversion is carried out by individuals will strongly depend on the biological system used. For instance, the IFD assumes that individuals are free to move between habitats: cell movement inside MHPs, however, can be limited at high cell densities. Below, we propose a complementary description of population inversion dynamics at a more microscopic level.
Biofilm formation.
The large-scale, population-wide description we have just presented using the IFD uses the fitness of each population to explain the competition dynamics between GASP and wild-type cells. It is challenging, however, to apply the concept of fitness at the single-cell level because of the inherent variability and the stochastic nature of intercellular interactions. We describe the complex, time-dependent dynamics underlying the population distribution shown in Fig. 2 by characterizing cell-cell interactions at the microscopic level. The description remains qualitative and is used to illustrate the complex interactions present in our MHP system.
A few hours after inoculation, we observe cell aggregates which, despite constant jostling by the surrounding swimming cells, maintain their shape and structure (see Video SV1 in the supplemental material). The fact that cells are sessile within each aggregate but still able to resist external pressures suggests that cohesive forces keep cells bound together. Previous studies have shown that under prolonged growth in the absence of agitation GASP and wild-type strains of E. coli are able to form biofilms (16). Since E. coli has the ability to form biofilms in response not only to stress (5, 10) but also to an increase in cell density through quorum sensing (2), we assume that these aggregates are precursors to biofilms.
The steps involved in the biofilm's developmental progression in our device are shown in Fig. 5 and in Video SV2 in the supplemental material. First, small aggregates of wild-type cells form inside the nutrient-rich regions and assemble together (T = 16 h). GASP cells then join the wild-type aggregate and expand around it (T = 18 h). GASP cells near the edge of the biofilm proliferate to fill most of the nutrient-rich habitat (T = 20 h), which in turns gradually limits the space available for free-swimming bacteria in the NR MHPs. As a result, GASP cells in the biofilm progressively become the dominant strain in the NR regions.
Fig. 5.
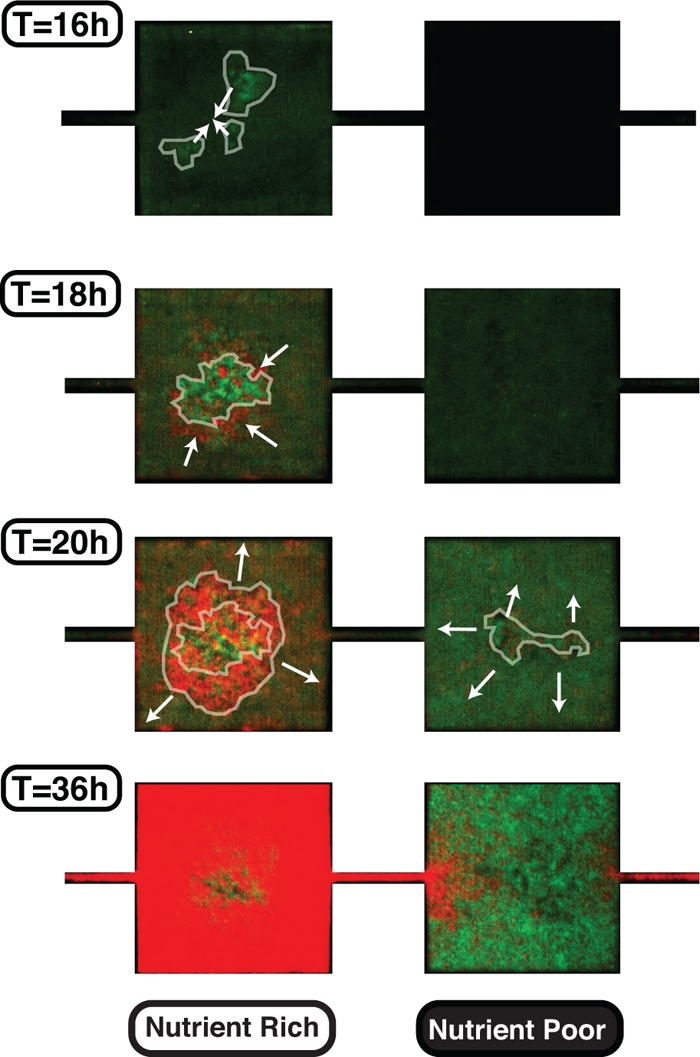
Biofilm development extracted from Video SV2 in the supplemental material. A small fraction of wild-type cells, shown here in green, initially aggregate together at T = 16 h. Then, the small biofilm particulates assemble together at T = 18 h, and the GASP cells (red) assemble around it. Biofilm growth from that moment on is carried out mainly by the GASP cells. As the space available in the NR MHP decreases, the wild-type cells migrate into the nutrient-poor MHP. Finally, the population stabilizes when the motion of cells in each MHP is quenched by the biofilms: GASP and wild-type cells are dominant in the nutrient-rich and nutrient-poor regions, respectively.
Wild-type cells, on the other hand, are still in a planktonic state in the NR regions. As the biofilm expands, wild-type cells are left with little free space available in the NR regions. They may be swimming away diffusively into the NP regions as the space available decreases. The increasing cell density in the NP regions also favors the formation of small cell aggregates (T = 20 h), which eventually fill all the space available in the MHP as swimming cells continue to migrate into the NP MHPs. After 36 h, there is no “free” space available and most MHPs are packed with biofilms. The population distribution is thereby locked and no more inter-MHP cell exchange is possible, leaving a large frequency of GASP cells in the NR MHPs and of wild-type cells in the NP MHPs.
In summary, we have studied the population distribution of wild-type and GASP cells inside a linear array of weakly coupled habitats with alternating nutrient-rich and nutrient-poor regions. We have shown that, surprisingly, cells not adapted to starvation conditions dominate in nutrient-limited habitats. Also, bacterial species adapted to starvation conditions dominate nutrient-rich environments. The time-evolution dynamics show that wild-type cells initially populate the nutrient-rich regions but upon entry into stationary phase are readily replaced by GASP cells.
We describe this phenomenon using ecological and physiological descriptions, in terms of ideal free distributions and biofilm formation, respectively. In both explanations, wild-type cells dominate nutrient-limited regions as a result of cellular influx. In the IFD description, the implicit interactions among individuals influence which regions each cell will populate. Since the total densities reached inside NR habitats vastly exceed the wild-type carrying capacity, wild-type cells maximize their fitness by moving into sparsely populated NP regions.
The development of biofilm also explains the population distribution inside the MHP system, but from a more microscopic perspective than we discussed using the IFD. E. coli's stress response induces the formation of biofilms inside crowded MHPs. The biofilm's growth is carried out mainly by GASP cells in the NR MHPs, which in turn reduces the space available for free-swimming wild-type bacteria in the NR MHPs. The decreasing physical space then causes the free-swimming cells to migrate into less crowded NP MHPs.
The survival of wild-type cells in the MHPs which have little access to fresh nutrients is surprising and unexpected compared with previous competition experiments reported in the literature (7, 23, 24), where they show that under prolonged starvation conditions the final frequency of wild-type cells is several orders of magnitude lower than that of the GASP cells. We also observe that GASP cells are dominating over wild-type cells, but their dominance is not as overwhelming. The spatially heterogeneous nature of our experimental system seems to increase the survival of wild-type cells when competing against GASP cells. Spatial structure induces fundamentally different competitive dynamics of bacterial populations. In a spatially connected habitat array, a combination of growth rate and migration (rather than growth rate alone in homogenized cultures) determines whether GASP or wild-type cells dominate a particular environment. The spatial redistribution of wild-type cells indicates that such complexity, often found in natural environments, induces behaviors which are much more sophisticated than what is usually observed in homogenized cultures.
These results may be applicable not only to other microbial systems but also to more complex organisms. Conventional wisdom dictates that resource conservation and cooperation among individuals protect a society against a “tragedy of the commons” (11); self-restriction for the benefit of the whole population is desirable, and even necessary, when resources are limited (21). However, an individual's incentive to defect is strong, especially when the onset of resource depletion may not be imminent. Human societies have often succumbed to the temptation of selfishly using resources and failing to adapt as resource levels diminished (6). If we view wild-type cells' entrance into stationary phase as a cooperative behavior and GASP cells' sustained growth as a selfish behavior, our results with competing bacterial communities provide a demonstration that resource conservation and habitat preservation are most helpful to cooperators in environments where the resources are scarce. The survival and prosperity of selfish individuals, on the other hand, are not seriously hindered in resource-rich habitats. We believe that these findings may lead to a better understanding of cooperation and public-good allocation in resource-limited environments in more complex organisms.
Supplementary Material
ACKNOWLEDGMENTS
We thank John Qiucen Zhang, Kristelle Bougot-Robin, Peter Galajda, Juan Keymer, and David Tsao for their invaluable help. We also thank Ted Cox, Cees Dekker, and Joel Brown for their helpful discussion.
This work was performed in part at the Cornell NanoScale Facility, a member of the National Nanotechnology Infrastructure Network, which is supported by the National Science Foundation (grant ECS-0335765). This material is based upon work supported by the National Science Foundation under grant no. 0750323. This work was also supported by the Department of Defense NDSEG fellowship program and the Natural Sciences and Engineering Research Council of Canada. The research described was supported by award number U54CA143803 from the National Cancer Institute.
The content is solely the responsibility of the authors and does not necessarily represent the official views of the National Cancer Institute or the National Institutes of Health.
Footnotes
Supplemental material for this article may be found at http://jb.asm.org/.
Published ahead of print on 11 February 2011.
REFERENCES
- 1. Abramsky Z., et al. 1990. Habitat selection: an experimental field test with two gerbil species. Ecology 71:2358 [Google Scholar]
- 2. Barrios A. F. G., et al. 2006. Autoinducer 2 controls biofilm formation in Escherichia coli through a novel motility quorum-sensing regulator (MqsR, b3022). J. Bacteriol. 188:305–316 [DOI] [PMC free article] [PubMed] [Google Scholar]
- 3. Craig J. 2008. A short review of pike ecology. Hydrobiologia 601:5–16 [Google Scholar]
- 4. Cressman R., Krivan V., Garay J. 2004. Ideal free distributions, evolutionary games, and population dynamics in multiple species environments. Am. Nat. 164:473–489 [DOI] [PubMed] [Google Scholar]
- 5. Davey M. E., O'Toole G. A. 2000. Microbial biofilms: from ecology to molecular genetics. Microbiol. Mol. Biol. Rev. 64:847–867 [DOI] [PMC free article] [PubMed] [Google Scholar]
- 6. Diamond J. 2006. Collapse: how societies choose to fail or succeed. Penguin, New York, NY [Google Scholar]
- 7. Farrell M. J., Finkel S. E. 2003. The growth advantage in stationary-phase phenotype conferred by rpoS mutations is dependent on the pH and nutrient environment. J. Bacteriol. 185:7044–7052 [DOI] [PMC free article] [PubMed] [Google Scholar]
- 8. Finkel S. E. 2006. Long-term survival during stationary phase: evolution and the GASP phenotype. Nat. Rev. Microbiol. 4:113–120 [DOI] [PubMed] [Google Scholar]
- 9. Guarner F., Malagelada J. 2003. Gut flora in health and disease. Lancet 361:512–519 [DOI] [PubMed] [Google Scholar]
- 10. Hall-Stoodley L., Costerton J. W., Stoodley P. 2004. Bacterial biofilms: from the natural environment to infectious diseases. Nat. Rev. Microbiol. 2:95–108 [DOI] [PubMed] [Google Scholar]
- 11. Hardin G. 1968. The tragedy of the commons. Science 162:1243–1248 [PubMed] [Google Scholar]
- 12. Hengge-Aronis R. 2002. Signal transduction and regulatory mechanisms involved in control of the sigmaS (RpoS) subunit of RNA polymerase. Microbiol. Mol. Biol. Rev. 66:373–395 [DOI] [PMC free article] [PubMed] [Google Scholar]
- 13. Holt R. D. 1985. Population dynamics in two-patch environments: some anomalous consequences of an optimal habitat distribution. Theor. Popul. Biol. 28:181–208 [Google Scholar]
- 14. Keymer J. E., Galajda P., Lambert G., Liao D., Austin R. H. 2008. Computation of mutual fitness by competing bacteria. Proc. Natl. Acad. Sci. U. S. A. 105:20269–20273 [DOI] [PMC free article] [PubMed] [Google Scholar]
- 15. Kolter R., Siegele D. A., Tormo A. 1993. The stationary phase of the bacterial life cycle. Annu. Rev. Microbiol. 47:855–874 [DOI] [PubMed] [Google Scholar]
- 16. Kraigsley A. M., Finkel S. E. 2009. Adaptive evolution in single species bacterial biofilms. FEMS Microbiol. Lett. 293:135–140 [DOI] [PubMed] [Google Scholar]
- 17. Krivan V., Cressman R., Schneider C. 2008. The ideal free distribution: a review and synthesis of the game-theoretic perspective. Theor. Popul. Biol. 73:403–425 [DOI] [PubMed] [Google Scholar]
- 18. Krivan V., Sirot E. 2002. Habitat selection by two competing species in a two habitat environment. Am. Nat. 160:214–234 [DOI] [PubMed] [Google Scholar]
- 19. Kubitschek H. E. 1990. Cell volume increase in Escherichia coli after shifts to richer media. J. Bacteriol. 172:94–101 [DOI] [PMC free article] [PubMed] [Google Scholar]
- 20. Loewen P. C., Hengge-Aronis R. 1994. The role of the sigma factor sigmas (KatF) in bacterial global regulation. Annu. Rev. Microbiol. 48:53–80 [DOI] [PubMed] [Google Scholar]
- 21. Ostrom E., Burger J., Field C. B., Norgaard R. B., Policansky D. 1999. Revisiting the commons: local lessons, global challenges. Science 284:278–282 [DOI] [PubMed] [Google Scholar]
- 22. Reeve C. A., Amy P. S., Matin A. 1984. Role of protein synthesis in the survival of carbon-starved Escherichia coli K-12. J. Bacteriol. 160:1041–1046 [DOI] [PMC free article] [PubMed] [Google Scholar]
- 23. Vulic M., Kolter R. 2001. Evolutionary cheating in Escherichia coli stationary phase cultures. Genetics 158:519–526 [DOI] [PMC free article] [PubMed] [Google Scholar]
- 24. Zambrano M., Siegele D., Almiron M., Tormo A., Kolter R. 1993. Microbial competition: Escherichia coli mutants that take over stationary phase cultures. Science 259:1757–1760 [DOI] [PubMed] [Google Scholar]
Associated Data
This section collects any data citations, data availability statements, or supplementary materials included in this article.