Abstract
TRIM28 (KAP1) is upregulated in many cancers and has been implicated in both transcriptional activation and repression. Using chromatin immunoprecipitation and sequencing, we show that KAP1 binding sites fall into several categories, specifically, the 3′ coding exons of zinc finger (ZNF) genes and promoter regions of ZNFs and other genes. The currently accepted model is that KAP1 is recruited to the genome via interaction of its N-terminal RBCC domain with KRAB ZNFs (KRAB domain containing ZNFs). To determine whether the interaction of KAP1 with KRAB ZNFs is the mechanism by which KAP1 is recruited to genomic binding sites, we analyzed stable cell lines that express tagged wild-type and mutant KAP1. Surprisingly, deletion of the RBCC domain abolished KAP1 binding to the 3′ exons of ZNF genes but KAP1 binding to promoter regions was unaffected. Using KAP1 knockdown cells, we showed that the genes most responsive to KAP1 were not ZNF genes but instead were either indirect targets or had KAP1 bound 10 to 100 kb from the transcription start site. Therefore, our studies suggest that KAP1 plays a role distinct from transcriptional regulation at the majority of its strongest binding sites.
INTRODUCTION
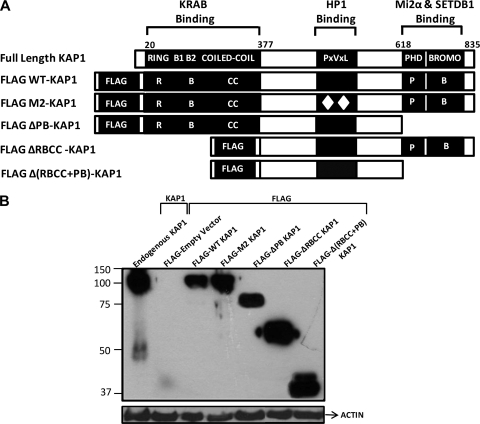
KAP1 is upregulated in many cancers and is thought to be a critical driver of neoplastic transformation; gastric cancer patients with high levels of KAP1 show a significantly poorer survival rate than patients with low KAP1 (39). KAP1 is a large protein that can interact with a variety of factors implicated in both gene activation and repression. At the N terminus, KAP1 contains four conserved structural domains that include a RING finger, two B boxes, and a leucine zipper coiled-coil region, which are collectively called the RBCC or TRIM domain. The central part of the KAP1 protein contains a PxVxL pentapeptide region that mediates interaction with heterochromatin protein 1 (HP1). A plant homeodomain (PHD) finger and a bromodomain are located at the C terminus of KAP1 (see Fig. 1). The characterized KAP1 interaction domains have been shown to be important for the formation of a large complex that is thought to be involved in heterochromatin formation. For example, the C-terminal PHD and bromodomain recruit components of the NuRD histone deacetylase complex and the H3 lysine 9-specific histone methyltransferase SETDB1 (18, 27, 28). The middle PxVxL motif interacts with HP1 (26), which in turn can bind to histone H3 that has been methylated on lysine 9 (H3K9me3). Thus, the PHD, bromodomain, and PxVxL domain are thought to work cooperatively to form condensed heterochromatin containing the characteristics of low histone acetylation, high H3K9me3, and high HP1 binding. None of these proteins (including KAP1) have DNA binding domains, and therefore, the complex must be brought to the DNA via interaction with DNA binding proteins. The N terminus of KAP1 contains the RBCC domain, which has been implicated in the interaction of KAP1 with a variety of transcription factors. For example, the RBCC domain of KAP1 can interact with the KRAB domain(s) present in the very large set of KRAB ZNF transcription factors (33) and in a small set of proteins that do not have zinc fingers but instead serve as bridging domains between KAP1 and a DNA-binding factor (22). In addition, the KAP1 coiled-coil region can bind to E2F1 and MDM2 (35, 36), a KAP1 construct lacking the RBCC region (but containing amino acids [aa] 394 to 835) can interact with several members of the STAT family (32), and full-length KAP1 can interact with NGFI (23). However, none of these studies have investigated the roles of the different protein interaction domains of KAP1 in recruiting KAP1 to chromatin on a genome-wide scale. Therefore, the focus of this study was to test, in living cells, the role of each of the known protein interaction domains in recruiting KAP1 to genomic sites.
Fig. 1.
Description and expression of KAP1 mutants. (A) Illustration of endogenous KAP1 protein and the KAP1 mutants used in this study. Well-characterized protein interaction domains of KAP1 are indicated along with their interacting partners. All of the mutant constructs, as well as WT KAP1, were tagged with the FLAG peptide at the N terminus. (B) Western blot analysis of KAP1 mutant stable cell lines. Plasmids bearing the FLAG vector, FLAG-tagged WT KAP1, or FLAG-tagged mutant KAP1 constructs were stably transfected into HEK293 cells. Shown are Western analyses of nuclear extract from untransfected HEK293 cells probed with a KAP1 antibody (lane 1); nuclear extract from HEK293 cells harboring the empty FLAG vector, probed with the anti-FLAG antibody (lane 2); and nuclear extracts from HEK293 cells harboring various KAP1 constructs, probed with the anti-FLAG antibody (lanes 3 to 7). The positions of the molecular weight markers are shown on the left. Each lane was also probed with an antibody to actin as a loading control.
MATERIALS AND METHODS
Cell culture.
Ntera2D1 (ATCC CRL-1973), Ntera2D1 green fluorescent protein (GFP; control), and Ntera2D1 K2 GFP (KAP1 knockdown) cells; U2OS K4/WT cells (14); and HEK293 cells (ATCC CRL-1573) were grown in Dulbecco's modified Eagle medium (DMEM) supplemented with 10% fetal bovine serum (FBS)-2 mM glutamine-1% penicillin and streptomycin. Zeocin (100 μg/ml) was added to the medium used for growing U2OS cells and the stable cell lines generated in HEK293 cells. The stable cell line generated in T-Rex HEK293 cells was grown in the above medium supplemented with 5 μg/ml blasticidin and 1 mg/ml G418. All cells were incubated at 37°C in a humidified 5% CO2 incubator.
Generation of KAP1 stable cell lines.
Stable clones were generated by transfecting HEK293 cells on 6-well dishes with 2 μg of the pcDNA3.1-FLAG- WT-KAP1, pcDNA3.1-FLAG-M2-KAP1, pcDNA3.1-FLAG-ΔPB-KAP1, or pcDNA3.1-FLAG-ΔRBCC-KAP1 construct using the calcium phosphate method of transfection. Briefly, 2 μg of the plasmid DNA was diluted in 328.5 μl of water and 46.5 μl of 2.5 M CaCl2 was mixed into the solution, followed by 375 μl of 2× Hanks phosphate-buffered saline (PBS), and the mixture was added to the cells in a dropwise manner. Fresh medium was added to the cells 11 h after transfection. Forty-eight hours after transfection, the cells were placed under selection in medium containing 100 μg/ml zeocin. Individual drug-resistant colonies were isolated and assayed for ectopic FLAG-KAP1 fusion protein expression by Western blot analysis of the nuclear protein extract using anti-FLAG-tagged M2-peroxidase antibody (Sigma A8592). Nuclear protein extract was prepared in the following manner. Harvested cells were washed in ice-cold PBS and swelled in hypotonic cell lysis buffer (20 mM Tris [pH 7.5], 5 mM MgCl2, 1 mM EDTA, and 1 mM dithiothreitol plus protease inhibitors) for 10 min. Nuclei were released by passing the solution through a 22-gauge needle 5 times and spun at 5,000 rpm for 5 min at 4°C. Pelleted nuclei were resuspended in radioimmunoprecipitation assay buffer (25 mM Tris [pH 7.6], 150 mM NaCl, 1% NP-40, 1% sodium deoxycholate, and 0.1% sodium dodecyl sulfate plus protease inhibitors) for 30 min with frequent vortexing and spun at 14,000 rpm for 10 min at 4°C. Twenty-five micrograms of the resulting nuclear extract was boiled in sodium dodecyl sulfate (SDS) sample buffer for 5 min before being loaded onto a 10% SDS-polyacrylamide gel and further processed by the method described by Xu et al. (38). Selected positive clones for each fusion protein were expanded in culture for further analyses. The Δ(RBCC+PB)-KAP1 plasmid was created by subcloning the region of KAP1 from aa 377 to aa 618 from the pcDNA3.1-FLAG-ΔPB-KAP1 plasmid into the pT-Rex-3X FLAG vector (a gift from Kevin Struhl), and stable clones for this fusion protein were generated by transfecting T-Rex HEK293 cells purchased from Invitrogen (R710-07) by the exact method described above, with differences in the selection agent (1 mg/ml G418) and addition of 1 μg/ml doxycycline to the cells 24 h before harvesting.
Generation of the KAP1 knockdown cells.
Lentiviral vector-based KAP1 gene knockdown was performed as described previously (35). Briefly, pLSL-GFP vectors expressing short hairpin RNAs (shRNAs) from the human H1 gene promoter were cotransfected with packaging plasmids pCMV-VSV-G and pCMV-deltaR8.2 into 293T cells on a 10-cm dish. 293T cells were cultured in DMEM supplied with 10% FBS. Viral supernatants were collected from the transfected 293T cells 24, 36, 48, and 60 h posttransfection were filtered through 0.45-μm polyvinylidene difluoride syringe filters and used for multiple infection of ∼5 × 10⁴ Ntera2 cells grown on 6-well plates in the presence of 4 μg/ml Polybrene (Sigma). Filtered viral supernatants were diluted 2-fold with fresh medium and added every 12 h to target cells. The Ntera2 cells were infected with >100% efficiency judged by GFP fluorescence, expanded, and used as a mass culture for subsequent experiments.
Chromatin immunoprecipitation (ChIP) assays.
All cells were harvested when they were ∼80% confluent and cross-linked with 1% formaldehyde for 10 min at room temperature. Cross-linking was stopped by the addition of 125 mM glycine for 5 min, and cells were washed twice with ice-cold PBS, scraped from the dish, snap-frozen, and stored at −80°C. ChIP assays were performed using 1 × 10⁷ cells per assay following the protocol provided at http://farnham.genomecenter.ucdavis.edu/pdf/FarnhamLabChIP%20Protocol.pdf, with the following minor changes. StaphA cells were blocked only with BSA before use and the preclearing step was omitted. Nuclear extract was sonicated for 30 min, with 30-s pulses, 1.5 min resting, using the Bioruptor sonicator from Diagenode. The primary antibodies used in this study were FLAG (Sigma F1804), KAP1 (Abcam Ab10483), SetDB1 (Proteintech Group catalog no. 11231-1-AP), H3me3K9 (Abcam Ab8898), H3me3K36 (Cell Signaling Technology catalog no. 9763S), H3me3K4 (Cell Signaling Technology catalog no. 9751), ELK4 (Santa Cruz Biotechnology sc-13030X), and YY1 (Santa Cruz Biotechnology sc-1703X), and nonspecific rabbit IgG was used as a negative control (Alpha Diagnostics catalog nol. 210-561-9515). The secondary rabbit anti-mouse IgG was from MP Biomedicals (catalog no. 55436). The ChIP samples and input sample (10% of the amount of chromatin used per ChIP) were purified using the QIAquick PCR purification kit (Qiagen) according to manufacturer's instructions, and purified eluates were dissolved in 50 μl of water. Standard PCRs were performed using 2 μl of the purified ChIP or input (diluted 1:100) DNA sample. Quantitative real-time PCR (qPCR) was performed in duplicate from two independent ChIP assays using 1 μl of ChIP or input DNA (diluted 1:100) sample on the Bio-Rad DNA Engine Opticon real-time PCR system using SYBR green Master PCR mix (Sigma) according to the manufacturer's instructions. Fold enrichment for each target site was calculated as two to the power of the threshold cycle difference between the input DNA and ChIP samples. Four primer sets were used as negative controls, all of which showed low to no enrichment. Fifteen other positive validation sites were chosen over a range of subgroups as defined in Results. All of the primers used are listed in Table S4 in the supplemental material. We note that for all ChIP experiments analyzing the wild-type (WT) and mutant KAP1 constructs, ChIPs against YY1 were also performed using the same sonicated chromatin. These ChIP samples were tested by qPCR at two known binding sites for YY1. The fold enrichment for YY1 at these two binding sites was comparable in all of the WT and mutant KAP1 stable cell lines tested (data not shown). This demonstrated that the difference in fold enrichment for the various KAP1 mutants versus WT KAP1 was not the result of differing sonication or chromatin conditions in the various stable cell lines.
ChIP-and-sequencing (ChIP-seq) assays.
For ChIP-seq assays, eluates from 10 ChIPs were pooled and prepared as a single library using the protocol described previously (24), with the following minor changes. For all libraries, the 400- to 600-bp gel fragment was isolated and purified and amplification (15 cycles) was performed only after gel purification. In general, the 400- to 600-bp fragment libraries contain higher enrichments for heterochromatic regions and factors that bind them, such as KAP1. Input libraries were prepared using 20 ng of purified DNA from the input sample. Final purification of the amplified library was done using Agencourt AMPure XP beads (Beckman Coulter Genomics catalog no. A63880) according to manufacturer's recommendations. The concentration of the library was obtained using a bioanalyzer to estimate the appropriate amount of sample needed to load onto the flow cell. ChIP-seq libraries were run on an Illumina GA2 by the DNA Technologies Core Facility at the University of California—Davis (http://genomecenter.ucdavis.edu/dna_technologies/) or at Stanford University. ChIP-seq data were analyzed using Sole-search version 2 (4; see also http://chipseq.genomecenter.ucdavis.edu/cgi-bin/chipseq.cgi). The parameters used were an alpha value of 0.0001, an FDR value of 0.01, and a blur length set to 400 bp. Peak overlap analysis based on chromosomal coordinates and location analysis were also performed using the Sole-search software.
Motif analysis.
To identify proteins that could potentially act to recruit or partner with KAP1 at its promoter-centric targets, the top 100 ChIP-seq peaks for FLAG-ΔRBCC-KAP1 were used in de novo motif analysis. Since true binding sites fall under the center of a peak (17), we used 100 bp (±50 bp) around the center of each FLAG-ΔRBCC-KAP1 binding site for motif analysis using the W-ChIP motifs program (15). The default background of W-ChIP motifs was applied, which uses 5,000 randomly selected promoters providing P values and Bonferroni values to determine the significance of each motif. From the identified motifs, clusters of similar motifs were derived based on sequence similarity. Then, the identified motifs were compared to motifs from the TRANSFAC and JASPER database using the Stamp Tool of W-ChIP motifs.
Microscopy.
Immunofluorescence experiments for HEK293 stable cell lines were performed with 6-well dishes using ∼70% subconfluent cells, with the cells being plated onto sterile gelatinized (0.1% gelatin) glass coverslips 24 h prior to analysis. The cells were washed once with ice-cold PBS and fixed with 2% formaldehyde for 10 min at room temperature, followed by two more PBS washes. Cells were permeabilized with 1% Triton X-100 for 10 min at room temperature and incubated with blocking buffer (3% BSA, 0.1% Tween 20, 4× saline sodium citrate [SSC] buffer [150 mM sodium chloride, 15 mM sodium citrate, pH 7.0]) for 20 min. The fixed cells were then incubated with primary antibody in the dark for 1 h at room temperature, followed by three 5-min washes in 4× SSC buffer, and the process was repeated for the secondary antibody. Cells were again washed in PBS and incubated with 4′,6-diamidino-2-phenylindole (DAPI) in the dark for 5 min. Following one last wash in PBS, the coverslips were mounted onto glass slides using a drop of Vectashield mounting medium, stored in the dark, and imaged within 24 h using an epifluorescence microscope (Zeiss Axioplan 2) with the appropriate filters. All antibodies were used at a 1:200 dilution in blocking buffer; antibodies used were anti-FLAG antibodies (Sigma F1804 and F7425), anti-KAP1 antibody (Abcam Ab10483), anti-endosome EEA1 antibody (Abcam Ab2900), Alexa Fluor 488-conjugated secondary antibody (Molecular Probes), and Cy3-conjugated secondary antibody (Jackson ImmunoResearch).
RNA arrays.
Total RNA was prepared from Ntera2D1 GFP and Ntera2D1 K2 GFP (KAP1 knockdown) cells using the RNeasy kit (Qiagen) following the manufacturer's instructions. RNA quality was ensured using the Agilent Systems bioanalyzer. The Illumina Total Prep RNA amplification kit from Ambion (AMIL1791) was used to generate biotinylated amplified RNA for hybridization with the Illumina Sentrix Expression Beadchips, HumanRef-6 v2. The Sentrix gene expression Beadchip used for this study consisted of an eight-array format comprising more than 22,000 transcripts/array from Refseq sequences (Illlumina, Inc., San Diego, CA). Arrays were processed in accordance with the manufacturer's instructions, scanned at medium PMT settings as recommended by the manufacturer, and analyzed using Bead Studio Software 2.3.41, all by the UC Davis Expression Analysis Core Facility. Data were normalized by the “average” method, which simply adjusts the intensities of two populations of gene expression values such that the means of the populations become equal. Differential expression was calculated for the control cells (NT2D1 GFP) versus the KAP1 knockdown cells (NT2D1 K2 GFP) using an algorithm provided by Bead Studio. Fold enrichment values were used to obtain the list of candidates with a greater than 1.33-fold change.
Nucleotide sequence accession number.
All ChIP-seq data were deposited in the Gene Expression Omnibus (GEO) database at the NCBI (http://www.ncbi.nlm.nih.gov/geo) under accession no. GSE27929.
RESULTS
The SETDB1 histone methylation complex is recruited to specific subsets of KAP1 targets.
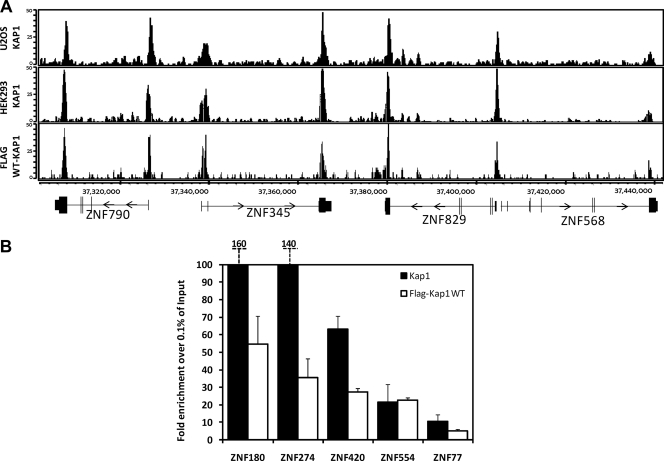
As indicated above, a currently accepted model in the field is that KAP1 is brought to the genome via interaction of its N-terminal RBCC domain with a family of site-specific transcription factors that contain a KRAB domain and a zinc finger DNA binding domain. This model is well supported by in vitro experiments showing interactions between KAP1 and KRAB domains of various KRAB ZNFs (1, 8, 9, 20). However, the model has not been tested in cells on a genome-wide scale. To do so, we have created a series of KAP1 expression constructs that have an N-terminal FLAG tag and then full-length WT KAP1, full-length KAP1 harboring a 2-aa mutation in the HP1 binding domain, C-terminal deletion-containing KAP1 (which is missing the PHD and the bromodomain), N-terminal deletion-containing KAP1 (which is missing the RBCC domain), and a double deletion mutant which is missing both the N- and C-terminal domains (Fig. 1A). These plasmids were stably transfected into HEK 293 cells, and expression of the different KAP1 proteins was verified by Western blot analysis (Fig. 1B). Next, ChIP experiments were performed using the KAP1 antibody or the FLAG antibody. Libraries were prepared and sequenced using Illumina GA2 machines (see Table S1 in the supplemental material for a list of all ChIP-seq experiments). The ChIP-seq profiles generated using the FLAG antibody or the KAP1 antibody are basically identical (Fig. 2A), demonstrating that the FLAG antibody can provide high-quality ChIP-seq data. We then chose five KAP1 binding sites identified in the ChIP-seq data sets and performed confirmation qPCR analysis using ChIP samples different from those used for the ChIP-seq libraries; all samples showed high enrichment of KAP1 over the input at the target sites identified by ChIP-seq (Fig. 2B).
Fig. 2.
Comparison of FLAG-tagged and endogenous KAP1. (A) ChIP-seq binding patterns. Snapshots of ChIP-seq results for endogenous KAP1 in U2OS cells, endogenous KAP1 in HEK293 cells, and FLAG-tagged WT KAP1 in HEK293 cells for a region on chromosome 19. The number of sequenced tags is shown on the y axis, and the coordinates of several ZNF genes are shown on the x axis. (B) ChIP-PCR confirmation of KAP1 binding sites. ChIPs were performed with HEK293 cells stably expressing FLAG-tagged WT KAP1. Antibodies that recognize KAP1 or the FLAG tag were used. Five binding sites identified by ChIP-seq were confirmed by qPCR using independent ChIP samples. The fold enrichment of KAP1 and FLAG-tagged WT KAP1 (compared to 0.1% of the starting chromatin) is shown; results are from two independent replicates; the error bars indicate standard errors.
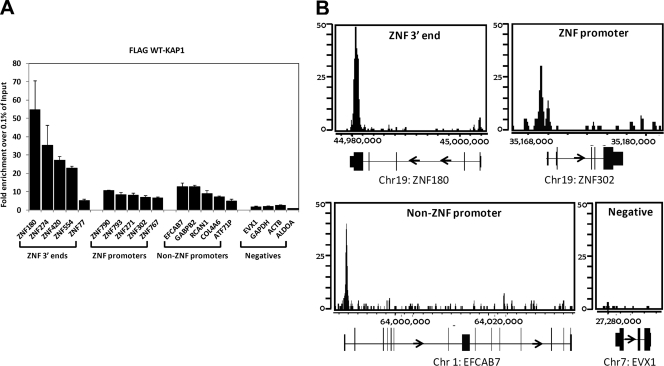
We had previously shown that the most significantly enriched category of genes identified by genome-wide profiling of KAP1 is the set of C2H2 ZNF genes (9, 19). As shown in Fig. 2A, KAP1 can bind to both the 3′ exons and the promoter regions of ZNF genes in multiple cell types. We also identified a set of promoter regions for genes other than ZNFs that are bound by KAP1. To more quantitatively compare the binding of KAP1 at the three different categories of binding sites (3′ exons of ZNF genes, promoters of ZNF genes, and promoters of non-ZNF genes), we performed ChIP-qPCR analysis of 5 binding sites for each category and 4 negative controls (Fig. 3A). In general, the strongest binding sites are the 3′ ZNF exons, with the two categories of promoter regions showing less enrichment. A representative example of the ChIP-seq data from each category is shown in Fig. 3B.
Fig. 3.
KAP1 binds to promoters and nonpromoter regions. (A) Five binding sites identified by ChIP-seq were selected from each of three different types of KAP1 targets, i.e., 3′ ends of ZNF genes, 5′ regions of ZNF genes, and 5′ regions of non-ZNF genes; 4 negative-control regions were also chosen. All regions were tested by ChIP-qPCR using an antibody against the FLAG peptide and HEK293 cells stably expressing FLAG-tagged WT KAP1. Fold enrichment for FLAG-tagged WT KAP1 (compared to 0.1% of the starting chromatin) is shown; results are from two independent replicates, and the error bars indicate standard errors. (B) Shown are ChIP-seq profiles for FLAG-tagged WT KAP1 for an example from each category of KAP1 binding sites. The number of sequenced tags is shown on the y axis, and the genomic coordinates are shown on the x axis. The arrow indicates the direction of transcription.
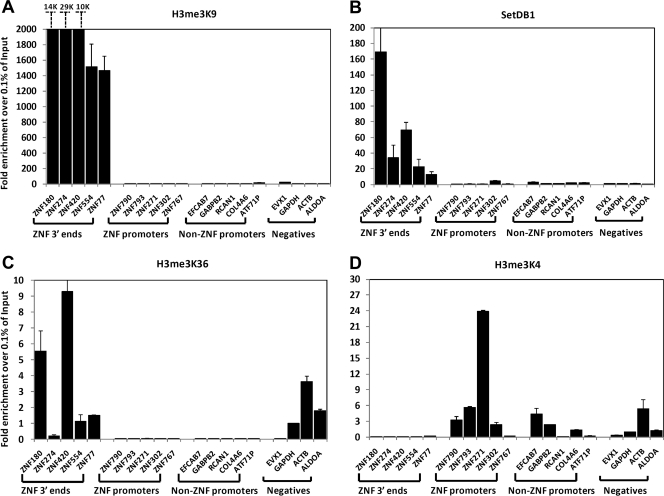
KAP1 can be purified as part of a large complex that contains SETDB1, a histone methyltransferase that trimethylates histone H3 on lysine 9. To determine if this complex is present at all categories of KAP1 targets, we performed ChIP assays using antibodies to SETDB1 and H3K9me3. As shown in Fig. 4A and B, SETDB1 and H3K9me3 are found at the KAP1 sites that correspond to the 3′ ends of ZNF genes but are not found at the KAP1 sites that correspond to promoter regions. Others have previously shown that levels of the modified histone H3K36me3 are higher at the 3′ end of a gene than at the 5′ end (2). Accordingly, we also observe high levels of H3K36me3 at the KAP1 targets that correspond to 3′ exons but not at the promoter regions (Fig. 4C). In contrast, H3K4me3, a mark that corresponds to active promoter regions, is found at the KAP1 binding sites located in promoter regions but not at the 3′ ZNF exons.
Fig. 4.
The SETDB1 histone methylation complex is recruited to specific subsets of KAP1 targets. ChIP-qPCR data for H3K9me3 (A), SetDB1 (B), H3K36me3 (C), and H3K4me3 (D) at the chosen binding sites (see Fig. 3) from HEK293 cells stably expressing FLAG-tagged WT KAP1. Fold enrichment (compared to 0.1% of the starting chromatin) is shown; results are from two independent replicates, and the error bars indicate standard errors.
Interaction with HP1 is required for efficient nuclear retention and tethering of KAP1 to all genomic binding sites.
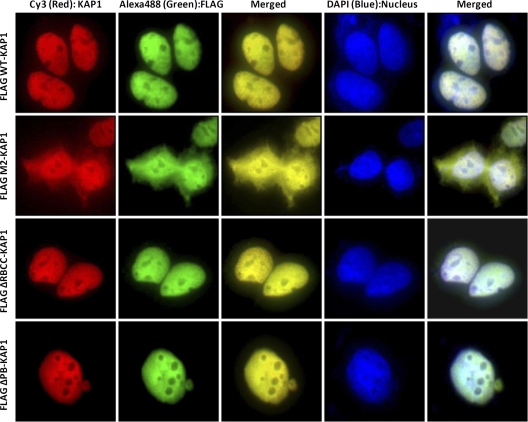
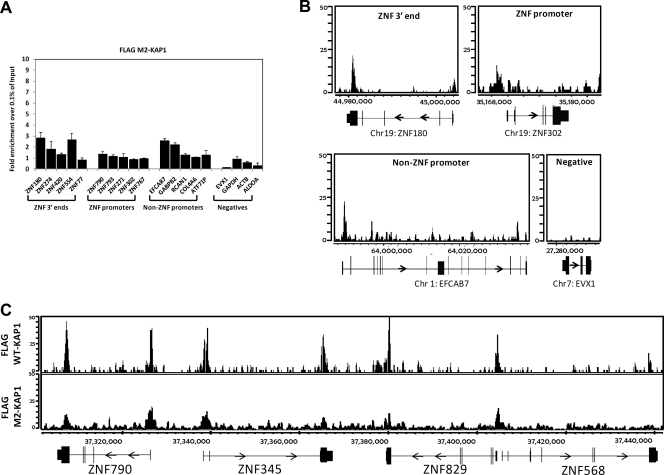
HP1 can interact directly with H3K9me3 and with the PxVxL motif in the central region of KAP1. It is thought that KAP1 can recruit both SETDB1 and HP1 to target sites; SETDB1 would mediate H3K9me3 deposition, and then HP1 (initially brought in via interaction with KAP1) would bind to H3K9me3 and help to create a very stably bound KAP1 complex. Also, once KAP1 is recruited via a KRAB ZNF to a specific cis element, the HP1-H3K9me3 interaction may allow spreading of the KAP1-SETDB1 complex and the formation of an extended region of condensed heterochromatin. This model suggests that interaction with HP1 would greatly influence the amount of KAP1 that is bound to the genome, perhaps only at those sites that are also marked by H3K9me3. To explore this possibility, we performed immunofluorescence experiments to visualize the WT and mutant KAP1 constructs (Fig. 5). We found that WT KAP1 and the N-terminal and C-terminal deletion mutants of KAP1 were all located exclusively in the nucleus. However, the HP1 binding-deficient M2 protein was spread throughout the nucleus and the cytoplasm, suggesting that KAP1-HP1 interaction is required for efficient retention of KAP1 protein in the nucleus. We showed in Fig. 4 that the promoters bound by KAP1 are not bound by SETDB1 or H3K9me3. Therefore, it was possible that mutation of the HP1 binding domain of KAP1 would affect the efficiency of binding of KAP1 to the ZNF 3′ exons (since they had high levels of H3K9me3) but would not affect the efficiency of binding of KAP1 to the promoter sites (since they did not have H3K9me3). To test this hypothesis, we performed ChIP-seq with the cells stably transfected with the FLAG-tagged M2-KAP1 construct that is mutated in the HP1 binding domain. We found that the efficiency of binding of KAP1 to all sites was decreased (Fig. 6). Although the enrichment as quantitated by qPCR (Fig. 6A) is much reduced at all KAP1 sites, KAP1 is still correctly targeted to the genome, as shown by the ChIP-seq binding patterns (Fig. 6B and C). Thus, interaction with HP1 affects the efficiency of KAP1 binding but not the genomic localization of KAP1.
Fig. 5.
Interaction with HP1 is required for efficient nuclear retention of KAP1. Immunofluorescence staining was performed with HEK293 cells stably expressing either WT or mutant KAP1 proteins using antibodies against the FLAG tag (green) or KAP1 (red); nuclei were stained with DAPI (blue).
Fig. 6.
Interaction with HP1 is required for efficient tethering of KAP1 to DNA. (A) ChIP-qPCR was performed using an antibody against the FLAG tag and HEK293 cells stably expressing FLAG-tagged M2-KAP1 (this KAP1 construct harbors two amino acid substitutions in the HP1 binding domain). Fold enrichment of FLAG-tagged M2-KAP1 (compared to 0.1% of the starting chromatin) is shown; results are from two independent replicates, and the error bars indicate standard errors. (B) Shown are ChIP-seq profiles for FLAG-tagged M2-KAP1 for an example from each category of KAP1 binding sites. The number of sequenced tags is shown on the y axis, and the genomic coordinates are shown on the x axis. The arrows indicate the direction of transcription. (C) Snapshot of ChIP-seq data for FLAG-tagged M2-KAP1, compared to WT KAP1, at a region on chromosome 19. The number of sequenced tags is shown on the y axis, and the genomic coordinates are shown on the x axis. The arrows indicate the direction of transcription.
KAP1 genomic recruitment to ZNF 3′ ends, but not to promoter regions, is dependent on its ability to interact with KRAB ZNFs.
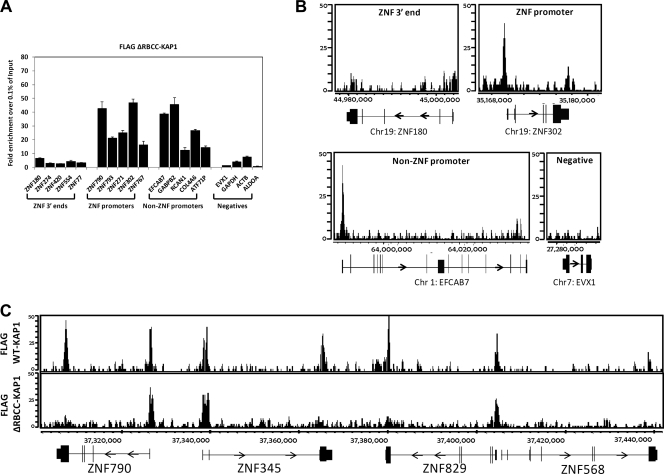
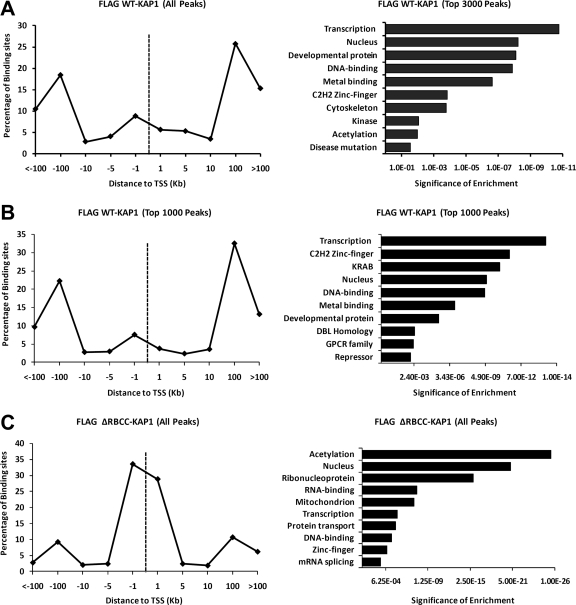
We have clearly shown that there are at least two classes of KAP1 binding sites, ZNF 3′ exons which are bound by SETDB1 plus H3K9me3 and promoter regions which are not bound by SETDB1 or H3K9me3. As mentioned above, the KAP1-SETDB1 complex is thought to be recruited to the DNA via interaction of the RBCC domain of KAP1 with KRAB ZNF transcription factors. However, it is unusual for site-specific transcription factors to bind to 3′ exons and therefore it was possible that the promoter-specific KAP1 sites would be dependent upon interaction of KAP1 with a site-specific KRAB ZNF whereas KAP1 might be targeted to 3′ ZNF exons via a different mechanism. To test this hypothesis, we performed ChIP-seq using the cells stably expressing the FLAG-tagged KAP1-ΔRBCC mutant. Surprisingly, we found that the recruitment of KAP1 to 3′ ZNF exons was abolished but that the recruitment of KAP1 to promoter regions remained unaffected (Fig. 7). In fact, the enrichment, as monitored by qPCR, of KAP1-ΔRBCC at promoter regions (∼20- to 40-fold relative to the input) is greater than the enrichment of WT KAP1 (∼8- to 10-fold relative to the input) at the same regions (compare Fig. 7A to Fig. 3A), suggesting that elimination of the ability of KAP1 to bind to 3′ ZNF exons provides more available KAP1 for binding to promoter regions. The specific loss of KAP1 at 3′ ZNF exons can be seen both in the ChIP-PCR analysis (Fig. 7A) and in the ChIP-seq analysis (Fig. 7B and C). In fact, a location analysis clearly shows that the peaks identified by ChIP-seq analysis of the FLAG-tagged KAP1-ΔRBCC mutant are all located near transcription start sites (Fig. 8C), in contrast to the set of all peaks or the set of top-ranked peaks identified by ChIP-seq analysis of the FLAG-tagged KAP1-WT protein (Fig. 8A and B).
Fig. 7.
The RBCC domain of KAP1 is required for recruitment to the 3′ ends of ZNF genes. (A) ChIP-qPCR was performed using an antibody against the FLAG tag and HEK293 cells stably expressing FLAG-tagged ΔRBCC-KAP1 (this KAP1 construct contains a deletion of the domain that interacts with KRAB ZNFs). Fold enrichment for FLAG-tagged ΔRBCC-KAP1 (compared to 0.1% of the starting chromatin) is shown; results are from two independent replicates, and the error bars indicate standard errors. (B) Shown are ChIP-seq profiles for an example from each category of KAP1 binding sites for FLAG-tagged ΔRBCC-KAP1. The number of sequenced tags is shown on the y axis, and the genomic coordinates are shown on the x axis. The arrows indicate the direction of transcription. (C) Snapshot of ChIP-seq data for FLAG-tagged ΔRBCC-KAP1, compared to WT KAP1, at a region on chromosome 19. The number of sequenced tags is shown on the y axis, and the genomic coordinates are shown on the x axis. The arrows indicate the direction of transcription.
Fig. 8.
Functional annotation of WT KAP1 versus ΔRBCC-KAP1 binding sites. Gene ontology analyses (right panels) and location analyses (left panels) are shown for all FLAG-tagged WT KAP1 peaks (A), the top 1,000 FLAG-tagged WT KAP1 peaks (B), and all FLAG-tagged ΔRBCC-KAP1 (∼1,000 total) peaks (C). For the gene ontology analyses, the nearest gene to each binding site was identified and then the program DAVID (6, 13) was used to identify enriched categories; redundant categories were eliminated, and the top 10 categories based on their P value are shown. Ontology terms are shown on the y axis; P values for the significance of enrichment are graphed along the x axis. For the location analyses, the distance between the binding sites and the closest transcription start site (using the UCSC KnownGenes HG19) is shown. Distances were calculated from the center of the KAP1 binding site to the nearest transcription start site and binned in progressively larger intervals between 100 kb upstream and 100 kb downstream of the transcription start site.
Using ChIP-chip, we had previously shown that essentially all of the top-ranked KAP1 targets in Ntera2 cells were identified as ZNF genes, based on the most highly enriched gene category as determined using the DAVID analysis program (19). This is also true using ChIP-seq to analyze KAP1 binding in HEK293 cells (Fig. 8A and B). It is likely that the most significant gene category of KAP1 targets is ZNFs is due in part to the fact that the strongest binding sites for WT KAP1 are the 3′ exons of the ZNF genes (Fig. 3A). However, removal of the ZNF 3′ exon binding sites from the list of targets (by using the peaks identified by ChIP-seq with the FLAG-tagged KAP1-ΔRBCC mutant) allows a better characterization of the other types of genes bound by KAP1. Interestingly, the set of proteins encoded by the genes whose promoters are bound by FLAG-tagged KAP1-ΔRBCC is highly enriched for key regulatory proteins, including proteins involved in regulating RNA and protein synthesis and processing (Fig. 8C). Although some zinc finger genes were identified in the set of targets of FLAG-tagged KAP1-ΔRBCC, these are due to binding of FLAG-tagged KAP1-ΔRBCC to the ZNF promoters, not to the 3′ exons.
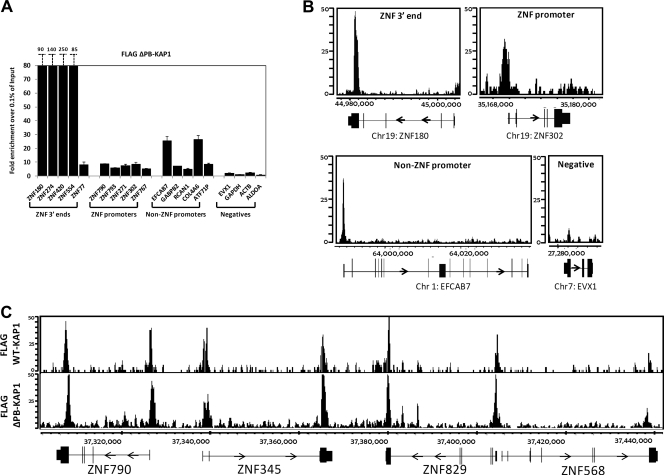
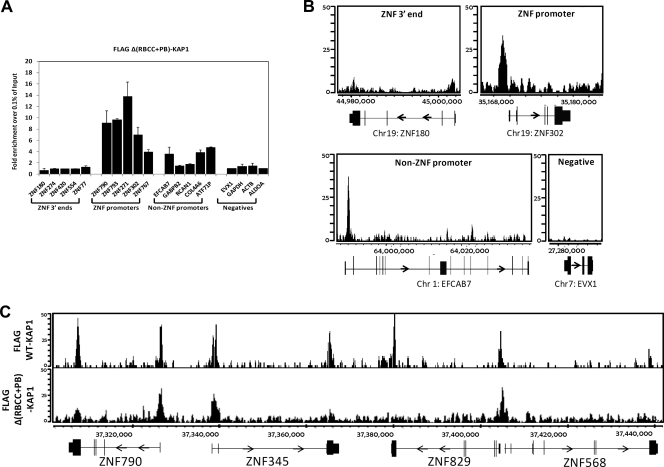
Because recruitment of KAP1 to promoter regions was not dependent on the RBCC domain, we analyzed additional KAP1 mutants by ChIP-seq. Specifically, we wished to determine if the C-terminal PHD and bromodomain of KAP1 were involved in recruitment to promoter regions. We created stable cells lines harboring FLAG-tagged ΔPB-KAP1 and FLAG-tagged Δ(RBCC+PB)-KAP1 and performed ChIP-seq analysis. We found that KAP1 was still targeted to promoter regions when lacking the C-terminal domain (Fig. 9) and when both the C-terminal and N-terminal domains were removed (Fig. 10). Thus, the RBCC, the PHD, and the bromodomain of KAP1 are all dispensable for recruitment to promoter regions. Although there are no other characterized protein interaction domains in KAP1, KAP1 does interact with site-specific transcription factors besides KRAB ZNFs. For example, others have shown that KAP1 can be copurified with NGFI-B and colocalize on the POMC promoter with NGFI-B (23). We reasoned that if a specific transcription factor was responsible for the recruitment of KAP1 to a large number of promoter regions, we might be able to identify a motif common to the KAP1 promoter binding sites. Using our W-ChIPsmotifs program (15, 16), we examined 50 nucleotides (nt) on either side of the center of the peak using the top 100 peaks identified by ChIP-seq analysis of the FLAG-tagged ΔRBCC-KAP1 mutant (which shows very specific binding to promoter regions; Fig. 8C). We chose this nucleotide range because other studies have shown that a known consensus motif for a factor can be found in 75% of the peaks if ∼50 nt from the center of the peak is used for analysis (17). We found that one of the most highly enriched motifs in the set of KAP1 promoter targets was CCGGAA, which highly resembles the motifs for ETS family members (e.g., ELK4 is aCCGGAAgt; see File S1 in the supplemental material for the complete results of the de novo motif finding and File S2 in the supplemental material for comparison of the identified motifs to known motifs). To test the bioinformatic prediction that ELK4 was bound to KAP1 promoter targets, we performed ChIP-seq in HEK293 cells using an antibody to ELK4. Using our Sole-search peak-calling program (4), we identified 3,173 ELK4 peaks. We next performed an overlap analysis of the HEK293 ELK4 peaks and HEK293 FLAG-tagged ΔRBCC-KAP1 peaks and found that 33% (358/1,084) of the KAP1 sites located in promoter regions were also ELK4 targets (for these analyses, the KAP1 and ELK4 peaks were required to overlap by at least 1 nt).
Fig. 9.
The PHD and bromodomain of KAP1 are not required for recruitment to DNA. (A) ChIP-qPCR was performed using an antibody against the FLAG tag and HEK293 cells stably expressing FLAG-tagged ΔPB-KAP1 (this KAP1 construct contains a deletion of the C terminus of KAP1 that removes the PHD and bromodomain). Fold enrichment for FLAG-tagged ΔPB-KAP1 (compared to 0.1% of the starting chromatin) is shown; results are from two independent replicates, and the error bars indicate standard errors. (B) Shown are ChIP-seq profiles for an example from each category of KAP1 binding sites for FLAG-tagged ΔPB-KAP1. The number of sequenced tags is shown on the y axis, and the genomic coordinates are shown on the x axis. The arrows indicate the direction of transcription. (C) Snapshot of ChIP-seq data for FLAG-tagged ΔPB-KAP1, compared to WT KAP1, at a region on chromosome 19. The number of sequenced tags is shown on the y axis, and the genomic coordinates are shown on the x axis. The arrows indicate the direction of transcription.
Fig. 10.
ChIP-seq analysis of KAP1 lacking both the N- and C-terminal domains. (A) ChIP-qPCR was performed using an antibody against the FLAG tag and HEK293 cells stably expressing FLAG-tagged Δ(RBBB+PB)-KAP1 (this KAP1 construct contains a deletion of both the N and the C termini of KAP1). Fold enrichment for Δ(RBBB+PB)-KAP1 (compared to 0.1% of the starting chromatin) is shown; results are from two independent replicates, and the error bars indicate standard errors. (B) Shown are ChIP-seq profiles for an example from each category of KAP1 binding sites for Δ(RBBB+PB)-KAP1. The number of sequenced tags is shown on the y axis, and the genomic coordinates are shown on the x axis. The arrows indicate the direction of transcription. (C) Snapshot of ChIP-seq data for FLAG-tagged Δ(RBBB+PB)-KAP1, compared to WT KAP1, at a region on chromosome 19. The number of sequenced tags is shown on the y axis, and the genomic coordinates are shown on the x axis. The arrows indicate the direction of transcription.
Identification of KAP1-responsive genes.
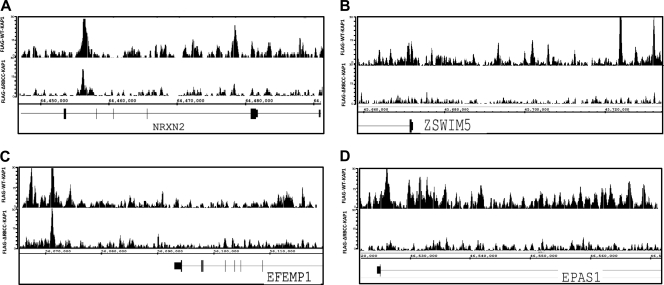
We have shown that KAP1 binds to several different categories of binding sites, including promoters of non-ZNF genes and promoters and 3′ exons of ZNF genes. To determine if the expression of any of the genes in these different categories of genes is influenced by KAP1, we employed Ntera2 cells that stably express shRNAs that target KAP1. We first showed that the KAP1 protein level was greatly reduced in the knockdown cells and that binding of KAP1 was reduced at the ZNF180 target site (Fig. 11A and B). Then, we prepared RNA from the control and knockdown cells and hybridized the RNA to Illumina Sentrix Beadchip arrays. We identified 362 mRNAs that were decreased by at least 2-fold in the knockdown cells (i.e., their expression is normally activated by KAP1) and 143 RNAs whose levels were increased by at least 2-fold in the knockdown cells (i.e., their expression is normally repressed by KAP1; see Fig. 11C and D and Table S2 in the supplemental material for a complete list of the genes that were affected by loss of KAP1). Interestingly, although essentially all of the top KAP1 ChIP-seq peaks correspond to clustered ZNF genes, none of these ZNF RNAs showed expression changes greater than 2-fold in the knockdown cells. We further characterized the RNAs most responsive to reduction of KAP1. We identified the top 100 mRNAs in the “activated by KAP1” category (these mRNAs were decreased between 3- and 50-fold in the KAP1 knockdown cells) and the top 100 mRNAs in the “repressed by KAP1” category (these mRNAs were increased by 2- to 8-fold in the KAP1 knockdown cells). Then, we determined how many of the genes corresponding to these KAP1-regulated mRNAs were bound by KAP1. We found that 52 of the top 100 genes in the activated by KAP1 category and 38 of the top 100 genes in the repressed by KAP1 category were identified as the nearest gene to a KAP1 binding site in the ChIP-seq FLAG-KAP1-WT peak set; a list of these 90 direct KAP1 target genes is provided in Table S3 in the supplemental material. An analysis of the location of KAP1 binding to these 90 genes indicates that KAP1 binds distal to the transcription start site (Fig. 11E and F), not to promoter regions. Thus, the KAP1-responsive genes do not correspond to either of the two main categories of binding targets; they are not 3′ exons of ZNF genes and they do not correspond to promoter regions. Analysis of the ChIP-seq data from the KAP1 mutants indicates that the RBCC domain is required for recruitment of KAP1 to ∼20% of the genes both bound by and responsive to KAP1 (see Table S3 in the supplemental material). ChIP-seq panels of KAP1 for genes activated or repressed by KAP1 are shown in Fig. 12; examples are shown for sites at which both WT KAP1 and the RBCC mutant can bind and for sites at which WT KAP1 but not the RBCC mutant can bind.
Fig. 11.
Analysis of KAP1 knockdown cells. (A) Shown is a Western blot analysis of KAP1 levels in control (NT2 GFP) and knockdown (NT2 K2 GFP) cells. (B) ChIP-PCR of a positive KAP1 binding site (ZNF180) and a negative-control region (EVX1) in control cells (NT2 GFP) and KAP1 knockdown cells (NT2 K2 GFP). RNA from control and KAP1 knockdown cells was analyzed on Illumina Sentrix Beadchip arrays. The fold changes in expression of the genes activated (C) or repressed (D) by KAP1 are shown. The top 100 mRNAs that responded to loss of KAP1 in the activated and repressed sets were further analyzed. First, the mRNAs were compared to the KAP1 target list to determine which were directly regulated by KAP1; 52 of the top 100 activated genes and 38 of the top 100 repressed genes were KAP1 targets. Then, a location analysis was performed on the 52 directly activated (E) and 38 directly repressed (F) KAP1 targets. The binding sites are plotted relative to the start site of transcription of the target gene.
Fig. 12.
ChIP-seq patterns at genes regulated by KAP1. Shown are ChIP-seq patterns for several genes activated (A and B) or repressed (C and D) by KAP1. The binding of KAP1 to EFEMP1, EPAS1, ZSWIM5, and NRXN2 was also confirmed by ChIP-PCR (data not shown).
DISCUSSION
The currently accepted model in the field is that KAP1 is brought to DNA via interaction of the N-terminal RBCC domain with members of the site-specific DNA binding KRAB ZNF family. Once recruited to DNA, KAP1 is thought to serve as a scaffold protein for the assembly of a large repression complex that functions via SETDB1-mediated methylation of histone H3 on lysine 9, leading to the silencing of nearby promoters. We have tested several aspects of this model in our current study, including the role of the RBCC domain in recruiting KAP1 to the genome and the functional consequences of KAP1 binding to promoters, within genes, and intergenic regions. Our studies have provided the first in vivo support for the hypothesis that KAP1 is recruited to the human genome via interaction with KRAB ZNFs. Surprisingly, we show that this recruitment mechanism mediates the binding of KAP1 only to the 3′ ends of ZNF genes and is not involved in the recruitment of KAP1 to promoter regions. Thus, we suggest that several aspects of the current model should be reconsidered.
Using ChIP-seq, we have identified thousands of binding sites for KAP1 in the human genome. To test the first aspect of the model (i.e., that KAP1 is recruited to promoter regions via a KRAB ZNF), we used ChIP-seq to monitor the genome-wide binding pattern of a mutant KAP1 protein that lacks the N-terminal RBCC domain. Surprisingly, we found that the mutant KAP1 protein that lacks the ability to bind to KRAB ZNF transcription factors can still be recruited to promoter regions. However, this mutant protein completely loses the ability to bind to intragenic regions (i.e., the 3′ coding exons of ZNF genes). The requirement for the RBCC domain for binding to the 3′ coding exons of ZNFs may explain why these peaks are by far the strongest in the ChIP-seq data. Others have previously shown that the RBCC domain binds to KRAB domains of ZNFs as a heterotrimer (21). Perhaps a heterotrimeric KAP1 complex is recruited to ZNF 3′ ends, making them more efficient ChIP targets. Because the promoter targets can still be bound by KAP1 lacking the RBCC domain, the complexes at promoters may include only one KAP1 protein.
In an attempt to define the domains of KAP1 that are required for promoter-specific localization, we performed ChIP-seq for three additional mutant KAP1 proteins, including constructs lacking the HP1 binding domain, the C-terminal PHD and bromodomain, and both the N-terminal RBCC and the C-terminal PHD and bromodomain. However, none of these previously identified protein interaction domains were critical for the recruitment of KAP1 to promoter regions. We next turned to motif analyses of the KAP1-bound promoter regions with the goal of identifying binding sites for potential KAP1-recruiting DNA binding proteins. We found that an ETS family motif, in particular, an ELK4 motif, was highly enriched in the top-ranked set of KAP1-bound promoters. To test this bioinformatic prediction that ELK4 might be involved in KAP1 recruitment, we performed ChIP-seq for ELK4 and found that 30% of the KAP1 promoter targets were also bound by ELK4. Further studies, such as targeted knockdown of ELK4 and mass spectroscopy, are required to determine if ELK4 is critical for the recruitment of KAP1.
The second aspect of the model that we have tested in this study was focused on the consequences of having KAP1 bound to a genomic location. We examined cellular RNA in cells stably expressing shRNAs targeting KAP1 and found that depletion of KAP1 has very minor effects on the transcriptome of HEK293 cells. Strikingly, the few genes that are responsive to reduction of KAP1 are not in the set of strong KAP1 binding sites. For example, the strongest KAP1 binding sites are ZNF 3′ exons, followed by ZNF promoters and promoters of other genes. However, the set of ∼90 genes that are both bound by and regulated by KAP1 show KAP1 binding at intergenic regions located quite far from the transcription start site. These results suggest that KAP1 may regulate the transcriptional output of few, if any, genes in the human genome.
How can our current results be reconciled with previous studies that suggest that KAP1 functions as a repressor of transcription? In previous work, KAP1 has been studied using artificial systems (1, 12, 27, 30). For example, several investigations have used drug-regulated artificial fusion proteins (e.g., the KRAB domain of KOX1 fused to the PAX3 DNA binding domain, the GAL4 DNA binding domain, or the Tet repressor DNA binding domain) and a reporter construct containing multiple binding sites for the fusion protein for transcriptional analyses. These experimental designs did, in fact, show KAP1-mediated transcriptional repression. Such studies suggest that perhaps KAP1 has the ability to act as a transcriptional repressor under certain conditions (such as if multiple complexes are recruited via high-affinity DNA binding proteins right at transcriptional start sites), but they do not actually address the role of KAP1 in regulating endogenous cellular genes. A recent study used shRNAs targeting KAP1 to analyze a small number of mRNAs in HeLa cells (12). Using PCR assays, they observed increases in mRNA levels for three ZNF genes in the KAP1 knockdown cells and concluded that KAP1 is involved in repressing these cellular genes. However, the effects were quite modest (generally less than a 10 to 20% increase in transcript levels of the “repressed genes” in the KAP1 knockdown cells). Examination of these same ZNF transcripts in our array data revealed that they were in the “not expressed” category in both the control and KAP1 knockdown cells. The most convincing effect of KAP1 on transcript levels comes from a study of mouse embryonic stem cells. Rowe et al. found robust upregulation of ERV repetitive elements (in particular, the IAP type) in mouse embryonic stem cells lacking KAP1 (25). Interestingly, this observed increase of retrotransposon RNAs was not seen in mouse embryonic fibroblasts lacking KAP1, suggesting that perhaps KAP1 may function in a cell type-specific manner.
Conclusion.
We have used ChIP-seq to perform a genome-wide functional analysis of KAP1 protein mutants, identifying thousands of intragenic sites (mainly 3′ coding exons of ZNF genes) to which KAP1 is recruited via its RBCC domain (and thus likely by a KRAB ZNF) and thousands of intergenic sites (mainly promoter regions of ZNF and non-ZNF genes) to which KAP1 is recruited via a mechanism distinct from RBCC-KRAB ZNF interactions. Interestingly, although the identified binding sites are quite strong and found in multiple cell types, KAP1 does not regulate the expression of most genes that are near its binding sites. However, we have identified a small set of genes that are both responsive to loss of KAP1 and identified as the “nearest” gene to a KAP1 binding site. KAP1 recruitment to some, but not all, of these putative target genes requires the RBCC domain, suggesting that KRAB ZNFs and other site-specific factors may be involved in mediating KAP1-dependent long-range regulation of transcription. However, because the effects of loss of KAP1 on the human transcriptome are very small, we hypothesize that the main role of KAP1 may not lie in transcriptional repression. A striking feature of the KAP1 genomic binding pattern is its enrichment at KRAB ZNF genes. This family of transcription factors is noted for its rapid expansion in recent evolution; there are more than 300 KRAB ZNF genes in the human genome (5, 7, 29, 31). The DNA binding domains of the KRAB ZNFs are encoded in the 3′ exons and consist of multiple copies of highly related zinc fingers. It is possible that the function of the KAP1/SETDB1 complex at these 3′ exons is to deposit H3K9me3 and heterochromatin protein 1 and thus maintain a heterochromatic state that reduces recombination-mediated deletion at the KRAB ZNF gene clusters (3, 34). Also, KAP1 colocalizes with DNA damage response factors at DNA lesions (37), suggesting that KAP1 may provide an important link between heterochromatin and the recognition and repair of DNA by the cellular DNA damage response machinery (10, 11, 40). For example, Ziv et al. (10, 11, 40) have shown that phosphorylation of KAP1 is required for global chromatin decondensation in response to double-strand breaks. Although their studies suggest that a KAP1-mediated conversion of heterochromatin to open chromatin is important in the cellular response to DNA damage, the mechanism by which phosphorylation of KAP1 mediates chromatin decondensation is still unknown. Clearly, further studies focusing on the role of KAP1 in the regulation of genomic integrity are needed.
Supplementary Material
ACKNOWLEDGMENTS
This work was supported by Public Health Service grant CA45240 from the National Cancer Institute and U54HG004558 from the National Human Genome Research Institute.
We thank the DNA Technologies Core at UC Davis and the laboratory of Mike Snyder at Stanford University for assistance with Illumina sequencing, Inderpreet Kaur and Vitalina Komashko for assistance with immunofluorescence, and the members of the Farnham laboratory for helpful discussion.
Footnotes
Supplemental material for this article may be found at http://mcb.asm.org/.
Published ahead of print on 22 February 2011.
REFERENCES
- 1. Ayyanathan K., et al. 2003. Regulated recruitment of HP1 to a euchromatic gene induces mitotically heritable, epigenetic gene silencing: a mammalian cell culture model of gene variegation. Genes Dev. 17:1855–1869 [DOI] [PMC free article] [PubMed] [Google Scholar]
- 2. Barski A., et al. 2007. High-resolution profiling of histone methylations in the human genome. Cell 129:823–837 [DOI] [PubMed] [Google Scholar]
- 3. Blahnik K. R., et al. 2011. Characterization of the contradictory chromatin signatures at the 3′ exons of zinc finger genes. PLoS One 6:e17121. [DOI] [PMC free article] [PubMed] [Google Scholar]
- 4. Blahnik K. R., et al. 2010. Sole-search: an integrated analysis program for peak detection and functional annotation using ChIP-seq data. Nucleic Acids Res. 38:e13. [DOI] [PMC free article] [PubMed] [Google Scholar]
- 5. Dehal P., et al. 2001. Human chromosome 19 and related regions in mouse: conservative and lineage-specific evolution. Science 293:104–111 [DOI] [PubMed] [Google Scholar]
- 6. Dennis G. J., et al. 2003. DAVID: database for annotation, visualization, and integrated discovery. Genome Biol. 4:P3. [PubMed] [Google Scholar]
- 7. Emerson R. O., Thomas J. H. 2009. Adaptive evolution in zinc finger transcription factors. PLoS Genet. 5:e1000325. [DOI] [PMC free article] [PubMed] [Google Scholar]
- 8. Friedman J. R., et al. 1996. KAP-1, a novel corepressor for the highly conserved KRAB repression domain. Genes Dev. 10:2067–2078 [DOI] [PubMed] [Google Scholar]
- 9. Frietze S., O'Geen H., Blahnik K. R., Jin V. X., Farnham P. J. 2010. ZNF274 recruits the histone methyltransferase SETDB1 to the human genome. PLoS One 5:e15082. [DOI] [PMC free article] [PubMed] [Google Scholar]
- 10. Goodarzi A. A., Jeggo P., Lobrich M. 2010. The influence of heterochromatin on DNA double strand break repair: getting the strong, silent type to relax. DNA Repair (Amst.) 9:1273–1282 [DOI] [PubMed] [Google Scholar]
- 11. Goodarzi A. A., Noon A. T., Jeggo P. A. 2009. The impact of heterochromatin on DSB repair. Biochem. Soc. Trans. 37:569–576 [DOI] [PubMed] [Google Scholar]
- 12. Groner A. C., et al. 2010. KRAB-zinc finger proteins and KAP1 can mediate long-range transcriptional repression through heterochromatin spreading. PLoS Genet. 6:e1000869. [DOI] [PMC free article] [PubMed] [Google Scholar]
- 13. Huang D. W., Sherman B. T., Lempicki R. A. 2009. Systematic and integrative analysis of large gene lists using DAVID bioinformatics resources. Nat. Protoc. 4:44–57 [DOI] [PubMed] [Google Scholar]
- 14. Ivanov A. V., et al. 2007. PHD domain-mediated E3 ligase activity directs intramolecular sumoylation of an adjacent bromodomain required for gene silencing. Mol. Cell 28:823–837 [DOI] [PMC free article] [PubMed] [Google Scholar]
- 15. Jin V., Apostolos J., Nagisetty N. S., Farnham P. J. 2009. W-ChIPMotifs: a web application tool for de novo motif discovery from ChIP-based high throughput data. Bioinformatics 25:3191–3193 [DOI] [PMC free article] [PubMed] [Google Scholar]
- 16. Jin V. X., O'Geen H., Iyengar S., Green R., Farnham P. J. 2007. Identification of an OCT4 and SRY regulatory module using integrated computational and experimental genomics approaches. Genome Res. 17:807–817 [DOI] [PMC free article] [PubMed] [Google Scholar]
- 17. Jothi R., Cuddapah S., Barski A., Cui K., Zhao K. 2008. Genome-wide identification of in vivo protein-DNA binding sites from ChIP-seq data. Nucleic Acids Res. 36:5221–5231 [DOI] [PMC free article] [PubMed] [Google Scholar]
- 18. Nielsen A. L., et al. 1999. Interaction with members of the heterochromatin protein 1 (HP1) family and histone deacetylation are differentially involved in transcriptional silencing by members of the TIF1 family. EMBO J. 18:6385–6395 [DOI] [PMC free article] [PubMed] [Google Scholar]
- 19. O'Geen H., et al. 2007. Genome-wide analysis of KAP1 binding suggests autoregulation of KRAB-ZNFs. PLoS Genet. 3:e89. [DOI] [PMC free article] [PubMed] [Google Scholar]
- 20. Peng H., et al. 2000. Biochemical analysis of the Krüppel-associated box (KRAB) transcriptional repression domain. J. Biol. Chem. 275:18000–18010 [DOI] [PubMed] [Google Scholar]
- 21. Peng H., et al. 2000. Reconstitution of the KRAB-KAP-1 repressor complex: a model system for defining the molecular anatomy of RING-B box-coiled-coil domain-mediated protein-protein interactions. J. Mol. Biol. 295:1139–1162 [DOI] [PubMed] [Google Scholar]
- 22. Peng H., Ivanov A. V., Oh H. J., Lau Y. F., Rauscher F. J., III 2009. Epigenetic gene silencing by the SRY protein is mediated by a KRAB-O protein that recruits the KAP1 co-repressor machinery. J. Biol. Chem. 284:35670–35680 [DOI] [PMC free article] [PubMed] [Google Scholar]
- 23. Rambaud J., Desroches J., Balsalobre A., Drouin J. 2009. TIF1beta/KAP-1 is a coactivator of the orphan nuclear receptor NGFI-B/Nur77. J. Biol. Chem. 284:14147–14156 [DOI] [PMC free article] [PubMed] [Google Scholar]
- 24. Robertson G., et al. 2007. Genome-wide profiles of STAT1 DNA association using chromatin immunoprecipitation and massively parallel sequencing. Nat. Methods 4:1–7 [DOI] [PubMed] [Google Scholar]
- 25. Rowe H. M., et al. 2010. KAP1 controls endogenous retroviruses in embryonic stem cells. Nature 463:237–240 [DOI] [PubMed] [Google Scholar]
- 26. Ryan R. F., et al. 1999. KAP-1 corepressor protein interacts and colocalizes with heterochromatic and euchromatic HP1 proteins: a potential role for Krüppel-associated box-zinc finger proteins in heterochromatin-mediated gene silencing. Mol. Cell. Biol. 19:4366–4378 [DOI] [PMC free article] [PubMed] [Google Scholar]
- 27. Schultz D. C., Ayyanathan K., Negorev D., Maul G. G., Rauscher III F. J. 2002. SETDB1: a novel KAP-1-associated histone H3, lysine 9-specific methyltransferase that contributes to HP1-mediated silencing of euchromatic genes by KRAB zinc-finger proteins. Genes Dev. 16:919–932 [DOI] [PMC free article] [PubMed] [Google Scholar]
- 28. Schultz D. C., Friedman J. R., Rauscher III F. J. 2001. Targeting histone deacetylase complexes via KRAB-zinc finger proteins: the PHD and bromodomains of KAP-1 form a cooperative unit that recruits a novel isoform of the Mi-2alpha subunit of NuRD. Genes Dev. 15:428–443 [DOI] [PMC free article] [PubMed] [Google Scholar]
- 29. Shannon M., Hamilton A. T., Gordon L., Branscomb E., Stubbs L. 2003. Differential expansion of zinc-finger transcription factor loci in homologous human and mouse gene clusters. Genome Res. 13:1097–1110 [DOI] [PMC free article] [PubMed] [Google Scholar]
- 30. Sripathy S. P., Stevens J., Schultz D. C. 2006. The KAP1 corepressor functions to coordinate the assembly of de novo HP1-demarcated microenvironments of heterochromatin required for KRAB zinc finger protein-mediated transcriptional repression. Mol. Cell. Biol. 26:8623–8638 [DOI] [PMC free article] [PubMed] [Google Scholar]
- 31. Tadepally H., Burger G., Aubry M. 2008. Evolution of C2H2-zinc finger genes and subfamilies in mammals: species-specific duplication and loss of clusters, genes and effector domains. BMC Evol. Biol. 8:176. [DOI] [PMC free article] [PubMed] [Google Scholar]
- 32. Tsuruma R., et al. 2008. Physical and functional interactions between STAT3 and KAP1. Oncogene 27:3054–3059 [DOI] [PubMed] [Google Scholar]
- 33. Urrutia R. 2003. KRAB-containing zinc-finger repressor proteins. Genome Biol. 4:231. [DOI] [PMC free article] [PubMed] [Google Scholar]
- 34. Vogel M. J., et al. 2006. Human heterochromatin proteins form large domains containing KRAB-ZNF genes. Genome Res. 16:1493–1504 [DOI] [PMC free article] [PubMed] [Google Scholar]
- 35. Wang C., et al. 2005. MDM2 interaction with nuclear corepressor KAP1 contributes to p53 inactivation. EMBO J. 24:3279–3290 [DOI] [PMC free article] [PubMed] [Google Scholar]
- 36. Wang C., Rauscher III F. J., Cress W. D., Chen J. 2007. Regulation of E2F1 function by the nuclear corepressor KAP1. J. Biol. Chem. 282:29902–29909 [DOI] [PubMed] [Google Scholar]
- 37. White D. E., et al. 2006. KAP1, a novel substrate for PIKK family members, colocalizes with numerous damage response factors at DNA lesions. Cancer Res. 66:11594–11599 [DOI] [PubMed] [Google Scholar]
- 38. Xu X., et al. 2007. A comprehensive ChIP-chip analysis of E2F1, E2F4, and E2F6 in normal and tumor cells reveals interchangeable roles of E2F family members. Genome Res. 17:1550–1561 [DOI] [PMC free article] [PubMed] [Google Scholar]
- 39. Yokoe T., et al. 2010. KAP1 is associated with peritoneal carcinomatosis in gastric cancer. Ann. Surg. Oncol. 17:821–828 [DOI] [PubMed] [Google Scholar]
- 40. Ziv Y., et al. 2006. Chromatin relaxation in response to DNA double-strand breaks is modulated by a novel ATM- and KAP-1 dependent pathway. Nat. Cell Biol. 8:870–876 [DOI] [PubMed] [Google Scholar]
Associated Data
This section collects any data citations, data availability statements, or supplementary materials included in this article.


