Abstract
Squamous cell carcinoma antigen 1 (SCCA1) is a member of the serine protease inhibitor (serpin) family of proteins, whose target proteases include the cathepsins. Initially identified as a serological marker for advanced squamous cell carcinomas of the cervix, SCCA1 has also been found to be associated with other cancer types of epithelial or endodermal origins such as lung cancer, head and neck cancer, melanoma, and hepatocellular carcinoma. While the biological function of SCCA1 remains largely unclear, it is believed to limit cellular damage resulting from lysosomal cathepsin release. Here, we show that SCCA1 acts as a molecular switch that inhibits cell death induced by lysosomal injury resulting from DNA alkylating agents and hypotonic shock, whereas it promotes a caspase-8-mediated apoptosis in response to endoplasmic reticulum (ER) stress. In response to ER stress, SCCA1 blocks both lysosomal and proteasomal protein degradation pathways and enhances the interaction between sequestosome 1/p62 and caspase-8, which leads to the aggregation of intracellular caspase-8 and its subsequent cleavage and activation. Hence, on one hand, SCCA1 inhibits cell death induced by lysosomal injury while, on the other hand, it sensitizes cells to ER stress by activating caspase-8 independently of the death receptor apoptotic pathway.
INTRODUCTION
The mitochondrion is a well-studied organelle involved in apoptosis. In addition to mitochondria, other subcellular organelles such as the endoplasmic reticulum (ER) and lysosomes also play important roles in regulating cell death. Cell death initiated from lysosomes is thought to be largely mediated by cathepsins, a family of proteases that normally reside in lysosomes, where they help break down phagocytosed molecules to get rid of damaged proteins and to provide the cell with bioenergetic substrates and building blocks for de novo biosynthesis (41). Cathepsins are fully active in the acidic environment of lysosomes. A variety of signals can cause lysosomal damage and the translocation of cathepsins from the lysosomal lumen to the cytosol. These cytosolic cathepsins, although with less efficiency, can digest intracellular molecules not normally exposed to these proteases and, by doing so, induce cell death. Cellular insults such as DNA damage, oxidative stress, and calcium perturbations have been shown to compromise lysosomal membrane integrity, allowing the release of cathepsins and causing subsequent cell death (8–10, 36, 57). However, the molecular mechanisms responsible for lysosome-mediated cell death still remain elusive. While some evidence supports a cross talk between lysosomes and the mitochondrial apoptotic pathway, it is not entirely clear as to whether mitochondria are necessary for lysosome-mediated cell death. A wide variety of physiological and pathological stimuli have been shown to induce cell death via cytosolic acidification resulting from lysosome injury (1, 33, 54).
A class of proteins that suppress misplaced cathepsins are the endogenous protease inhibitors termed serpins (serine protease inhibitors). The subset of serpins responsible for inhibiting lysosomal proteases consists of members of the clade B serpins. Unlike other classes of serpins, the clade B serpins function intracellularly, inhibiting proteolysis by inhibiting both cysteine and serine proteases (49, 51, 55). All serpins utilize the same general mechanism of inhibition, which involves a domain located at the C terminus, known as the reactive site loop (RSL), acting as a bait for their protease targets. Upon irreversible binding of the serpin and its protease target, the serpin is cleaved, allowing it to undergo a conformational change that renders both the protease and the serpin inactive (22).
Among the clade B serpins, squamous cell carcinoma antigen 1 (SCCA1) is a human homolog of murine SerpinB3 (4). Unlike many other serine/cysteine protease inhibitors, such as plasminogen activator inhibitors (PAI) that function in the extracellular environment, SCCA1 localizes predominantly in the cytosol. However, SCCA1 can also be released into the extracellular environment via an unknown mechanism (55). While it is unclear whether extracellular SCCA1 has any biological function, its presence in serum has been utilized as a diagnostic/prognostic marker for certain squamous cell carcinomas. Initially, SCCA was discovered as a serological marker for advanced squamous cell tumors in the cervix (55) and was later found to be associated with other types of cancer with epithelial or endodermal origins, including lung cancer, head and neck cancer, melanomas, and hepatocellular carcinoma. We have recently found that elevated expression of SCCA1 is associated with high-grade breast carcinoma and correlates with estrogen receptor/progesterone receptor double negative tumors as well as with a poor prognosis for breast cancer patients (11).
The ability of SCCA1 to inhibit cathepsins suggests it likely plays a protective role in preventing cellular damage as a result of aberrant release of cathepsins from damaged lysosomes and thus may be important for allowing cancer cells to adapt to their environment as well as gain chemoresistance. Indeed, elevated SCCA1 expression in squamous cell carcinomas is associated with a poor prognosis and a poor response to treatment due to increased resistance to cell death (25, 50). Srp-6, an SCCA1 homolog in Caenorhabditis elegans, was reported to protect cells from necrosis induced by lysosomal injury caused by hypotonic shock, hypoxia, heat shock, and oxidative stress (29). In the present study, we attempted to examine the role of SCCA1 in response to lysosomal injury in a mammalian epithelial cell line and found that, indeed, it conferred cellular protection against DNA damage and hypotonic shock. However, unexpectedly, in response to stimuli that disrupt protein homeostasis such as ER stress, SCCA1 accelerated cell death. This finding unveils a novel approach for treating cancer cells with high levels of SCCA1.
MATERIALS AND METHODS
Cell lines, culture, and transfection.
BMK (baby mouse kidney) cells and Hs578T cells were cultured in DMEM supplemented with 10% fetal bovine serum (FBS), 2 mM l-glutamine, 100 units/ml penicillin, and 100 μg/ml streptomycin. MCF10A cells were cultured in Dulbecco's modified Eagle's medium-F12 (DMEM-F12) supplemented with 5% donor horse serum (Invitrogen), 20 ng/ml epidermal growth factor (EGF) (Sigma), 10 μg/ml insulin (Sigma), 0.5 μg/ml hydrocortisone (Sigma), 100 ng/ml cholera toxin (Sigma), 100 units/ml penicillin, and 100 μg/ml streptomycin. Transfection of BMK and Hs578T cells was performed using Lipofectamine 2000 (Invitrogen). Transfection of 293T and Phoenix cells was performed by calcium phosphate precipitation method.
Plasmids.
Flag-SCCA1 plasmid was constructed by performing reverse transcription-PCR (RT-PCR) from isolated RNA from MDA-MB-468 cells. The primers utilized in the PCR mixture contained a Flag tag at the N terminus as well as a BamHI restriction site and a C-terminal XhoI restriction site (forward primer, 5′-CGGGATCCATGGACTACAAGGACGACGATGACAAGACCATGAATTCACTCAGTGAAGCC-3′; reverse primer, 5′-CCCTCGAGCATCTACGGGGATGAGAATCTGCCA-3′). The PCR product was ligated into pCR2.1-TOPO (Invitrogen). Flag-SCCA1 was then subcloned into the retroviral vector LPC (long terminal repeat-puromycin-cytomegalovirus) between BamHI and XhoI sites. Flag-SerpinB3b was constructed in a similar manner using total RNA isolated from mouse embryonic fibroblasts (MEFs). The primers utilized contained an N-terminal Flag tag and BamHI restriction site as well as a C-terminal XhoI restriction site (forward primer, 5′-CGGGATCCATGGACTACAAGGACGACGATGACAAGACCATGATTCGTTTTCATGCAGCT-3′; reverse primer, 5′-CCCTCGAGGAAACATGTTTCCAGGCCTCAATT-3′). Site-directed mutagenesis was utilized to generate point mutants for SCCA1 and SerpinB3b. For knockdown of caspase 8, a lentiviral short hairpin RNA (shRNA) plasmid was purchased from Sigma (NM_001228.x-377s1c1). For knockdown of SCCA1, a lentiviral shRNA plasmid was purchased from Sigma (NM_006919.1-1113s1c1). For construction of the tetracycline-inducible shRNA directed at SCCA1 (shSCCA1), the shRNA sequence from the lentiviral shRNA plasmid designed by Sigma was ligated into the pLKO-Tet-On plasmid (where Tet is tetracycline) (59). A luciferase plasmid expressing ubiquitin-luciferase (Ub-FL) utilized to monitor proteasomal protein degradation was a gift from David Piwnica-Worms (30). Green fluorescent protein (GFP)-LC3 constructs were described previously (56). Monomeric Cherry (mCherry)-GFP-LC3 was a gift from Terje Johanson (35).
Reagents and antibodies.
DMEM, valine-free DMEM, F-12, cathepsin L substrate (R6502), and LysoTracker Red were purchased from Invitrogen. Cholera toxin, human EGF, hydrocortisone, insulin, MG132, cycloheximide, N-methyl-N′-nitro-N-nitrosoguanidine (MNNG), and pepstatin A (PepA; used at 10 μg/ml) were purchased from Sigma; tunicamycin, E64D (10 μg/ml), a caspase-8 detection kit (fluorescein isothiocyanate-IETD-fluoromethyl ketone [FITC-IETD-FMK]), and thapsigargin were from Calbiochem; [14C]valine was from Amersham. A Dual Luciferase Reporter Assay System was purchased from Promega. Boc-Leu-Arg-Arg-AMC ([7-amino-4-methylcoumarin] Boc-LRR-AMC), for measuring proteasome trypsin-like activity, and Z-Gly-Gly-Leu-AMC (Z-GGL-AMC), for measuring chymotryptic-like activity, were purchased from BioMol. Propidium iodide (PI) was purchased from Molecular Probes. Mafosfamide (4-sulfoethylthio-cyclophosphamide l-lysine) was a gift from Myriam Malet-Martino at Université Paul Sabatier, France.
The following antibodies were used: SCCA1/2 (FL-390) (1:1,000; Santa Cruz), β-tubulin (1:2,000; Sigma), Flag (1:2,000; M2; Sigma), Bip/GRP78 (1:2,000; BD Transduction Laboratories), CHOP/GADD153 (1:500; B3; Santa Cruz), caspase-8 (1:2,000 for Western blotting [WB; R&D Systems],1:100 for immunofluorescence [IF; Alexis Biochemical], and 1 μg/ml for immunoprecipitation [IP; Millipore]), cytochrome c (1:500 for IF [Pharmingen International 65971A] and 1:1,000 for WB [Pharmingen International 65981A]), cleaved caspase-3 (1:1,000; Cell Signaling), Tom40 (1:1,000; H-300; Santa Cruz), poly(ADP-ribose) polymerase ([PARP] 1:2,000; Cell Signaling), p62/SQSTM1 (1:100,000 for WB and 1:1,000 for IF; Abnova), LC3 (1:500 [Cell Signaling Technology] or 1:1,000 [MBL]), ubiquitin (1:10,000; FK2H; BioMol), Mcl-1 (1:1,000; Rockland Inc.), caspase 2 (1:500; MAB3507; Millipore), lamin B1 (1:1,000; M-20; Santa Cruz,), peroxidase-conjugated secondary antibodies (1:2,000; Rockland), rhodamine-conjugated secondary antibodies (1:500; Rockland), and fluorescein-conjugated secondary antibodies (1:250; Rockland).
Retroviral and lentiviral infection.
Retrovirus infection was performed as previously described (56). 293T cells (used for murine cell infections) or Phoenix cells (for human cell infections) were plated into six-well plates at a density of 4 × 10⁵. The following day cells were transfected with LPC retroviral constructs; additionally, helper virus was added to murine transfections. At 24 h posttransfection viral supernatant was collected from 293T or Phoenix cells, 10 μg/ml of Polybrene (Sigma) was added, and subsequently the supernatant was filtered through a 0.45-μm-pore-size filter. The infection was performed in three rounds at an 8-h interval. Three days after the initial infection, cells were selected with puromycin (InvivoGen). For lentiviral infections 293T cells were transfected with lentiviral constructs and packaging plasmids, and the infection was performed similarly to retroviral infections. For expression of the lentiviral tetracycline-inducible shSCCA1, doxycycline (1 μg/ml) was added for 7 days prior to treatment.
LysoTracker Red and cathepsin L activity.
For measurement of LysoTracker Red staining and cathepsin L activity, 5 × 10⁴ cells were plated in 12-well plates. Upon treatment, cell culture medium containing floating cells was collected and combined with the remaining adherent cells that were harvested by trypsinization. Cells were pelleted and for LysoTracker Red activity resuspended in 1 ml of DMEM containing 50 nM LysoTracker Red; for cathepsin L activity cells were resuspended in 1 ml of Hanks buffered saline (HBS) containing 2 mM EDTA and 10 μM cathepsin L substrate. After 30 min of incubation, cells were analyzed using a FACSCalibur using the FL-3 channel for LysoTracker Red and the FL-2 channel for cathepsin activity.
Cell death determination.
For analysis of cell death with MNNG treatment, cells were treated with MNNG for 30 min. Cells were washed and fed with fresh medium with no MNNG and cultured for the periods of time indicated in the figure legends. For hypotonic shock, mafosfamide, tunicamycin, and thapsigargin treatment, the agents remained in the medium. Both floating and adherent cells were collected, and propidium iodide was added at a concentration of 1 μg/ml. Cell death was determined using flow cytometry by PI exclusion.
Immunoblotting.
Cells were lysed in radioimmunoprecipitation assay (RIPA) buffer (1% sodium deoxycholine, 0.1% SDS, 1% Triton X-100, 10 mM Tris at pH 8.0, 0.14 M NaCl) with protease inhibitor cocktail (Roche). Thirty micrograms of protein was resolved by SDS-PAGE and transferred to nitrocellulose membranes. Densitometric analysis of the immunoblotting bands was performed using Image J.
Subcellular fractionation.
Subcellular fractionation was performed as previously described with modification (62). Briefly, cells were collected via trypsinization, pelleted, and resuspended in hypotonic buffer (250 mM sucrose, 20 mM HEPES, pH 7.5, 10 mM KCl, 1.5 mM MgCl2, 1 mM EDTA, 1 mM EGTA, 1× protease inhibitor cocktail) on ice for 30 min. Cells were disrupted by passage through 26-gauge needles 30 times and then through 30-gauge needles 20 times. Cell lysates were centrifuged at 750 × g for 10 min at 4°C to get rid of unlysed cells and nuclei. The supernatant was centrifuged at 18,000 × g for 1 h at 4°C. The supernatant was saved as the cytosolic fraction, and the pellet was saved as the mitochondrial fraction. The mitochondrial fraction was lysed in RIPA buffer for Western blotting.
Immunofluorescence.
Cells were plated onto glass coverslips in 24-well plates prior to treatment. After treatment cells were fixed in 4% paraformaldehyde (PFA) in phosphate-buffered saline (PBS) for 20 min at room temperature. For LysoTracker Red staining and caspase-8 activity assay, prior to fixing cells, 0.1 μM LysoTracker Red or 1 μl of FITC-IETD-FMK was added for 1 h; subsequently, cells were washed three times with PBS. After fixation, cells were permeabilized in 0.1% Triton in PBS for 3 min and then blocked in 5% goat serum in PBS, followed by incubation with primary antibody in blocking solution for 2 h at room temperature. Cells were then incubated with fluorophore-conjugated secondary antibodies in blocking solution for 1 h. DAPI (4′,6′-diamidino-2-phenylindole; 1 μg/ml) was added to visualize the nucleus. Cells were mounted with Immu-Mount (Thermo Scientific). Slides were observed and imaged using a Zeiss Axiovert 200 M deconvolution fluorescence microscope, using a 63× oil objective.
Measurement of long-lived protein degradation.
BMK cells (5 × 10⁴) were plated into six-well plates. After overnight recovery, cells were labeled with 1.0 μCi/ml l-[14C]valine in valine-free medium. At 48 h postlabeling, cells were washed three times with PBS and incubated in complete medium containing an excess of 10 mM unlabeled l-valine for 16 h to chase out short-lived proteins. Cells were then washed three times with PBS and cultured in either complete medium alone or medium containing tunicamycin (0.5 μg/ml), with both media containing 10 mM unlabeled l-valine. The supernatant was removed 24 h later and precipitated with ice-cold trichloroacetic acid (TCA) at a final concentration of 10%. Cells were washed three times with PBS, lysed in 0.05% SDS, and then subsequently precipitated with TCA at a final concentration of 10%. TCA-insoluble pellets were dissolved in 0.2 N NaOH. Radioactivity of both TCA-soluble and -insoluble samples was measured by a liquid scintillation counter. The degradation of long-lived proteins was calculated by the radioactivity in TCA-soluble supernatant normalized against the total 14C radioactivity present in supernatants and cell pellets.
Measurement of proteasome activity.
For measuring proteasome-mediated protein degradation, BMK cells (2.5 × 10⁴) or Hs578T cells (5 × 10³) were plated into 24-well plates. After overnight recovery, cells were transiently transfected, using Lipofectamine 2000, with a Renilla control plasmid and a ubiquitin-luciferase bioluminescence imaging reporter (Ub-FL) (30). After 5 h the transfection medium was changed to regular medium, and 16 h later cells were left untreated or treated with the proteasome inhibitor bortezomib (Velcade; 2 μM) or MG132 (0.5 μM) for 8 h. Cell lysates were made following the manufacturer's instructions for passive lysis (Dual-Luciferase Reporter Assay System; Promega), and luminescence was measured in a 96-well white plate.
For measuring chymotrypsin and trypsin-like activity of the 26S proteasome, BMK cells (5 × 10⁶) were plated into 10-cm plates and allowed to recover overnight. Cells were left untreated or treated with the proteasome inhibitor bortezomib (2 μM) for 8 h; subsequently, medium was removed from the cells, and 1 ml of proteasome extraction/lysis buffer (10 mM Tris-HCl, pH 7.8, 5 mM ATP, 0.5 mM dithiothreitol, 5 mM MgCl2) was added directly to 10-cm plates. The cell lysate was collected, incubated on ice for 15 min, sonicated for 15 s, and centrifuged at 400 × g for 10 min at 4°C. Fifty micrograms of the supernatant was incubated with 50 mM EDTA and 50 μM fluorogenic substrate (Z-Gly-Gly-Leu-AMC for chymotrypsin-like activity and Boc-Leu-Arg-Arg-AMC for trypsin-like activity) and brought to a volume of 200 μl with the proteasome extraction/lysis buffer. The reaction mixture was added to a 96-well black plate that was incubated at 37°C for 30 min, and fluorescence was measured at an excitation of 395 nm and emission of 460 nm, using a Spectra Max M5 plate reader (Molecular Devices).
Measurement of caspase-8 activity.
BMK cells (3 × 10⁵) were plated into six-well plates and after overnight recovery were left untreated or treated for 24 h with tunicamycin. Floating and adherent cells were collected via trypsinization and centrifuged at 3,000 rpm for 5 min; cells were then resuspended in 1 ml of medium, 300 μl was subsequently removed, and 1 μl of FITC-IETD-FMK (caspase-8 detection kit; Calbiochem) was added. After 1 h of incubation at 37°C, cells were centrifuged at 3,000 rpm for 5 min. Supernatant was removed, and cells were washed twice with 0.5 ml of supplied wash buffer. Analysis was performed by flow cytometry.
GFP-LC3 punctum observation and quantitation.
Quantitation of GFP-LC3 was performed as previously described (56). Briefly, cells expressing GFP-LC3 were plated into 24-well plates containing coverglass slides, subsequently treated with tunicamycin, and then fixed in 4% PFA in PBS. After slides were mounted, they were viewed under a Zeiss Axiovert 200 M deconvolution fluorescence microscope, using a 63× oil objective. A total of 100 to 200 cells were randomly selected and counted for autophagy induction. Cells containing more than eight puncta were considered autophagic.
Venus assay.
Bimolecular fluorescence complementation (BiFC) constructs were made such that DNA sequences encoding amino acid residues 1 to 173 of monomeric Venus fluorescent protein (mVenus) (44) or DNA sequences encoding amino acid residues 155 to 239 of mVenus were fused to the C terminus of caspase-8. A linker, GGSGSGSS, was inserted between the Venus tag and caspase-8. Venus and linker sequences were provided kindly by Michael A. Frohman (Stony Brook University). This BiFC pair of caspase-8 constructs was subsequently transfected into BMK cells with Lipofectamine 2000. At 24 h posttransfection, cells (1 × 10⁵) were plated into six-well plates. After overnight recovery cells were treated for 16 h with tunicamycin and harvested, and the percentage of cells that fluoresced green was determined by flow cytometry.
Size exclusion chromatography.
BMK cells (5 × 10⁶) were plated into six 10-cm plates. After overnight recovery, three plates were treated for 16 h with tunicamycin, and three were left untreated. Cells were then harvested and lysed in IP lysis buffer (30 mM Tris, pH 7.5, 150 mM NaCl, 10% glycerol, 1% Triton X-100, 10 mM NaF, 100 μM orthovanadate, 200 μM phenylmethylsulfonyl fluoride [PMSF]) supplemented with protease inhibitor cocktail (Biosciences). Cell lysates were cleared by centrifugation at 4°C at top speed and filtered through 0.45-μm-pore-size filters. Three milligrams of the cleared lysate was loaded onto a Superdex 200 10/300 GL column equilibrated with washing buffer (30 mM Tris, pH 7.5, 150 mM NaCl), subsequently eluted with washing buffer at a flow speed of 0.5 ml/min, and collected in 0.5-ml volumes, with the first sample being collected at 7.5 min.
Caspase-8 activity assay.
Thirty microliters of the eluted fractions from size exclusion chromatography was assayed for caspase-8 activity using a Caspase-Glo 8 assay kit (Promega), which uses a luminogenic caspase-8 substrate. The luciferase activity values were read using a luminescence plate reader (Spectramax; Molecular Devices), according to the manufacturer's instruction.
His-Ub assay for mammalian cells.
A total of 3 × 10⁶ cells were plated into three 10-cm culture dishes. After overnight recovery, the cells were transfected using Lipofectamine 2000, with 2 μg of pMT107 plasmid, which expresses polyhistidine-tagged Ub (His-Ub) (a kind gift from Erich R. Mackow, Stony Brook University). At 24 h posttransfection all cells were harvested, mixed, and replated. After overnight recovery, cells were treated with tunicamycin (5 μg/ml). After treatment, the cells were collected, washed twice with phosphate-buffered saline (PBS), and resuspended in 1 ml of buffer A (6 M guanidine-HCl, 0.1 M Na2HPO4/NaH2PO4, 10 mM imidazole, pH 8.0). After a 10-s sonication, each sample was incubated with 50 μl of Ni-nitrilotriacetic acid (NTA)-agarose (Qiagen) equilibrated with buffer A and incubated for 3 h at room temperature with agitation. The agarose was precipitated by centrifugation and washed twice with buffer B (10 mM Tris-Cl, pH 8.0, 8 M urea, 0.1 M NaH2PO4) and three times with 1:4 diluted buffer B. The precipitates were resuspended in 100 μl of 2× Laemmli loading dye (4% SDS, 20% glycerol, 10% 2-mercaptoethanol, 0.004% bromphenol blue, 0.125 M Tris-HCl, pH 6.8) with 200 mM imidazole, boiled at 95°C for 10 min, and subjected to Western blotting.
Coimmunoprecipitation.
HS578T and HS578T-SCCA cells (3 × 10⁶) were plated into four 10-cm dishes, with two for untreated and two for treated cells. After overnight recovery, cells were treated and harvested via trypsinization, pelleted, washed twice with PBS, and lysed for 30 min in IP lysis buffer (30 mM Tris, pH 7.5, 150 mM NaCl, 10% glycerol, 1% Triton X-100, 10 mM NaF, 100 μM orthovanadate, 200 μM PMSF) supplemented with protease inhibitor cocktail (Biosciences). The cell lysates were cleared by centrifugation at 4°C. Subsequently, cell lysates were precleaned with protein A/G-agarose (Roche) beads and incubated with an anti-caspase-8 antibody and protein A/G overnight at 4°C, with rotation. The complexes were precipitated by a brief spin, washed three times with IP lysis buffer with 500 mM NaCl and twice with IP lysis buffer, and boiled in 2× SDS sample buffer at 95°C for 5 min.
Statistical analysis.
Data were expressed as average ± standard deviation (SD). A Student's t test was used to compare the differences between two groups. For comparison between more than two groups, one-way analysis of variance (ANOVA) with Tukey's posthoc test was used. Significance was determined as a P value of <0.05.
RESULTS
SCCA1 inhibits cell death induced by lysosomal injury.
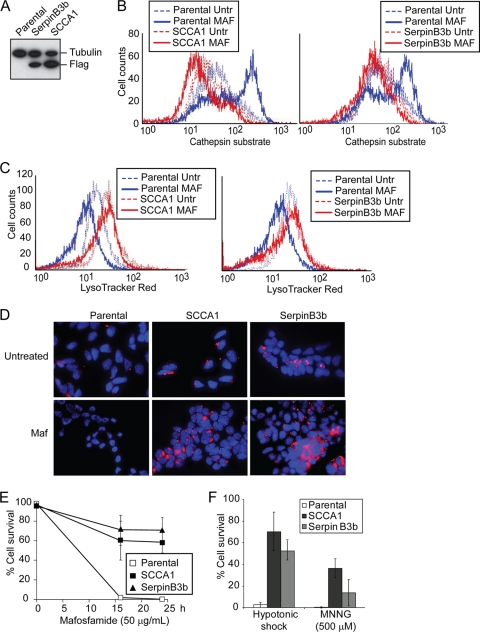
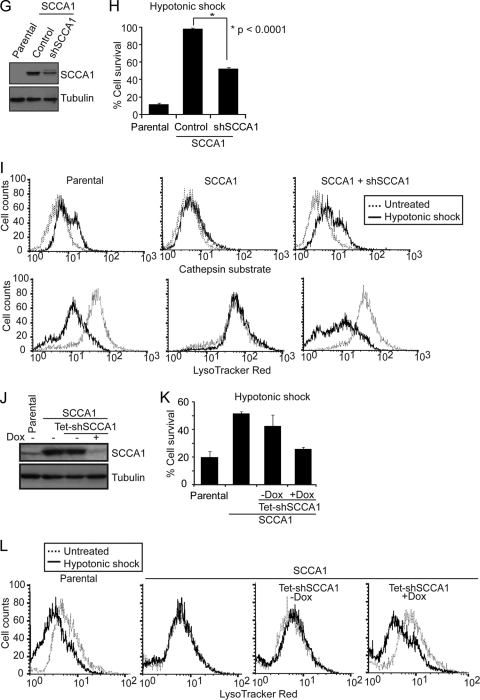
Previous studies have indicated that several intracellular serpins are capable of inhibiting lysosomal cysteine peptidases such as cathepsin K, L, S, and V (49, 51). Srp-6, an SCCA1 homolog in C. elegans, protects cells from necrosis induced by lysosomal injury caused by hypotonic stress, hypoxia, heat shock, and oxidative stress (29). Many of these stress conditions are often encountered by cancer cells during tumor development and anticancer therapy. We expressed Flag-tagged SCCA1 and its mouse homolog SerpinB3b in bax−/− bak−/− baby mouse kidney (BMK) cells (14) to examine whether SCCA1 can block necrotic cell death induced by lysosomal injury resulting from DNA alkylating damage or hypotonic shock (Fig. 1A) (18, 29, 61). The use of bax−/− bak−/− cells facilitates the study of alternative death pathways in cells with compromised mitochondrial apoptotic machinery, which is a main feature of cancer cells (13, 58, 63). During lysosomal injury, cathepsins are released into the cytosol and can be detected by a fluorogenic substrate specific for activated cathepsin L. While the DNA alkylating agent mafosfamide and hypotonic shock induced cytosolic cathepsin activity in parental cells, indicating lysosomal injury, SCCA1 and SerpinB3b blocked this cathepsin activation (Fig. 1B; see also Fig. 3C). The activation of cathepsin L correlated with a loss of lysosomal integrity in parental cells, indicated by the decrease in LysoTracker Red staining (Fig. 1C and D). However, expression of SCCA1 or SerpinB3b resulted in larger lysosomes, whose integrity was preserved in response to mafosfamide treatment (Fig. 1C and D). Accordingly, cell death induced by mafosfamide, as well as by another DNA alkylating agent, MNNG, and hypotonic shock was suppressed by SCCA1 or SerpinB3b (Fig. 1E and F). This is consistent with our previous finding that necrosis can be induced by these types of cellular damage (61) and the report showing that serpin can inhibit necrosis caused by lysosomal injury (29). To verify that the protection against lysosomal injury is specifically conferred by SCCA1, bax−/− bak−/− BMK cells ectopically expressing SCCA1 were infected with lentiviral SCCA1 shRNA to knock down its expression (Fig. 1G). Indeed, knockdown of SCCA1 resensitized cells to lysosomal injury, indicated by decreased cell survival (Fig. 1H), increased cathepsin L activation, and decreased LysoTracker Red staining (Fig. 1I) in response to hypotonic shock. The ability of SCCA1 to block lysosomal injury and cell death was not restricted to apoptosis-deficient cells as the same effect was observed in apoptosis-competent MCF10A (Fig. 1J to L) and Hs578T cells (data not shown). The resensitization to lysosomal injury was also observed in apoptosis-competent MCF10A cells using a tetracycline-inducible knockdown of ectopically expressed SCCA1 (Fig. 1J to L). Taken together, these results indicate that SCCA1 and SerpinB3b are able to protect cells from stimuli that induce lysosomal membrane permeabilization and necrosis.
Fig. 1.
SCCA1 inhibits cell death induced by lysosomal injury. (A) bax−/− bak−/− BMK cells were stably transfected with either Flag-tagged human SCCA1 or its mouse paralog, SerpinB3b. Protein expression was confirmed by immunoblotting using an anti-Flag antibody. (B and C) Cells were treated with mafosfamide (MAF; 50 μg/ml) for 6 h, stained with either a fluorogenic cathepsin L substrate (B) or with LysoTracker Red (C) and then analyzed via flow cytometry. (D) Cells were treated with mafosfamide for 16 h and stained with LysoTracker Red and DAPI. (E and F) Cells were treated with mafosfamide for indicated periods of time (E) or with MNNG or hypotonic shock for 16 h (F). Cell death was measured by PI exclusion. (G) bax−/− bak−/− BMK cells expressing Flag-SCCA1 were infected with either a control lentiviral shRNA or one targeting SCCA1. SCCA1 knockdown was confirmed by immunoblotting. (H) Parental or Flag-SCCA1 cells expressing a control shRNA or shSCCA1 were treated with hypotonic shock for 16 h. Cell death was measured by PI exclusion. (I) Cells were also analyzed for cathepsin activity and LysoTracker Red staining following a 6-h treatment of hypotonic shock. (J) MCF10A cells overexpressing SCCA1 were infected with a tetracycline (Tet)-inducible shSCCA1. Addition of doxycycline (Dox) for 3 days led to decreased SCCA1 expression in these cells. (K) The MCF10A cells were treated with hypotonic shock for 16 h, and cell death was measured by PI exclusion. (L) Lysosomal presence was determined by staining cells with LysoTracker Red following treatment with hypotonic shock for 4 h. Untr, untreated.
Fig. 3.
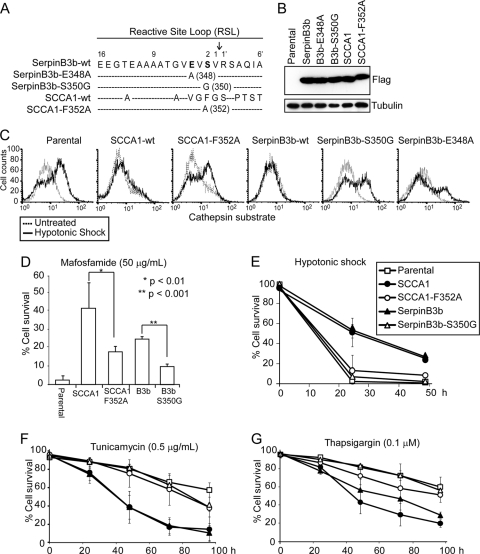
SCCA1's ability to enhance ER stress-induced cell death requires its protease-inhibitory activity. (A) Diagram of the location of point mutations made within the reactive site loop of SCCA1 and SerpinB3b. The numbering indicates the position of residues within the reactive site loop, and the arrow indicates the protease cleavage site. (B) Immunoblot of bax−/− bak−/− BMK cells stably expressing Flag-tagged wild-type (wt) and mutant SCCA1 and SerpinB3b. (C) Indicated cells were treated with hypotonic shock for 6 h and then incubated with a fluorogenic cathepsin L substrate. Cathepsin L activity was determined by flow cytometry. (D to G) Parental cells or cells expressing the indicated proteins were treated with mafosfamide for 36 h (D), hypotonic shock (E), tunicamycin (F), or thapsigargin (G) for the indicated amount of time. Cell death was measured by PI exclusion.
SCCA1 enhances ER stress-induced cell death.
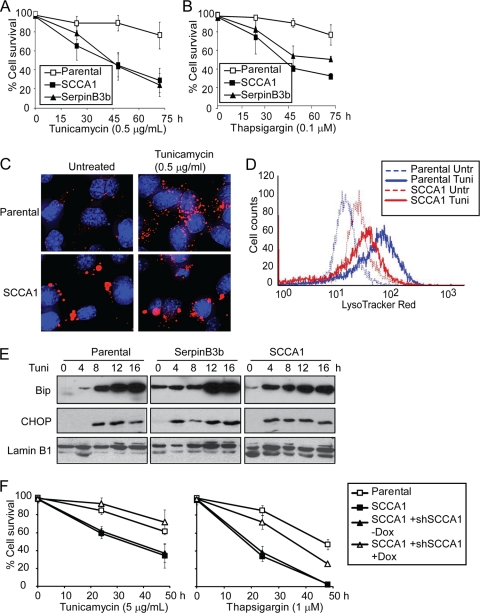
In addition to hypotonic shock and DNA alkylating damage, bax−/− bak−/− BMK cells expressing either SCCA1 or SerpinB3b were treated with the ER stress inducers tunicamycin, an inhibitor of N-linked glycosylation, and thapsigargin, an inhibitor of the sarcoplasmic/endoplasmic reticulum Ca2+ ATPase (SERCA) calcium pump. Surprisingly, unlike the protective effect of SCCA1 and SerpinB3b in cells treated with DNA alkylating damage and hypotonic shock, they markedly enhanced cell death induced by ER stress in bax−/− bak−/− BMK cells (Fig. 2A and B). The enhanced cell death in serpin-expressing cells correlates with their inability to efficiently degrade lysosomal content, indicated by both the enlarged size of their lysosomes as well as their inhibition of cathepsin activity upon ER stress treatment (Fig. 1B to D and 2C and D). Additionally, while ER stress markedly enhanced lysosomal presence in parental cells, this was not observed in SCCA1-expressing cells, further suggesting that their ability to cope with ER stress is compromised (Fig. 2C and D). Consistent with the compromised lysosomal degradation, there was a higher steady-state level of unfolded protein response (UPR), as shown by elevated levels of GRP78/Bip in SCCA1 and SerpinB3b-expressing cells (Fig. 2E). Both GRP78/Bip and GADD153/CHOP inductions took place earlier in these cells (Fig. 2E), indicating that the cells may attempt to upregulate the chaperon/UPR machinery as SCCA1 inhibits lysosomal protein degradation. The prodeath effect of SCCA1 and SerpinB3b is not limited to bax−/− bak−/− BMK cells as it was also found to promote cell death in MCF10A cells in response to ER stress (Fig. 1F).
Fig. 2.
SCCA1 enhances ER stress-induced cell death. (A and B) Parental bax−/− bak−/− BMK cells or those expressing Flag-SCCA1 or Flag-SerpinB3b were treated with tunicamycin (A) or thapsigargin (B). Cell death was measured by PI exclusion. (C and D) Cells were left untreated or treated with tunicamycin for 16 h. Cells were stained with LysoTracker Red and DAPI. Cells were photographed (C) or subjected to flow cytometry (D). (E) Cells were treated with tunicamycin for the indicated times. The ER stress response was examined by immunoblotting with indicated antibodies. (F) MCF10A parental cells, SCCA1-expressing cells, and SCCA1-expressing cells containing a Tet-inducible shSCCA1 either left untreated or treated with doxycycline (Dox) for 3 days were treated with either tunicamycin or thapsigargin. Cell death was measured by PI exclusion.
SCCA1's ability to enhance ER stress-induced cell death requires its protease-inhibitory activity.
Essential to serpin's protease-inhibitory activity is its reactive site loop (RSL), which is the domain responsible for binding to their protease target. In order to determine whether the death-promoting effects of SCCA1 and SerpinB3b depend on their ability to inhibit proteases, mutants were constructed which harbored a point mutation within the RSL (Fig. 3A). The SCCA1 with the mutation F352A (SCCA1-F352A) has been previously described to have impaired protease-inhibitory activity (28). Moreover, we generated two SerpinB3b mutants, SerpinB3b-E348A and SerpinB3b-S350G. These mutant proteins were expressed at similar levels as their wild-type counterparts (Fig. 3B). All three mutants had impaired ability to inhibit cathepsin L activity in response to hypotonic shock (Fig. 3C). We then used SCCA1-F352A and SerpinB3b-S350G for subsequent experiments. As a correlative to their impaired ability to inhibit cathepsins, both mutants failed to prevent cell death as efficiently as the wild-type SCCA1 or SerpinB3b in response to mafosfamide and hypotonic shock (Fig. 3D and E). Conversely, these mutants failed to enhance cell death in response to ER stress (Fig. 3F and G). These results indicate that the protease-inhibitory activity of serpins is essential for their ability to protect cells from lysosomal injury and to enhance ER stress-induced cell death. The failure of SCCA1-F352A and SerpinB3b-S350G mutants to enhance ER stress-induced cell death also indicates that the enhanced death in cells expressing wild-type SCCA1 and SerpinB3b was not merely caused by protein overexpression.
SCCA1 promotes apoptosis in response to ER stress independently of the mitochondrial apoptotic pathway.
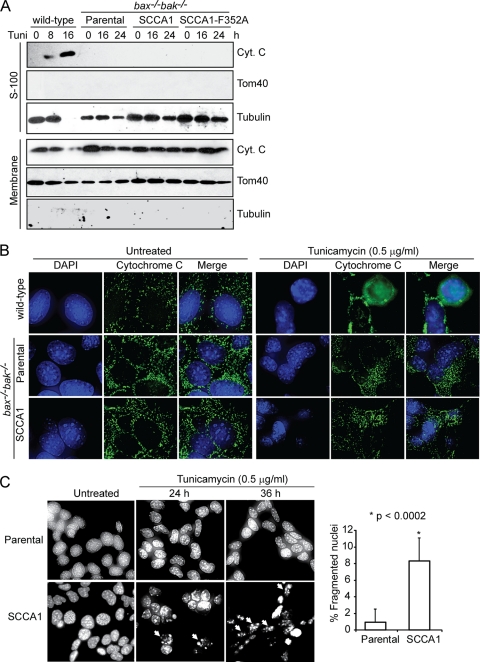
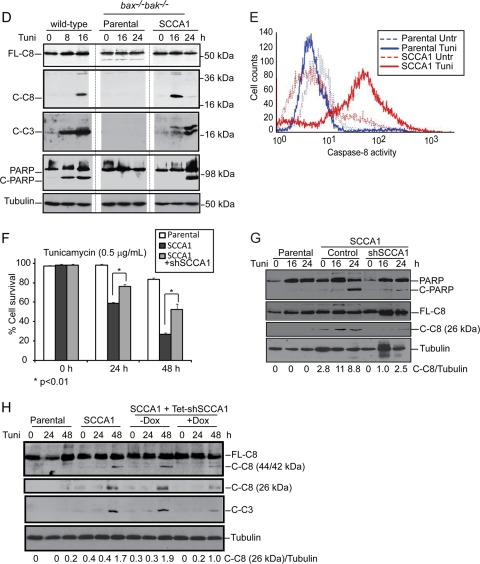
Cell death induced by ER stress is by and large attributed to mitochondrion-dependent apoptosis (19). As Bax and Bak play essential roles in mitochondrial apoptosis, our finding that SCCA1 and SerpinB3b promote cell death in bax−/− bak−/− BMK cells indicates a form of cell death that is independent of the mitochondrial apoptotic pathway. Indeed, while treatment of wild-type cells with tunicamycin led to cytochrome c release from mitochondria, SCCA1-expressing bax−/− bak−/− BMK cells failed to release cytochrome c as shown by both subcellular fractionation and immunofluorescence (Fig. 4A and B). However, DAPI staining in SCCA1 cells following tunicamycin treatment revealed an increase in apoptotic nuclear condensation and fragmentation, a process that occurs as a result of caspase activation, suggesting a caspase-mediated apoptosis in these bax−/− bak−/− BMK cells (Fig. 4C). We then examined caspase activation in bax−/− bak−/− BMK cells ectopically expressing SCCA1, using wild-type cells proficient in mitochondrial apoptosis as a control. As expected, apoptosis-competent wild-type cells treated with tunicamycin showed apoptotic cleavage of caspase-3, PARP, and caspase-8. While these apoptotic events were not observed in bax−/− bak−/− BMK parental cells, SCCA1-expressing bax−/− bak−/− BMK cells were observed to have cleaved caspase-8 after 16 h of treatment followed by both caspase-3 and PARP cleavage (Fig. 4D). A fluorometric caspase-8 activity assay revealed that while tunicamycin treatment induced little caspase-8 activation in the parental bax−/− bak−/− BMK cells, it greatly induced caspase-8 activation in SCCA1-expressing bax−/− bak−/− BMK cells after tunicamycin treatment for 16 h (Fig. 4E). SCCA1's ability to promote caspase-8 cleavage was not a process confined to cells lacking Bax and Bak as apoptosis-competent MCF10A and Hs578T cells ectopically expressing SCCA1 were also observed to have an increased amount of cleaved caspase-8 compared to the parental cells (Fig. 4H and data not shown). Knockdown of SCCA1 in SCCA1-expressing bax−/− bak−/− BMK, MCF10A, and Hs578T cells reduced cell death and caspase-8 cleavage induced by tunicamycin (Fig. 4F to H). These results indicate that in response to ER stress, SCCA1 promotes cell death that may involve activation of caspase-8 and may be independent of mitochondrial apoptosis.
Fig. 4.
SCCA1 promotes mitochondrion-independent apoptosis in response to ER stress. (A) BMK wild-type cells, as well as bax−/− bak−/− parental cells or those expressing SCCA1 or SCCA1-F352A were treated for the indicated amount of time with tunicamycin (0.5 μg/ml). Subcellular fractionation was performed, and the fractions were probed with indicated antibodies. S-100, soluble portion of the cell homogenate following centrifugation at 100,000 × g. (B) BMK wild-type, as well as bax−/− bak−/− parental and SCCA1-expressing cells were treated with tunicamycin for 24 h. Subcellular localization of cytochrome c (green) was visualized by immunofluorescence. DAPI (blue) was used to stain the nucleus. (C) bax−/− bak−/− BMK parental and SCCA1-expressing cells were treated with tunicamycin. Apoptotic nuclear morphology was visualized by DAPI staining. Quantification of fragmented nuclei was determined by performing three independent counts of 50 cells. The mean ± standard error of the mean is shown. (D) Cell lysates from bax−/− bak−/− BMK parental cells and SCCA1-expressing cells, treated with tunicamycin, were probed with indicated antibodies. Wild-type BMK cells were used as a positive control for apoptosis induction. (E) bax−/− bak−/− BMK parental and SCCA1-expressing cells were treated with tunicamycin (0.5 μg/ml) for 16 h. Caspase-8 activity was detected using the fluorogenic caspase-8 substrate FITC-IETD-FMK. (F and G) Parental and SCCA1-expressing cells containing either an shRNA control (shControl) or shSCCA1 were treated with tunicamycin. Cell death was measured by PI exclusion (F), and immunoblotting was performed to observe caspase-8 and PARP cleavage (G). (H) MCF10A parental cells, SCCA1-expressing cells, and SCCA1-expressing cells containing a Tet-inducible shSCCA1 either left untreated or treated with doxycycline for 3 days were treated with tunicamycin (5.0 μg/ml). The amount of cleaved caspase-8 was determined by densitometric analysis of cleaved caspase-8 against tubulin.
SCCA1 promotes caspase-8 oligomerization and activation.
Caspase-8 activation has been associated with extrinsic apoptosis, which is stimulated by the engagement of the proapoptotic death ligands, such as tumor necrosis factor (TNF) and Fas ligand (FasL), with their cell surface receptors. Binding of ligands to death receptors induces their oligomerization, allowing the recruitment of adaptor proteins and subsequently procaspase-8, thus forming the death-inducing signaling complex (DISC). This complex brings procaspase-8 proteins into close proximity, which facilitates their activation and self-processing (3).
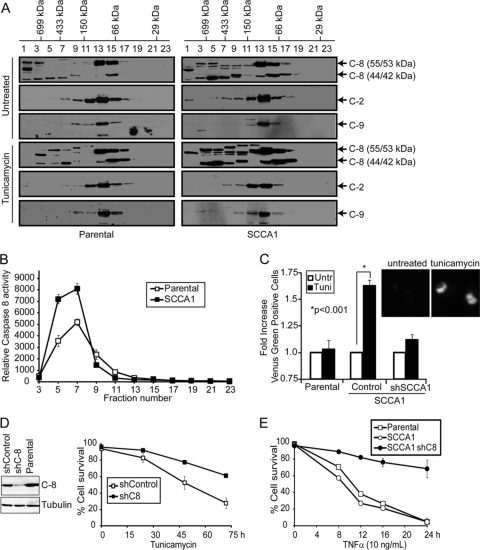
In addition to caspase-8, other initiator caspases such as caspase-2 and -9 have been proposed to be activated through a model whereby their induced proximity facilitates their oligomerization and activation (5, 12, 38, 43, 46). We then tested whether oligomerization of caspase-2, -8, and -9 was occurring in SCCA1-expressing cells upon ER stress. Size exclusion chromatography was performed, and fractions were assayed for caspase-8 activity. An increased amount of full-length (55/53 kDa) as well as cleaved (44/42 kDa) caspase-8 was found in high-molecular-weight (HMW) fractions 3 to 7 in treated SCCA1-expressing cells compared to parental cells (Fig. 5A). Correspondingly, these same fractions had the highest caspase-8 activity, suggesting that activation occurred as a result of caspase-8 oligomerization (Fig. 5B). In contrast, no obvious caspase-2 or caspase-9 high-molecular-weight aggregates were observed (Fig. 5A), indicating that caspase-8 is the major initiator caspase that forms oligomers in response to ER stress. The oligomerization of caspase-8 was further confirmed using a bimolecular fluorescence complementation (BiFC) assay. In this assay caspase-8 was fused to the N-terminal half and C-terminal half of Venus fluorescent protein and then subsequently transfected into cells. Only upon interaction of caspase-8 will these nonfluorescent fragments be brought into proximity allowing reconstitution of an intact fluorescent protein. In comparison to parental cells, SCCA1-expressing cells displayed a marked increase in fluorescence upon tunicamycin treatment, indicating that SCCA1 promotes proximity-driven oligomerization of caspase-8 in response to ER stress. Similar to parental cells, SCCA1-expressing bax−/− bak−/− BMK cells expressing shSCCA1 had very little fluorescence upon tunicamycin treatment, indicating that SCCA1 is responsible for facilitating caspase-8 proximity-driven oligomerization (Fig. 5C). To confirm that caspase-8 was indeed involved in the pathway of cell death promoted by SCCA1, caspase-8 was knocked down by short hairpin RNA (shRNA). SCCA1 cells expressing the shRNA against caspase-8 (shCaspase-8) were protected from ER stress (Fig. 5D). Importantly, although ER stress has been shown to induce TNF-α expression (21), the caspase-8-mediated apoptosis promoted by SCCA1 is unlikely to be through the death receptor as TNF-α treatment did not show a significant difference in cell death rates between parental and SCCA1-expressing cells (Fig. 5E). Together, these results indicate that ER stress can trigger caspase-8 oligomerization, activation, and subsequent apoptosis in the presence of SCCA1.
Fig. 5.
SCCA1 enhances caspase-8 oligomerization and activation in response to ER stress. (A) bax−/− bak−/− BMK parental and SCCA1-expressing cells were treated with tunicamycin (0.5 μg/ml) for 16 h, and size exclusion chromatography was performed. Eluted fractions were probed for caspases-8, -2, and -9. Molecular mass of the fractions is indicated at the top. (B) Caspase-8 activity in tunicamycin-treated fractions was determined using a luminogenic caspase-8 substrate, IETD. (C) Parental and SCCA1 cells expressing either an shControl or shSCCA1 were transfected with Venus-tagged caspase-8. Cells were left untreated or treated for 16 h with tunicamycin and then analyzed by flow cytometry. Shown is the fold increase in fluorescent cells in tunicamycin-treated cells compared to untreated cells. Inserted images show the Venus fluorescence induced by tunicamycin treatment. (D) Caspase-8 knockdown protects SCCA1-expressing cells from ER stress-induced apoptosis. SCCA1-expressing bax−/− bak−/− cells were infected with shCaspase-8 (shC-8) or control shRNA. The cells were treated with tunicamycin, and cell death was measured by PI exclusion. (E) Parental and SCCA1-expressing cells as well as SCCA1-expressing cells containing shCaspase-8 were treated with TNF-α plus cycloheximide (10 μg/ml), and cell death was measured by PI exclusion.
SCCA1 leads to decreased proteasome activity and increased protein polyubiquitination and aggregation.
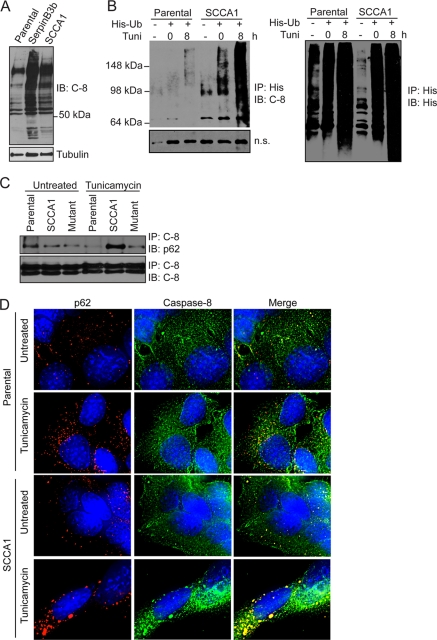
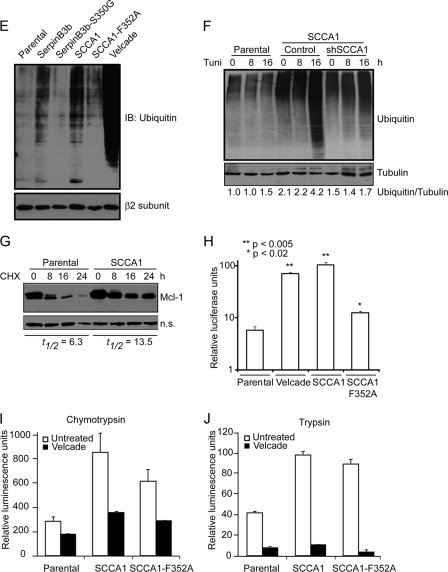
It has recently been shown that caspase-8 aggregation at the DISC is dependent on its ubiquitination (24). While performing caspase-8 immunoblotting analysis, it was observed that there was an increased amount of high-molecular-weight (HMW) species in SCCA1- and SerpinB3b-expressing cells, suggesting that SCCA1 and SerpinB3b may promote caspase-8 aggregation by enhancing its ubiquitination (Fig. 6A). To determine whether SCCA1 promotes ubiquitination of caspase-8, parental or SCCA1-expressing MCF10A cells were transfected with His-tagged ubiquitin and treated with tunicamycin. Cell lysates were precipitated with Ni-NTA-agarose. Upon immunoblotting with caspase-8, it was observed that SCCA1-expressing cells had an accumulation of ubiquitinated caspase-8, which was further enhanced by treatment with tunicamycin (Fig. 6B). Sequestosome 1/p62 is a cellular protein that has been shown to interact noncovalently with ubiquitin and to localize to protein aggregates. A coimmunoprecipitation assay showed that the amount of p62 associating with caspase-8 was significantly higher in tunicamycin-treated SCCA1-expressing Hs578T cells than in parental cells and cells expressing the SCCA1-F352A mutant (Fig. 6C). Additionally, colocalization of caspase-8 and p62 was examined by immunofluorescence. Partial colocalization of caspase-8 and p62 was observed in both untreated and tunicamycin-treated parental cells. However, in sharp contrast, the majority of p62 puncta were found to associate with caspase-8 in untreated SCCA1-expressing cells. The colocalization of p62 and caspase-8 was further enhanced by tunicamycin treatment (Fig. 6D).
Fig. 6.
SCCA1 leads to increased caspase-8 ubiquitination and interaction with SQSTM1/p62. (A) bax−/− bak−/− BMK parental, SCCA1-expressing, and SerpinB3b-expressing cells were immunoblotted for caspase-8. Note the increase in higher-molecular-weight protein bands in SCCA1 or SerpinB3b cells, suggestive of polyubiquitination. (B) MCF10A parental and SCCA1-expressing cells were transfected with a polyhistidine-tagged Ub (His-Ub) and subsequently treated with tunicamycin for 8 h. Lysates were immunoprecipitated with a His antibody and blotted for caspase-8 or His tag. A nonspecific band (n.s.) was used to indicate equal loading. (C) Lysates from Hs578T parental or SCCA1-expressing cells, untreated or treated with tunicamycin for 24 h, were immunoprecipitated with a caspase-8 antibody and blotted for p62 or caspase-8. (D) SCCA1 promotes caspase-8 and p62 interaction upon ER stress treatment. bax−/− bak−/− BMK parental and SCCA1-expressing cells were left untreated or treated with tunicamycin (0.5 μg/ml) for 16 h. Immunofluorescence staining was performed using antibodies against p62 (red) or caspase-8 (green). (E) Cell lysates from untreated bax−/− bak−/− BMK parental or cells expressing wild-type or mutant serpins were examined for protein ubiquitination. Parental cells were treated with the proteasome inhibitor bortezomib (2 μM) for 8 h, as a positive control. The proteasome β2 subunit was probed for equal loading. (F) Parental and SCCA1 cells expressing an shControl or shSCCA1 were treated with tunicamycin. Cell lysates were subsequently examined for protein ubiquitination. The amount of ubiquitination was determined by densitometric analysis of the intensity of ubiquitination standardizing against tubulin. (G) Cells were treated for the indicated amount of time with cycloheximide (CHX; 10 μg/ml). Mcl-1, a protein degraded by the proteasome, was probed for, and the half-life (t1/2) was determined by densitometric analysis. (H) Parental, SCCA1, and SCCA1-F352A cells were transfected with a ubiquitin-luciferase reporter construct to determine the efficiency of degradation of ubiquitinated proteins. Parental cells were treated with bortezomib (2 μM) for 8 h as a positive control. Luciferase activity in cell lysates was determined, which allows for standardizing transfection efficiencies based on Renilla luciferase activity. (I and J) Parental cells and those expressing wild-type and mutant SCCA1 were left untreated or were treated with bortezomib (2 μM) for 8 h; proteasomal chymotrypsin-like (I) and trypsin-like (J) activities were assayed for using fluorogenic substrates.
To address the question of whether caspase-8 ubiquitination is a specific event or whether global cellular ubiquitination is increased in SCCA1-expressing cells, Western blotting looking at total cellular protein ubiquitination was performed. Ubiquitination in both SCCA1- and SerpinB3b-expressing cells was increased compared to levels in parental cells (Fig. 6E). The increased global ubiquitination is dependent on serpin's protease-inhibitory activity as both SerpinB3b-S350G and SCCA1-F352A mutants showed drastically decreased ubiquitination (Fig. 6E). Knockdown of SCCA1 in SCCA1-expressing cells also led to decreased ubiquitination (Fig. 6F). The increased protein ubiquitination correlated with decreased proteasomal degradation in SCCA1-expressing cells as the half-life of an established proteasomal substrate, Mcl-1, was prolonged in SCCA1 cells (Fig. 6G). To further test the theory that the enhanced globally ubiquitinated proteins are a result of impaired proteasomal degradation in SCCA1-expressing cells, a ubiquitin-luciferase reporter construct specifically degraded by the 26S proteasome was utilized (30). In comparison to parental cells, SCCA1-expressing cells displayed a significant decrease in proteasomal activity, indicated by increased luciferase activity (Fig. 6H). The proteasomal inhibitory activity was impaired in SCCA1-F352A mutant cells (Fig. 6H). Additionally, inhibition of proteasomal function was also observed in bax−/− bak−/− cells expressing SerpinB3b as well as in Hs578T cells expressing SCCA1 (data not shown). Taken together, these results indicate that SCCA1 and SerpinB3b can promote caspase-8 aggregation by enhancing global protein ubiquitination.
SCCA1 blocks lysosomal turnover.
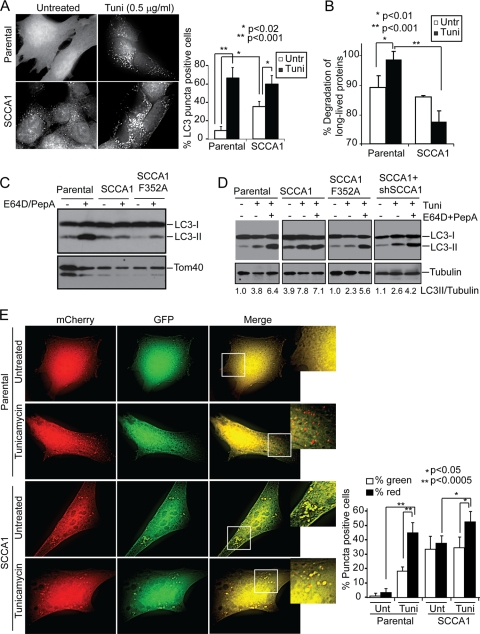
One possible mechanism of SCCA1 and SerpinB3b inhibition of proteasomal degradation is through the direct inhibition of the proteasomal enzymatic activity. However, proteasomal chymotrypsin and trypsin activities were not inhibited in SCCA1-expressing cells, suggesting that decreased proteasomal degradation occurs at an early step or is an indirect consequence of SCCA1 expression (Fig. 6I and J). Another possible mechanism for SCCA1 inhibition of proteasomal protein degradation could be an indirect consequence of impaired lysosomal degradation. Indeed, it has been observed that inhibition of lysosomal degradation leads to a build-up of ubiquitinated proteins and a decreased flux of proteins through the proteasome at a stage upstream of proteasome catalytic activity (26, 47). It is possible that SCCA1's ability to inhibit lysosomal proteases may have an effect on lysosomal activity and protein turnover and, in this way, indirectly influence proteasomal degradation. To determine whether lysosomal turnover is affected, the subcellular localization pattern of LC3, which undergoes lipidation and localizes to autophagosome membranes and is consequently degraded in autolysosomes, was examined using GFP-conjugated LC3. SCCA1 cells showed a marked increase in the amount of GFP-LC3 puncta at the basal state (Fig. 7A). It is well documented that ER stress can induce autophagy flux and stimulates lysosomal turnover (34, 56, 60). Tunicamycin treatment induced LC3 punctum formation in parental cells, suggesting an increase in autophago-lysosomal activity. However, this tunicamycin-induced LC3 punctum formation was not as drastic in SCCA1-expressing cells (Fig. 7A). Consistent with this, a long-lived protein degradation assay showed that while autophago-lysosomal protein degradation was stimulated by tunicamycin in parental cells, it was indeed suppressed in SCCA1-expressing cells (Fig. 7B). To further confirm the impaired lysosomal degradation upon SCCA1 expression, cells were either left untreated or treated with the lysosomal inhibitors E64D and pepstatin A (PepA). While treatment with E64D plus PepA caused the accumulation of LC3-II in parental and SCCA1-F352A mutant cells, SCCA1 cells had a higher basal level of LC3-II, which was not further enhanced by treatment with the lysosomal inhibitors (Fig. 7C). In agreement with the above data, tunicamycin treatment led to an increase in LC3-II in parental and SCCA1-F352 cells, which was further increased in parental cells by the lysosomal inhibitors. In contrast, tunicamycin-induced LC3-II accumulation was not further enhanced by the lysosomal inhibitors in SCCA1-expressing cells (Fig. 7D). In contrast, SCCA1 knockdown in SCCA1-expressing cells restored the lysosomal degradation flux (Fig. 7D). In addition to bax−/− bak−/− BMK cells, similar findings were observed in MCF10A cells expressing SCCA1 (data not shown). These findings suggest that in SCCA1-expressing cells, the ER stress-induced autophago-lysosomal turnover was blocked.
Fig. 7.
SCCA1 blocks lysosomal turnover. (A) bax−/− bak−/− BMK parental or SCCA1-expressing cells stably expressing GFP-LC3 were treated with tunicamycin (Tuni) for 8 h. Cells were observed under a deconvolution microscope. The percentage of cells showing punctated GFP-LC3 was determined for three independent counts of 50 cells, and the values represent the mean ± standard error of the mean. (B) Cells were labeled with [14C]valine for 48 h and then treated for 24 h with tunicamycin. Long-lived protein degradation was measured. Untr, untreated. (C) bax−/− bak−/− BMK parental cells or SCCA1- or SCCA1-F352A-expressing cells were left untreated or treated with E64D (10 μg/ml) and PepA (10 μg/ml) for 16 h. Cell lysates were probed for LC3. Tom40 was probed for equal loading. (D) Indicated cells were treated with tunicamycin alone or in combination with E64D (10 μg/ml) and PepA (10 μg/ml) for 16 h. Cell lysates were probed for LC3 and tubulin, and the ratio of LC3-II against tubulin was determined. (E) Parental and SCCA1-expressing bax−/− bak−/− BMK cells were transfected with mCherry-EGFP-LC3 and then treated with tunicamycin (0.5 μg/ml) for 16 h. The amount of red and green puncta was quantitated. Percentage of cells showing green and red puncta was determined for three independent counts of 50 cells, and the values represent the mean ± standard error of the mean.
To further verify that lysosomal degradation is indeed affected by SCCA1, the mCherry-enhanced GFP (EGFP)-LC3 construct was utilized (35). This construct contains the monomeric red fluorescent protein mCherry, which can only be degraded when the pH is below 4.5, and EGFP, which is degraded at a pH below 6.0. While early and late endosomes have a pH of 6.1 and 5.5, respectively, lysosomes have a pH of 4.7; thus, while EGFP is degraded by late endosomes and lysosomes, mCherry is not (35). In parental untreated cells there are very few puncta, and mostly diffuse yellow staining was observed, due to the combined presence of mCherry and EGFP. Upon treatment with tunicamycin, there was an increase in puncta, the majority of which are red, indicating that tunicamycin induces autophagy flux (Fig. 7E). SCCA1 cells, however, had an increased basal level of puncta, which were almost all yellow, indicating a defect in lysosomal degradation. The sizes of the yellow puncta were further increased upon treatment with tunicamycin, indicating that while ER stress induces autophagy influx, SCCA1 blocks lysosomal degradation and, hence, facilitates protein aggregations at autolysosomes (Fig. 7E). Similar effects were observed in apoptosis-competent Hs578T cells expressing SCCA1 (data not shown). Taken together, these results demonstrate that SCCA1 can block lysosomal protein degradation, particularly when under ER stress.
SCCA1 promotes caspase-8 aggregation and activation on lysosomes.
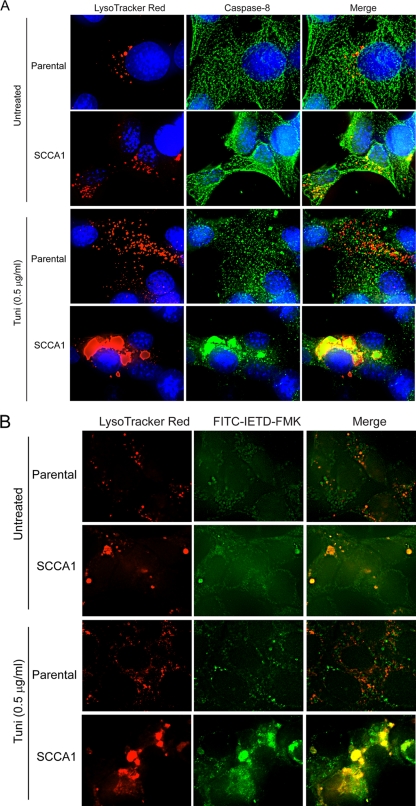
The above observations suggest that ER stress could possibly induce the aggregation of caspase-8, which normally would then be degraded by lysosomes. However, in the presence of SCCA1, lysosomal degradation is blocked, which would facilitate the aggregation and subsequent activation of caspase-8. This theory would suggest that caspase-8 can be activated intracellularly on lysosomes. To address this, cells were stained with LysoTracker Red, and immunofluorescence analysis was performed using an antibody for caspase-8. As previously observed, in comparison to parental cells, SCCA1 cells have a higher basal level of lysosome staining (Fig. 1C and D and 8A). While there is little association of caspase-8 with lysosomes in parental cells, this association is markedly enhanced in SCCA1 cells (Fig. 8A). In response to tunicamycin treatment, the level of lysosomal staining dramatically increases in parental cells. Additionally, the pattern of caspase-8 staining appears more punctate than that observed in untreated cells. Nevertheless, there appears to be only a few lysosomes that colocalize with caspase-8. In stark contrast, SCCA1 cells are observed to have large caspase-8 aggregates that colocalize with lysosomes (Fig. 8A). Additionally, to determine whether the aggregated caspase-8 that colocalizes with lysosomes is active, an FITC-conjugated caspase-8 substrate peptide, FITC-IETD-FMK, was incubated with tunicamycin-treated parental and SCCA1 cells along with LysoTracker Red. Staining for activated caspase-8 in parental cells was low and was not observed to colocalize with lysosomes. In comparison, the FITC signal was stronger in SCCA1 cells and was found to form large aggregates that colocalized with lysosomes, indicating that the aggregated caspase-8 found at lysosomes is indeed active (Fig. 8B). These observations suggest that ER stress can lead to the accumulation of caspase-8 at lysosomes, allowing their association and activation which contributes to enhanced cell death in SCCA1 cells.
Fig. 8.
SCCA1 promotes caspase-8 aggregation and activation at lysosomes. Parental and SCCA1-expressing bax−/− bak−/− BMK cells were left untreated or treated with tunicamycin (Tuni) for 16 h. Immunofluorescence staining was performed using LysoTracker Red and an antibody against caspase-8 (green). The substrate specific for activated caspase-8, FITC-IETD-FMK, was used to verify that the caspase-8 colocalizing with lysosomes was indeed active (B).
DISCUSSION
Cancer cells often have elevated protein synthesis, energy consumption, and by-product disposal. To cope with these conditions, cancer cells often require increased protein degradation, thus leading to changes such as elevated lysosome number, size, and expression of lysosomal hydrolases (17). These conditions can make cancer cells more susceptible to lysosomal injury, which, depending on its extent and duration, may lead to both apoptotic and nonapoptotic cell death. Not surprisingly, cancer cells develop cytoprotective mechanisms, such as elevated levels of Hsp70, sphingomyelin, and serpins, to guard against this vulnerability (37, 50). Indeed, in agreement with previous reports showing the protective role of serpins against lysosomal injury, we find here that SCCA1 protects against insults such as DNA alkylating damage and hypotonic shock by inhibiting lysosome hydrolases and preventing lysosomal permeabilization. Additionally, we have observed that cancer cells naturally expressing a high level of SCCA1 are unable to survive and proliferate when SCCA1's expression is knocked down using a short hairpin RNA, thus suggesting that this protein is imperative to cell survival of these cancer cells (11).
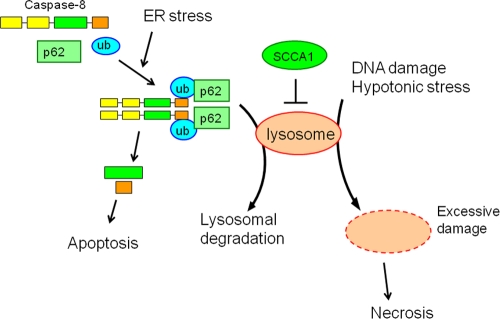
Interestingly, despite its protective role against lysosomal injury, we find here that SCCA1 promotes cell death induced by ER stress (Fig. 9). This cell death appears to be apoptotic, indicated by both the morphological features and the activation of caspases. ER stress-induced apoptosis has been previously reported to occur via caspase-12 in murine cells (32) or through induction of the BH3-only proteins Bim (39) and Puma (42). As apoptosis mediated by caspase-12, Bim, and Puma requires Bax and Bak (62, 63), our finding that ER stress-induced apoptosis in SCCA1-expressing cells that lack Bak and Bax indicates that this apoptosis is not mainly mediated by caspase-12 and the BH3-only proteins. This theory is further supported by the observation that cytochrome c release does not occur in SCCA1-expressing bax−/− bak−/− cells upon ER stress treatment in spite of the apoptotic nature of the cell death. Furthermore, while ER stress has been reported to upregulate the expression of death ligands TNF-α, FasL, and TRAIL (TNF-related apoptosis-inducing ligand) (21), the death receptor apoptotic pathway is unlikely the cause for enhanced apoptosis rendered by SCCA1 as cell sensitivity to TNF-α was not affected by the status of SCCA1 expression (Fig. 5E). Importantly, we show here that although the death receptor pathway is not involved, ER stress-mediated cell death in SCCA1-expressing cells is a result of caspase-8 activation.
Fig. 9.
SCCA1 protects cells against lysosomal injury but enhances apoptosis in response to ER stress. On one hand, SCCA1 blocks necrosis induced by lysosomal injury in response to DNA alkylating damage and hypotonic shock. On the other hand, SCCA1 inhibits lysosomal protein degradation. Hence, in response to ER stress that leads to the accumulation of unfolded proteins, SCCA1 prevents lysosomal clearance of caspase-8/p62 aggregates, resulting in the subsequent activation of caspase-8 and apoptosis.
Caspase-8 is an initiator caspase that has been well characterized to be activated through its aggregation and autocleavage at the DISC upon the interaction of death ligands and their cell surface receptors (2, 6). In addition to DISC-mediated caspase-8 aggregation and activation, caspase-9 is activated via aggregation on apoptosomes (27, 45), caspase-2 is activated via PIDDosomes (7, 53), and caspase-1 and -5 are activated via inflammasomes (31). A recent study shows that the aggregation of caspase-8 on the DISC is facilitated by its ubiquitination and interaction with the ubiquitin-binding protein SQSTM1/p62 (24). Here, we show that intracellular caspase-8 ubiquitination and aggregation, induced by ER stress, can initiate an apoptotic response independently of the death receptor pathway in SCCA1-expressing cells. This, together with a recent finding in our laboratory that inhibition of proteasome degradation leads to enhanced caspase-8 proximity and activation in intracellular membranes (34a), suggests a novel mechanism for caspase-8 activation in response to proteotoxic stress. While our results indicate that this cell death coincides with SCCA1's ability to increase global protein ubiquitination, including that of caspase-8, it remains to be determined whether ubiquitination is a prerequisite for caspase-8 intracellular aggregation and activation.
Our findings indicate that cells with high levels of SCCA1 expression can be specifically targeted by ER stress to enhance cytotoxicity. Significantly, many cancers are under chronic ER stress, leading to a heightened UPR. However, numerous studies have shown that the UPR in cancer cells is altered such that prosurvival signals are favored while prodeath signals are inhibited (23, 40). Currently, two approaches are being explored to exploit the elevated UPR observed in cancer, one of which is to block the prosurvival signals, while the other approach attempts to further enhance ER stress to shift in favor of a prodeath response (15). Several drugs used clinically to treat various types of cancers have been reported to increase the unfolded protein response. Among these agents are proteasome inhibitors, which result in decreased protein degradation and a subsequent increase in polyubiquitinated proteins and aggregates (16, 20, 48, 52). With regard to cancer cells expressing SCCA1, given that their UPR is already elevated, treating them therapeutically with agents that further enhance ER stress may shift the UPR in favor of a prodeath response, thus leading to a better outcome.
ACKNOWLEDGMENTS
We thank Eileen White for bax−/− bak−/− BMK cells, David Piwnica-Worms for the Ub-FL plasmid, Erich Mackow for the polyhistidine-tagged ubiquitin construct, Terje Johanson for the mCherry-GFP-LC3 construct, Michael Frohman for the Venus and linker sequence constructs, William Lennarz and Gang Zhao for assistance on the size exclusion chromatography, and Juei-Suei Chen for technical assistance. We thank Zhixun Dou, Namratha Sheshadri, Joseph Catanzaro, and Yongjun Fan for critical reading and discussion.
E.U. is supported by the NIH training grant T32CA009176. This work was supported by NIH (CA098092 and CA129536), Susan Komen for the Cure (KG081538), and the Carol Baldwin Breast Cancer Research Foundation to WXZ.
Footnotes
Published ahead of print on 16 May 2011.
REFERENCES
- 1. Artal-Sanz M., Samara C., Syntichaki P., Tavernarakis N. 2006. Lysosomal biogenesis and function is critical for necrotic cell death in Caenorhabditis elegans. J. Cell Biol. 173:231–239 [DOI] [PMC free article] [PubMed] [Google Scholar]
- 2. Ashkenazi A., Dixit V. M. 1998. Death receptors: signaling and modulation. Science 281:1305–1308 [DOI] [PubMed] [Google Scholar]
- 3. Ashkenazi A., Dixit V. M. 1999. Apoptosis control by death and decoy receptors. Curr. Opin. Cell Biol. 11:255–260 [DOI] [PubMed] [Google Scholar]
- 4. Askew D. J., et al. 2004. The amplified mouse squamous cell carcinoma antigen gene locus contains a serpin (Serpinb3b) that inhibits both papain-like cysteine and trypsin-like serine proteinases. Genomics 84:166–175 [DOI] [PubMed] [Google Scholar]
- 5. Baliga B. C., Read S. H., Kumar S. 2004. The biochemical mechanism of caspase-2 activation. Cell Death Differ. 11:1234–1241 [DOI] [PubMed] [Google Scholar]
- 6. Boatright K. M., et al. 2003. A unified model for apical caspase activation. Mol. Cell 11:529–541 [DOI] [PubMed] [Google Scholar]
- 7. Bouchier-Hayes L., et al. 2009. Characterization of cytoplasmic caspase-2 activation by induced proximity. Mol. Cell 35:830–840 [DOI] [PMC free article] [PubMed] [Google Scholar]
- 8. Boya P., et al. 2003. Lysosomal membrane permeabilization induces cell death in a mitochondrion-dependent fashion. J. Exp. Med. 197:1323–1334 [DOI] [PMC free article] [PubMed] [Google Scholar]
- 9. Brunk U. T., Dalen H., Roberg K., Hellquist H. B. 1997. Photo-oxidative disruption of lysosomal membranes causes apoptosis of cultured human fibroblasts. Free Radic. Biol. Med. 23:616–626 [DOI] [PubMed] [Google Scholar]
- 10. Brunk U. T., Svensson I. 1999. Oxidative stress, growth factor starvation and Fas activation may all cause apoptosis through lysosomal leak. Redox Rep. 4:3–11 [DOI] [PubMed] [Google Scholar]
- 11. Catanzaro J. M., et al. 2011. Elevated expression of squamous cell carcinoma antigen (SCCA) is associated with human breast carcinoma. PLoS One 6:e19096. [DOI] [PMC free article] [PubMed] [Google Scholar]
- 12. Chang D. W., et al. 2003. Oligomerization is a general mechanism for the activation of apoptosis initiator and inflammatory procaspases. J. Biol. Chem. 278:16466–16469 [DOI] [PubMed] [Google Scholar]
- 13. Cory S., Huang D. C., Adams J. M. 2003. The Bcl-2 family: roles in cell survival and oncogenesis. Oncogene 22:8590–8607 [DOI] [PubMed] [Google Scholar]
- 14. Degenhardt K., Sundararajan R., Lindsten T., Thompson C., White E. 2002. Bax and Bak independently promote cytochrome c release from mitochondria. J. Biol. Chem. 277:14127–14134 [DOI] [PubMed] [Google Scholar]
- 15. Ding W. X., Yin X. M. 2008. Sorting, recognition and activation of the misfolded protein degradation pathways through macroautophagy and the proteasome. Autophagy 4:141–150 [DOI] [PubMed] [Google Scholar]
- 16. Eldridge A. G., O'Brien T. 2010. Therapeutic strategies within the ubiquitin proteasome system. Cell Death Differ. 17:4–13 [DOI] [PubMed] [Google Scholar]
- 17. Fehrenbacher N., Jaattela M. 2005. Lysosomes as targets for cancer therapy. Cancer Res. 65:2993–2995 [DOI] [PubMed] [Google Scholar]
- 18. Guerriero J. L., et al. 2008. Chemotherapy induces tumor clearance independent of apoptosis. Cancer Res. 68:9595–9600 [DOI] [PMC free article] [PubMed] [Google Scholar]
- 19. Heath-Engel H. M., Chang N. C., Shore G. C. 2008. The endoplasmic reticulum in apoptosis and autophagy: role of the BCL-2 protein family. Oncogene 27:6419–6433 [DOI] [PubMed] [Google Scholar]
- 20. Hoeller D., Dikic I. 2009. Targeting the ubiquitin system in cancer therapy. Nature 458:438–444 [DOI] [PubMed] [Google Scholar]
- 21. Hu P., Han Z., Couvillon A. D., Kaufman R. J., Exton J. H. 2006. Autocrine tumor necrosis factor alpha links endoplasmic reticulum stress to the membrane death receptor pathway through IRE1α-mediated NF-κB activation and down-regulation of TRAF2 expression. Mol. Cell. Biol. 26:3071–3084 [DOI] [PMC free article] [PubMed] [Google Scholar]
- 22. Huntington J. A., Read R. J., Carrell R. W. 2000. Structure of a serpin-protease complex shows inhibition by deformation. Nature 407:923–926 [DOI] [PubMed] [Google Scholar]
- 23. Jiang C. C., et al. 2008. Up-regulation of Mcl-1 is critical for survival of human melanoma cells upon endoplasmic reticulum stress. Cancer Res. 68:6708–6717 [DOI] [PubMed] [Google Scholar]
- 24. Jin Z., et al. 2009. Cullin3-based polyubiquitination and p62-dependent aggregation of caspase-8 mediate extrinsic apoptosis signaling. Cell 137:721–735 [DOI] [PubMed] [Google Scholar]
- 25. Katagiri C., Nakanishi J., Kadoya K., Hibino T. 2006. Serpin squamous cell carcinoma antigen inhibits UV-induced apoptosis via suppression of c-JUN NH2-terminal kinase. J. Cell Biol. 172:983–990 [DOI] [PMC free article] [PubMed] [Google Scholar]
- 26. Korolchuk V. I., Mansilla A., Menzies F. M., Rubinsztein D. C. 2009. Autophagy inhibition compromises degradation of ubiquitin-proteasome pathway substrates. Mol. Cell 33:517–527 [DOI] [PMC free article] [PubMed] [Google Scholar]
- 27. Li P., et al. 1997. Cytochrome c and dATP-dependent formation of Apaf-1/caspase-9 complex initiates an apoptotic protease cascade. Cell 91:479–489 [DOI] [PubMed] [Google Scholar]
- 28. Luke C., et al. 2000. Simple modifications of the serpin reactive site loop convert SCCA2 into a cysteine proteinase inhibitor: a critical role for the P3′ proline in facilitating RSL cleavage. Biochemistry 39:7081–7091 [DOI] [PubMed] [Google Scholar]
- 29. Luke C. J., et al. 2007. An intracellular serpin regulates necrosis by inhibiting the induction and sequelae of lysosomal injury. Cell 130:1108–1119 [DOI] [PMC free article] [PubMed] [Google Scholar]
- 30. Luker G. D., Pica C. M., Song J., Luker K. E., Piwnica-Worms D. 2003. Imaging 26S proteasome activity and inhibition in living mice. Nat. Med. 9:969–973 [DOI] [PubMed] [Google Scholar]
- 31. Martinon F., Burns K., Tschopp J. 2002. The inflammasome: a molecular platform triggering activation of inflammatory caspases and processing of proIL-beta. Mol. Cell 10:417–426 [DOI] [PubMed] [Google Scholar]
- 32. Nakagawa T., et al. 2000. Caspase-12 mediates endoplasmic-reticulum-specific apoptosis and cytotoxicity by amyloid-beta. Nature 403:98–103 [DOI] [PubMed] [Google Scholar]
- 33. Nilsson C., Johansson U., Johansson A. C., Kagedal K., Ollinger K. 2006. Cytosolic acidification and lysosomal alkalinization during TNF-alpha induced apoptosis in U937 cells. Apoptosis 11:1149–1159 [DOI] [PubMed] [Google Scholar]
- 34. Ogata M., et al. 2006. Autophagy is activated for cell survival after endoplasmic reticulum stress. Mol. Cell. Biol. 26:9220–9231 [DOI] [PMC free article] [PubMed] [Google Scholar]
- 34a. Pan J.-A., Ullman E., Dou Z., Zong W.-X. Inhibition of protein degradation induces apoptosis through a light-chain 3-mediated activation of caspase-8 at intracellular membranes. Mol. Cell. Biol., in press [DOI] [PMC free article] [PubMed] [Google Scholar]
- 35. Pankiv S., et al. 2007. p62/SQSTM1 binds directly to Atg8/LC3 to facilitate degradation of ubiquitinated protein aggregates by autophagy. J. Biol. Chem. 282:24131–24145 [DOI] [PubMed] [Google Scholar]
- 36. Paquet C., Sane A. T., Beauchemin M., Bertrand R. 2005. Caspase- and mitochondrial dysfunction-dependent mechanisms of lysosomal leakage and cathepsin B activation in DNA damage-induced apoptosis. Leukemia 19:784–791 [DOI] [PubMed] [Google Scholar]
- 37. Petersen N. H., Kirkegaard T., Olsen O. D., Jaattela M. 2010. Connecting Hsp70, sphingolipid metabolism and lysosomal stability. Cell Cycle 9:2305–2309 [DOI] [PubMed] [Google Scholar]
- 38. Pop C., Timmer J., Sperandio S., Salvesen G. S. 2006. The apoptosome activates caspase-9 by dimerization. Mol. Cell 22:269–275 [DOI] [PubMed] [Google Scholar]
- 39. Puthalakath H., et al. 2007. ER stress triggers apoptosis by activating BH3-only protein Bim. Cell 129:1337–1349 [DOI] [PubMed] [Google Scholar]
- 40. Ranganathan A. C., Zhang L., Adam A. P., Aguirre-Ghiso J. A. 2006. Functional coupling of p38-induced up-regulation of BiP and activation of RNA-dependent protein kinase-like endoplasmic reticulum kinase to drug resistance of dormant carcinoma cells. Cancer Res. 66:1702–1711 [DOI] [PMC free article] [PubMed] [Google Scholar]
- 41. Rawlings N. D., Barrett A. J. 1999. MEROPS: the peptidase database. Nucleic Acids Res. 27:325–331 [DOI] [PMC free article] [PubMed] [Google Scholar]
- 42. Reimertz C., Kogel D., Rami A., Chittenden T., Prehn J. H. 2003. Gene expression during ER stress-induced apoptosis in neurons: induction of the BH3-only protein Bbc3/PUMA and activation of the mitochondrial apoptosis pathway. J. Cell Biol. 162:587–597 [DOI] [PMC free article] [PubMed] [Google Scholar]
- 43. Renatus M., Stennicke H. R., Scott F. L., Liddington R. C., Salvesen G. S. 2001. Dimer formation drives the activation of the cell death protease caspase 9. Proc. Natl. Acad. Sci. U. S. A. 98:14250–14255 [DOI] [PMC free article] [PubMed] [Google Scholar]
- 44. Rizzo M. A., Springer G., Segawa K., Zipfel W. R., Piston D. W. 2006. Optimization of pairings and detection conditions for measurement of FRET between cyan and yellow fluorescent proteins. Microsc. Microanal. 12:238–254 [DOI] [PubMed] [Google Scholar]
- 45. Rodriguez J., Lazebnik Y. 1999. Caspase-9 and APAF-1 form an active holoenzyme. Genes Dev. 13:3179–3184 [DOI] [PMC free article] [PubMed] [Google Scholar]
- 46. Salvesen G. S., Dixit V. M. 1999. Caspase activation: the induced-proximity model. Proc. Natl. Acad. Sci. U. S. A. 96:10964–10967 [DOI] [PMC free article] [PubMed] [Google Scholar]
- 47. Seibenhener M. L., et al. 2004. Sequestosome 1/p62 is a polyubiquitin chain binding protein involved in ubiquitin proteasome degradation. Mol. Cell. Biol. 24:8055–8068 [DOI] [PMC free article] [PubMed] [Google Scholar]
- 48. Shah J. J., Orlowski R. Z. 2009. Proteasome inhibitors in the treatment of multiple myeloma. Leukemia 23:1964–1979 [DOI] [PMC free article] [PubMed] [Google Scholar]
- 49. Suminami Y., Kishi F., Sekiguchi K., Kato H. 1991. Squamous cell carcinoma antigen is a new member of the serine protease inhibitors. Biochem. Biophys. Res. Commun. 181:51–58 [DOI] [PubMed] [Google Scholar]
- 50. Suminami Y., et al. 2000. Inhibition of apoptosis in human tumour cells by the tumour-associated serpin, SCC antigen-1. Br. J. Cancer 82:981–989 [DOI] [PMC free article] [PubMed] [Google Scholar]
- 51. Takeda A., Yamamoto T., Nakamura Y., Takahashi T., Hibino T. 1995. Squamous cell carcinoma antigen is a potent inhibitor of cysteine proteinase cathepsin L. FEBS Lett. 359:78–80 [DOI] [PubMed] [Google Scholar]
- 52. Testa U. 2009. Proteasome inhibitors in cancer therapy. Curr. Drug Targets 10:968–981 [DOI] [PubMed] [Google Scholar]
- 53. Tinel A., Tschopp J. 2004. The PIDDosome, a protein complex implicated in activation of caspase-2 in response to genotoxic stress. Science 304:843–846 [DOI] [PubMed] [Google Scholar]
- 54. Turk B., Turk V. 2009. Lysosomes as “suicide bags” in cell death: myth or reality? J. Biol. Chem. 284:21783–21787 [DOI] [PMC free article] [PubMed] [Google Scholar]
- 55. Uemura Y., et al. 2000. Circulating serpin tumor markers SCCA1 and SCCA2 are not actively secreted but reside in the cytosol of squamous carcinoma cells. Int. J. Cancer 89:368–377 [DOI] [PubMed] [Google Scholar]
- 56. Ullman E., et al. 2008. Autophagy promotes necrosis in apoptosis-deficient cells in response to ER stress. Cell Death Differ. 15:422–425 [DOI] [PMC free article] [PubMed] [Google Scholar]
- 57. Vene R., et al. 2007. Novel cell death pathways induced by N-(4-hydroxyphenyl)retinamide: therapeutic implications. Mol. Cancer Ther. 6:286–298 [DOI] [PubMed] [Google Scholar]
- 58. Wei M. C., et al. 2001. Proapoptotic BAX and BAK: a requisite gateway to mitochondrial dysfunction and death. Science 292:727–730 [DOI] [PMC free article] [PubMed] [Google Scholar]
- 59. Wiederschain D., et al. 2009. Single-vector inducible lentiviral RNAi system for oncology target validation. Cell Cycle 8:498–504 [DOI] [PubMed] [Google Scholar]
- 60. Yorimitsu T., Nair U., Yang Z., Klionsky D. J. 2006. Endoplasmic reticulum stress triggers autophagy. J. Biol. Chem. 281:30299–30304 [DOI] [PMC free article] [PubMed] [Google Scholar]
- 61. Zong W. X., Ditsworth D., Bauer D. E., Wang Z. Q., Thompson C. B. 2004. Alkylating DNA damage stimulates a regulated form of necrotic cell death. Genes Dev. 18:1272–1282 [DOI] [PMC free article] [PubMed] [Google Scholar]
- 62. Zong W. X., et al. 2003. Bax and Bak can localize to the endoplasmic reticulum to initiate apoptosis. J. Cell Biol. 162:59–69 [DOI] [PMC free article] [PubMed] [Google Scholar]
- 63. Zong W. X., Lindsten T., Ross A. J., MacGregor G. R., Thompson C. B. 2001. BH3-only proteins that bind pro-survival Bcl-2 family members fail to induce apoptosis in the absence of Bax and Bak. Genes Dev. 15:1481–1486 [DOI] [PMC free article] [PubMed] [Google Scholar]


