

Abstract
82Rb cardiac PET allows the assessment of myocardial perfusion using a column generator in clinics that lack a cyclotron. We and others have previously shown that quantitation of myocardial blood flow (MBF) and coronary flow reserve (CFR) is feasible using dynamic 82Rb PET and factor and compartment analyses. The aim of the present work was to determine the intra- and inter-observer variability of MBF estimation using 82Rb PET as well as the reproducibility of our generalized factor + compartment analyses methodology to estimate MBF and assess its accuracy by comparing, in the same subjects, 82Rb estimates of MBF to those obtained using 13N-ammonia.
Methods
Twenty-two subjects were included in the reproducibility and twenty subjects in the validation study. Patients were injected with 60±5mCi of 82Rb and imaged dynamically for 6 minutes at rest and during dipyridamole stress Left and right ventricular (LV+RV) time-activity curves were estimated by GFADS and used as input to a 2-compartment kinetic analysis that estimates parametric maps of myocardial tissue extraction (K1) and egress (k2), as well as LV+RV contributions (fv,rv).
Results
Our results show excellent reproducibility of the quantitative dynamic approach itself with coefficients of repeatability of 1.7% for estimation of MBF at rest, 1.4% for MBF at peak stress and 2.8% for CFR estimation. The inter-observer reproducibility between the four observers that participated in this study was also very good with correlation coefficients greater than 0.87 between any two given observers when estimating coronary flow reserve. The reproducibility of MBF in repeated 82Rb studies was good at rest and excellent at peak stress (r2=0.835). Furthermore, the slope of the correlation line was very close to 1 when estimating stress MBF and CFR in repeated 82Rb studies. The correlation between myocardial flow estimates obtained at rest and during peak stress in 82Rb and 13N-ammonia studies was very good at rest (r2=0.843) and stress (r2=0.761). The Bland-Altman plots show no significant presence of proportional error at rest or stress, nor a dependence of the variations on the amplitude of the myocardial blood flow at rest or stress. A small systematic overestimation of 13N-ammonia MBF was observed with 82Rb at rest (0.129 ml/g/min) and the opposite, i.e., underestimation, at stress (0.22 ml/g/min).
Conclusions
Our results show that absolute quantitation of myocardial bloof flow is reproducible and accurate with 82Rb dynamic cardiac PET as compared to 13N-ammonia. The reproducibility of the quantitation approach itself was very good as well as inter-observer reproducibility.
Keywords: 82Rb cardiac 2D PET, 13N-ammonia cardiac PET, Quantitation of myocardial blood flow
Introduction
PET measures of myocardial blood flow (MBF) (in ml/min/g) and coronary vasodilator reserve provide very sensitive means to evaluate microvascular function in patients without obstructive CAD in a reproducible and accurate manner (1-3). Although quantitation of MBF has been validated for 13N-ammonia and 15O-water as PET flow tracers, it is not performed routinely in the clinic due to the short physical half-life (10 and 2 minutes, respectively) that requires an on-site cyclotron. Rubidium (82Rb), on the other hand, is commonly used for the evaluation of myocardial perfusion and allows the assessment of coronary flow reserve using a column generator (4-10) in clinics which lack a cyclotron and/or other infrastructural support required to produce radionuclides such as 13N ammonia. The short half-life of the radiotracer makes possible rapid rest/stress paired studies within a very short time, allowing rest and stress imaging under virtually identical conditions while shortening the total study duration.
We have previously shown that absolute quantitation of myocardial blood flow (MBF) and coronary flow reserve (CFR) is feasible in humans using dynamic 82Rb PET and factor and compartment analyses (11). This has also been reported by several other groups (e.g., (7,12)). The first aim of the present work was to study the reproducibility of MBF estimates (reproducibility study) in humans and identify the contributions to variability due to patient physiology, processing methods and observer variability. The second aim (validation study) was to compare, in the same subjects, the estimates of myocardial blood flow obtained using 82Rb PET to those using an established perfusion radiotracer, i.e., 13N-ammonia. A generalized form of the least-squares factor analysis of dynamic sequences (FADS) was used to obtain a robust estimate of left and right ventricular (LV+RV) input functions automatically, without the need to draw volumes of interest (VOI), and two- and three-compartment models were used to estimate MBF from dynamic 82Rb and 13N-ammonia, respectively. Next, rest and stress MBF were estimated and the corresponding CFR computed for 82Rb and 13N-ammonia PET.
Materials and Methods
Patient studies
Two separate groups of subjects were recruited for the reproducibility and validation studies in order to limit the total radiation dose delivered to each subject. All studies were approved by the Institutional Review Board of the Brigham and Women's Hospital, Boston, MA and complied with the Helsinki declaration. Written consent was obtained from all subjects who were recruited in the studies. Identical inclusion and exclusion criteria were used for the reproducibility study and the validation study.
Potential subjects with evidence of CAD, as defined by the presence of fixed and/or reversible perfusion defects on clinically indicated PET imaging, were identified through the nuclear cardiology laboratory at Brigham & Women's Hospital and included in the study if they were between 18 and 75 years of age, had fixed and/or reversible perfusion defects on clinically indicated 82Rb PET studies and were willing to provide written informed consent. Healthy volunteers were recruited through printed advertisements. Asymptomatic subjects with a low likelihood of obstructive CAD based on the absence of chest pain, coronary risk factors, and a normal resting ECG, who were willing to provide written informed consent were included in the study.
Subjects that were pregnant or breast feeding, that had documented uncontrolled hypertension (>200/120mmHg) within 30 days, or known contraindications for dipyridamole cardiac stress testing were excluded from the study. The latter included active unstable angina or myocardial infarction, significant cardiac arrhythmias, severe aortic stenosis, decompensated congestive heart failure, acute pulmonary embolism or pulmonary infarction, acute pericarditis, acute aortic dissection, bronchospastic lung disease (e.g. asthma, COPD) with active wheezing, known hypersensitivity to dipyridamole, and administration of oral dipyridamole or theophylline within the preceding 48 hours.
Reproducibility of MBF estimation using 82Rb PET
Twenty-two subjects (11 women and 11 men) were included in the reproducibility study and consisted of 19 healthy volunteers and 3 patients with evidence of coronary artery disease (CAD). All subjects were admitted twice to the Nuclear Medicine Division of the Radiology Department at the Brigham and Women's Hospital within a two-week interval and underwent repeated rest/stress studies. At each visit, they were injected with 50 mCi of 82Rb and imaged dynamically for 6 minutes at rest and during dipyridamole stress (IV infusion of 0.142 mg/kg/min for 4 min, max 60 mg). Following an overnight fast and a 24-hour cessation of all caffeine- or methylxanthine-containing substances, subjects were scanned in 2D mode on a whole body PET-CT scanner with BGO detectors (Discovery ST Lightspeed 64, General Electric Healthcare, Milwaukee, WI). First, a scout CT acquisition (120 kVp, 10 mA) was performed to ensure proper patient positioning, then a CT transmission scan was acquired (140 kVp, 20 mA) for subsequent attenuation correction. Beginning at the time of intravenous (i.v.) bolus administration of 50 mCi (1850 MBq) of 82Rb (Bracco Diagnostics, Princeton, NJ) in 14±6 mL of saline, twenty seven dynamic PET frames were acquired over six minutes as follows: fourteen 5-sec acquisitions were first performed, followed by six 10-sec acquisitions, three 20-sec acquisitions, three 30-sec acquisitions and finally, one 90-sec acquisition. The initial fast frames were used to capture the rapid wash-in and wash-out of 82Rb from the left and right ventricular cavities. Immediately after completion of the rest study, a standard i.v. dipyridamole infusion (0.142 mg/kg/min) was performed for 4 minutes. Three minutes after termination of the dipyridamole infusion, a second dose of 50 mCi (1850 MBq) of 82Rb was injected and dynamic PET frames acquired in the same fashion. A second CT transmission scan (140 kVp, 20 mA) was then acquired for attenuation correction of the stress images. The heart rate, systemic blood pressure, and 12-lead ECG were recorded at baseline and throughout the infusion of dipyridamole. The rate pressure product was calculated as heart rate multiplied by systolic blood pressure. Hemodynamic data are summarized in Table 1.
Table 1.
Subject characteristics and hemodynamic data for the reproducibility study.
| Subject | Age | Gender | Rb-82 study 1 HR (bpm) | Rb-82 study 1 BP (mm Hg) | Rb-82 study 2 HR (bpm) | Rb-82 study 2 BP (mm Hg) |
|---|---|---|---|---|---|---|
| R1 | 64 | M | 55 - 51 | 166 / 59 - 172 / 84 | 49 - 62 | 145 / 70 - 147 / 71 |
| R2 | 55 | M | 58 - 70 | 141 / 78 - 136 / 74 | 57 - 71 | 135 / 73 - 130 / 71 |
| R3 | 55 | F | 72 - 71 | 133 / 70 - 114 / 59 | 67 - 80 | 116 / 64 - 95 / 64 |
| R4 | 56 | M | 58 - 77 | 162 / 79 - 154 / 84 | 62 - 71 | 148 / 82 - 132 / 82 |
| R5 | 51 | M | 78 - 90 | 148 / 83 - 151 / 83 | 65 - 77 | 158 / 83 - 147 / 78 |
| R6 | 41 | F | 77 - 90 | 128 / 57 - 127 / 58 | 64 - 88 | 132 / 66 - 130 / 55 |
| R7 | 38 | M | 75 - 86 | 125 / 68 - 135 / 73 | 73 - 88 | 132 / 59 - 105 / 50 |
| R8 | 45 | M | 50 - 69 | 155 / 76 - 171 / 90 | 54 - 71 | 148 / 75 - 130 / 71 |
| R9 | 24 | F | 64 - 81 | 115 / 69 - 108 / 55 | 61 - 81 | 121 / 58 - 96 / 50 |
| R10 | 28 | F | 76 - 114 | 137 / 73 - 159 / 76 | 85 - 102 | 137 / 67 - 146 / 71 |
| R11 | 63 | M | 62 - 82 | 145 / 76 - 155 / 70 | 66 - 83 | 137 / 65 - 135 / 77 |
| R12 | 49 | F | 62 - 79 | 109 / 54 - 101 / 49 | 61 - 90 | 128 / 66 - 119 / 51 |
| R13 | 68 | M | 64 - 65 | 155 / 79 - 158 / 85 | 64 - 67 | 143 / 79 - 136 / 76 |
| R14 | 55 | F | 61 - 71 | 128 / 64 - 175 / 68 | 60 - 75 | 119 / 60 - 127 / 56 |
| R15 | 47 | F | 78 - 91 | 123 / 69 - 124 / 67 | 66 - 102 | 135 / 44 - NA / 66 |
| R16 | 49 | M | 67 - 89 | 107 / 67 - 109 / 68 | 74 - 89 | 122 / 56 - 133 / 70 |
| R17 | 58 | F | 61 - 71 | 138 / 75 - 147 / 75 | 83 - 100 | 157 / 79 - 157 / 79 |
| R18 | 54 | M | 65 - 90 | 135 / 72 - 129 / 64 | 72 - 88 | 133 / 63 - 138 / 63 |
| R19 | 29 | F | 61 - 74 | 108 / 55 - 110 / 52 | 62 - 90 | 108 / 49 - 89 / 39 |
| R20 | 49 | M | 59 - 90 | 156 / 87 - 171 / 79 | 60 - 80 | 164 / 81 - 154 / 73 |
| R21 | 27 | F | 73 - 103 | 127 / 60 - 127 / 57 | 75 - 96 | 100 / 55 - 96 / 51 |
| R22 | 52 | F | 49 - 55 | 121 / 64 - 120 / 60 | 55 - 80 | 126 / 55 - 122 / 58 |
R: Reproducibilty subject
HR (bpm) : rest heart rate - peak heart rate (bpm)
BP (mm Hg): rest systolic/diastolic blood pressure - peak hyperemia systolic/diastolic blood pressure
NA : Not Available
Comparison of MBF estimation using 82Rb and 13N-ammonia
Twenty patients (8 men, 12 women) were included in the study comparing MBF measured with 82Rb and 13N-ammonia and consisted of 19 healthy volunteers and one CAD patient. All subjects were admitted once to the Nuclear Medicine Division/Radiology Department of the Brigham and Women's Hospital and once to the Nuclear Medicine Division/Radiology Department of the Massachusetts General Hospital within a two-week interval and underwent repeated rest/stress studies. During their first visit, subjects were injected with 50 mCi (1850 MBq) of 82Rb and imaged dynamically for 6 minutes at rest and during dipyridamole stress under identical conditions to those described in the reproducibility study. During their second visit, subjects were injected with a bolus of 25 mCi (925 MBq) of 13N-ammonia and imaged dynamically for 19 minutes at rest and during dipyridamole stress. Subjects were scanned in 2D mode on a PET scanner with BGO detectors (PC-2048, Scanditronix/General Electric Healthcare). Prior to the injection of 13N-ammonia, a transmission scan using a 68Ge source was performed for 10 minutes to ensure correct positioning of the patient within the field of view and to yield the attenuation map that was used to correct for attenuation. Starting at injection of 13N-ammonia, thirty-eight dynamic PET frames were acquired over 19 minutes that consisted of thirty 6-sec acquisitions followed by eight 120-sec acquisitions. Thirty minutes later, a second transmission scan was performed to ensure correct positioning of the patient at stress and to yield the attenuation map at stress, and a standard i.v. dipyridamole infusion (0.142 mg/kg/min) was performed for 4 minutes with injection of a second dose of 13N-ammonia (25 mCi) at 3 minutes after the completion of the dipyridamole infusion. Dynamic frames were started at injection time and acquired for 19 minutes in the same fashion as the rest studies. Hemodynamic data are summarized in Table 2.
Table 2.
Subject characteristics and hemodynamic data for the validation study.
| Subject | Age | Gender | Rb-82 HR (bpm) | Rb-82 BP (mm Hg) | N-13 HR (bpm) | N-13 BP (mm Hg) |
|---|---|---|---|---|---|---|
| V1 | 25 | M | 93 - 100 | 150 / 82 - 152 / 74 | 75 - NA | 115 / 70 - NA |
| V2 | 43 | M | 65 - 64 | 142 / 72 - 151 / 70 | 50 - NA | 118 / 75 - NA |
| V3 | 42 | F | 76 - 92 | 118 / 60 - 149 / 62 | 71 - NA | 116 / 74 - NA |
| V4 | 25 | M | 48 - 72 | 117 / 60 - 109 / 47 | 57 - 86 | 105 / 64 - 95 / 60 |
| V5 | 57 | F | 58 - 77 | 133 / 61 - 150 / 74 | 58 - 86 | 118 / 80 - 115 / 75 |
| V6 | 50 | F | 64 - 71 | 131 / 70 - 127 / 71 | 69 - 89 | 110 / 80 - 108 / 78 |
| V7 | 23 | F | 65 - 92 | 118 / 52 - 103 / 46 | 56 - 101 | 108 / 70 - 104 / 75 |
| V8 | 26 | M | 75 - 99 | 148 / 78 - 124 / 57 | 60 - 94 | 116 / 80 - 144 / 80 |
| V9 | 24 | F | 62 - 104 | 90 / 55 - 100 / 60 | 60 - NA | 114 / NA - NA |
| V10 | 27 | M | 44 - 56 | 118 / 57 - 111 / 52 | 40 - 38 | 105 / 65 - 105 / 65 |
| V11 | 33 | F | 49 - 59 | 134 / 59 - 126 / 57 | 63 - NA | 107 / 70 - NA |
| V12 | 53 | M | 74 - 68 | 178 / 81 - 158 / 81 | NA | NA |
| V13 | 23 | M | 61 - 79 | 148 / 74 - 118 / 53 | 61 - NA | NA |
| V14 | 27 | F | 69 - 107 | 116 / 59 - 115 / 58 | 69 - 114 | 95 / 68 - 100 / 62 |
| V15 | 23 | F | 56 - 75 | 118 / 57 - 112 / 56 | 46 - NA | NA |
| V16 | 37 | F | 62 - 78 | 103 / 56 - 110 / 58 | 59 - NA | 98 - 70 - NA |
| V17 | 53 | F | 64 - 90 | 111 / 57 - 116 / 54 | 68 - NA | 105 / 75 - NA |
| V18 | 34 | F | 71 - 95 | 132 / 67 - 142 / 69 | NA | NA |
| V19 | 37 | M | 51 - 64 | 109 / 48 - 110 / 52 | 60 - NA | 98 / 60 - NA |
| V20 | 24 | F | 70 - 98 | 97 / 43 - 104 / 41 | 62 - NA | 98 / 65 - NA |
V: Validation Subject
HR (bpm) : rest heart rate - peak heart rate (bpm)
BP (mm Hg): rest systolic/diastolic blood pressure - peak hyperemia systolic/diastolic blood pressure
NA : Not Available
Physical corrections and tomographic reconstruction
Dynamic PET sinograms were corrected for scatter, randoms and photoelectric absorption and reconstructed using the clinical protocols used routinely.
82Rb studies
The attenuation map used for correction of the 511 keV photon attenuation was derived from the CT scan using a continuous conversion scale with a range of slopes dependent on the CT kV and the CT number (13). Randoms correction was performed by direct subtraction of delayed events and scatter correction was performed using the scatter modeling approach proposed by Bergstrom et al. (14). All dynamic sinograms were reconstructed using the attenuation weighted-OSEM (21 subsets, 2 iterations, as recommended by the manufacturer) into twenty-six dynamic frames, each being a 128×128×47 volume. No post-filtering was performed. Next, LV and RV input functions were computed using generalized factor analysis of dynamic sequences (see below), and a 2-compartment analysis was carried out for 82Rb, yielding polar MBF parametric maps. The estimation of MBF was performed four independent observers in order to assess inter-observer variability, and estimated separately four times to assess the intra-observer variability. All observers were instructed on a separate teaching dataset how to follow the same rules in selecting a large volume of interest encompassing the heart to perform the factor and compartment analysis study, and to perform the oblique rotations into short axis and long vertical and horizontal axes to estimate the polar map where the compartment analysis was performed. The mean estimates over the four measurements of rest and stress flows were used to assess the variability introduced by the factor+compartment analyses methods. Finally, the reproducibility of the 82Rb imaging itself was assessed by comparing myocardial blood flows measured at rest and peak stress during visits 1 and 2.
13N-ammonia studies
The attenuation map used for correction of the 511 keV photon attenuation was measured at 511 keV using a 10-min transmission scan using a 68Ge source. Randoms correction was performed using delayed events subtraction and scatter correction was performed using the scatter correction approach proposed by Bergstrom et al. All dynamic sinograms were reconstructed using filtered backprojection into thirty-eight dynamic frames, each being a 128×128×47 volume. No post-filtering was performed. Next, LV and RV input functions were computed using generalized factor analysis of dynamic sequences (see below), and a 3-compartment analysis was carried out for 13N-ammonia, yielding polar MBF parametric maps.
Generalized Factor Analysis of Dynamic Sequences (GFADS)
We have previously developed and validated a generalized factor analysis of dynamic sequences (GFADS) approach that addressed the non-uniqueness problem in cardiac PET by penalizing spatial overlap between factor images (11). In short, in our approach, FADS was first performed and overlap between factor images was eliminated in a second step by modifying the factors and factor images obtained in the first step to minimize the non-negative term that penalizes the overlap between images of factor coefficients while keeping the matrix product of factor and factor images constant. In the present work, we use GFADS to obtain a robust estimate of left (LV) and right (RV) ventricular input functions automatically, without the need to draw volumes of interest, for the 82Rb and 13N-ammonia compartment analyses. Therefore, the time activity curve in each voxel was modeled as a combination of 3 contributions: the contribution from myocardial tissue, modeled using a compartment analysis, and contributions from left and right ventricular cavities, modeled as fractions of measured LV and RV functions.
Compartment analysis
Following the estimation of the left and right ventricle input functions, the cardiac volume was semi-automatically rotated using software developed in our group (see QDA section below) into the usual short axis, long vertical axis planes and the 17-segment polar map computed according to the AHA consensus (15). Finally, the kinetic parameters associated with the 82Rb and 13N-ammonia compartment models were estimated in the 17 segments of the polar yielding a parametric myocardial blood flow polar map, and grouped into the three major coronary territories to allow easy estimation of regional myocardial blood flow within each coronary territory.
82Rb
A two-compartment model was used for 82Rb to allow for accurate estimation of myocardial extraction fraction because the latter is only partially extracted by the myocardium (16). The two compartments of the model are the “free rubidium space” (blood perfusing the myocardium plus interstitial space) and the “trapped rubidium space” (muscle of the myocardium). The main parameters of the model are the kinetic transport constants K1 (mL/min/g) and k2 (min-1), which denote the extraction (forward) and egress (backward) rates of transport between the metabolically trapped space (myocardium) and the freely diffusible space (blood pool), respectively. In order to estimate myocardial blood flow (MBF) from measures of K1, we used the extraction fraction (E) reported previously by Yoshida et al. (17) in open-chest dogs as:
| Eq. 1 |
Equation 1 was solved for MBF using the fixed point iteration approach (18). Since the equation is not solvable for high values of MBF, we used the following linear extrapolation for K1 > 0.92 ml/g/min:
| Eq. 2 |
The tissue time activity curve in each voxel, CT(t), was modeled as a combination of 3 contributions: the contribution from myocardial tissue, modeled using a two-compartment model, and contributions from left and right ventricular cavities, modeled as fractions of measured left (LV) and right (RV) ventricle functions:
| Eq. 3 |
where CTi (t) is the value of the polar map sector i (1 ≤ i ≤ 17) at time t, CTi is the time activity curve of sector i, Ca (t) is the measured left ventricle input function, and Cr (t) is the measured right ventricle input function, k2i, fyi, and rvi are the kinetic parameters for sector i, where K1i [mL/min/g] characterizes myocardial tissue extraction (inflow), k2i [min-1] characterizes myocardial tissue egress (outflow), fvi [dimensionless] represents the contribution to the total activity from the blood input function Ca (t), and rvi [dimensionless] represents the contribution from the activity in the right ventricle, Cr (t), which in general differs from the input function Ca (t). Both Ca (t) and Cr (t) were determined by GFADS.
13N- ammonia
A three-compartment model was implemented for 13N-ammonia based on the work of Muzik et. al. which had been validated in dog studies (2). The model assumes three compartments: Arterial Blood, interstitial and free cellular space, and metabolic space (Figure 1). The activity concentration in arterial blood in the left ventricle is denoted Ca(t) (respectively Cr(t) in the right ventricle), that in interstitial and free cellular space CE(t) and that in metabolic space CG(t). We denote CTi(t) the value of the tissue time activity curve at time t in polar map sector i (1 ≤ i ≤ 17). The same formalism as for 82Rb was used with K1i (ml/g/min), k2i (1/min), and k3i (1/min) as the kinetic parameters of the 13N-ammonia compartment model. The tissue time activity curve CTi(t) can be expressed as:
FIGURE 1.

Compartment models used for 82Rb and 13N-ammonia. Figure represents kinetic model that was used for analysis of the ammonia data. Ca(t) corresponds to activity concentration in arterial blood, CE(t) activity concentration in interstitial and free cellular space, and CG(t) in metabolic space. K1, k2, and k3 are kinetic parameters of the model in expressed in units of ml/min/g, 1/min, and 1/min, respectively.
| Eq. 4 |
where fvi and rvi correspond to the fraction of input from left and right ventricle in the tissue and, therefore, model vascular fraction in the tissue and spillover from left and right ventricles. Differential equations corresponding to the model presented in Figure 1 were solved using the fourth order Runge-Kutta approach (19). Non-linear optimization of kinetic parameters (K1i, k2i, k3i, fvi, rvi) was performed using Marquardt least squares method. As validated and reported by Muzik et al. (2), extraction fraction for the range of blood flows in our study can be assumed to be one. Thus, blood flow was calculated as the value of K1.
Quantitative Dynamic Analysis (QDA) software
All image processing and display was performed using the Quantitative Dynamic Software (QDA) developed in our group. Figure 2 summarizes the main steps to obtain image-derived input functions using factor analysis and quantitative estimates of myocardial blood flow using the appropriate kinetic models for 82Rb and 13N-ammonia. Reconstructed dynamic PET frames were transferred to a personal computer using the DICOM communication protocol, read in their native format, and displayed in the transverse, coronal and sagittal planes, while allowing navigation through all frames. An active 3D ellipsoid allowed the user to select the deformable/modifiable volume of interest where all analyzes were performed. In the second step, a single value decomposition was performed to ensure that most of the variance can be explained by the first three eigenvectors corresponding to the left and right ventricle blood pools and myocardial muscle. An oblique analysis was performed next, where the user specified, in dialogue boxes that appear based on the context menu, the number of factors to be considered. Once the factor analysis was performed (a few seconds), the factors and corresponding factor images were displayed and the user was prompted to identify the left and right ventricle factors. Next, oblique rotations of the heart were performed (second row) and the short, long vertical and long horizontal axes were determined with minimal graphical interaction from the user. The polar map was then estimated automatically with minor input from the user for verifying that the circular profiles fell within the myocardium. Finally, the kinetic analysis was performed. The users' input consisted in choosing the parameters of the kinetic model (i.e., type of study (13N ammonia, 82Rb), number of compartments, etc.). The result is a parametric 17-segment polar map, according to the AHA consensus (15). The three major coronary arteries (LAD, LCX, RCA) were overlayed to the polar map to allow direct reading of the mean flow within each coronary territory.
FIGURE 2.
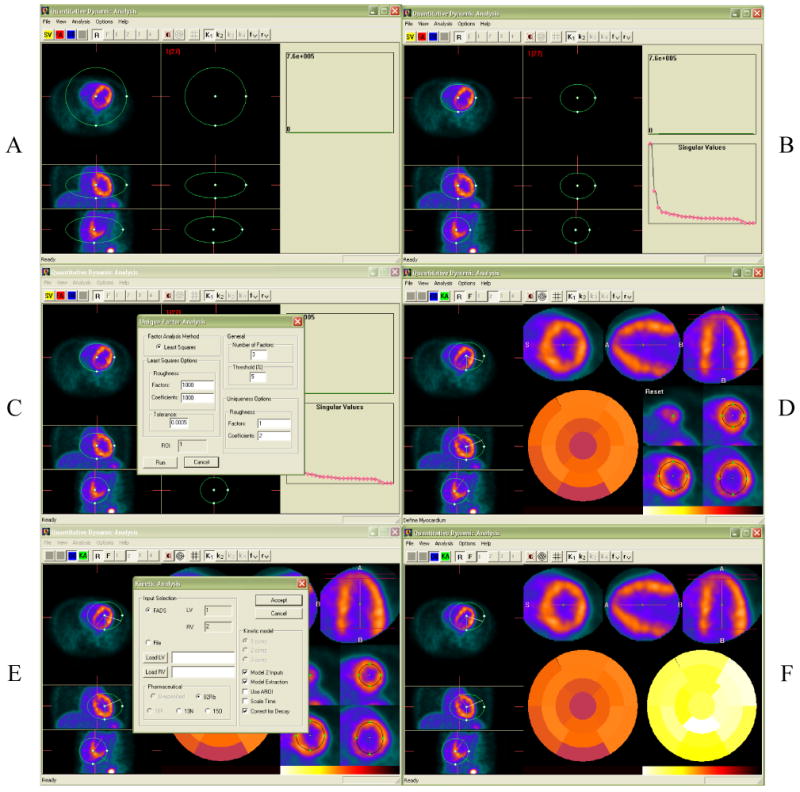
Steps involved in the Quantitative Dynamic Analysis (QDA) of 82Rb and 13N-ammonia studies. A. Selection of cardiac volume of interest; B. Single value decomposition; C. Factor analysis of dynamic sequences; D. Oblique rotations into short, long vertical and long horizontal axes, and polar map. E. Compartment analysis; F. Parametric polar map of myocardial blood flow.
Statistical analysis
All image processing and display was performed using the Quantitative Dynamic Software (QDA) developed in
Results
Figure 3 displays the correlation plots of rate pressure products (RPP), calculated as the product of heart rate by systolic blood pressure, for subjects who participated in the reproducibility and validation studies. In the reproducibility study, RPP measured during the first 82Rb PET imaging session at rest (respectively at stress), are plotted against the RPP measured during the second imaging session at rest (respectively at stress). In the validation study the RPP at rest and stress calculated for 82Rb are plotted against those measured for 13N-ammonia. The correlation between repeated 82Rb studies at rest (r2=0.258) and stress (r2=0.293) were poor as compared to the correlation between 82Rb and 13N-ammonia at rest (r2=0.472) and stress (r2=0.799). This poor correlation can be explained by the different anxiety level of healthy volunteers when coming for a repeated scan as compared to a first time visit to the PET center (Marcelo?).
FIGURE 3.

Rest and stress rate pressure products in 82Rb and 13N-ammonia studies. A. 82Rb rest studies 1 and 2 (reproducibility); B. 82Rb stress studies 1 and 2 (reproducibility); C. 82Rb and 13N-ammonia rest studies (validation); D. 82Rb and 13N-ammonia stress studies (validation);
Figure 4 shows an example of 82Rb and 13N-ammonia stress studies performed in the same subject. Transverse, coronal and sagittal slices as well as short axis, long vertical and horizontal axes are shown along with the polar maps of relative perfusion and absolute myocardial blood flow. Note the good visual agreement between the two studies and the loss of spatial resolution in the 82Rb PET study as compared to the 13N-ammonia study which is mainly due to the greater positron range of 82Rb (FWHM = 1.6 mm) as compared to 13N-ammonia (∼0.28 mm).
FIGURE 4.
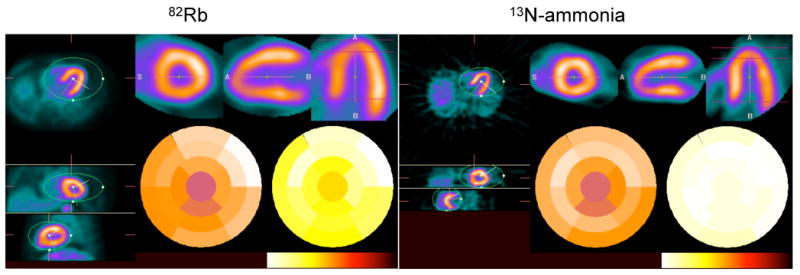
Transverse, coronal and sagittal (left) as well as short, long vertical and horizontal axes (top right) 82Rb and 13N-ammonia stress studies in the same subject. Polar maps of relative perfusion and absolute myocardial blood flow are also shown (bottom right).
Figure 5 shows the variability in myocardial blood flow estimation, at rest and stress that can be imputed to the factor analysis and compartment analysis. The reproducibility of the processing (factor+compartment analysis) was estimated by asking one observer to repeat eight times the estimation of myocardial blood flows at rest and stress in each subject and computing the correlation between the mean values measured in the first four estimations and the last four estimations. This allowed us to minimize the contribution of observer variability (by averaging multiple estimates) and eliminate biological variability (same study was processed eight times). Our results show excellent reproducibility of our quantitative dynamic approach based on factor and compartment analysis for estimation of myocardial blood flow with 82Rb with correlations greater than 0.97 at rest and stress as well as coronary flow reserve estimation. The coefficient of repeatability (CR) was 1.7% for estimation of MBF at rest, 1.4% for MBF at peak stress and 2.8% for CFR estimation. The inter-observer reproducibility between the four observers that participated in this study was also very good with correlation coefficients greater than 0.87 between any two given observers when estimating coronary flow reserve (Figure 6). Similar results were obtained for estimation of MBF at rest and stress.
FIGURE 5.

Variability of factor+compartment analyses estimation of rest (top left) and stress (top right) myocardial blood flows and coronary flow reserve (bottom) with 82Rb.
FIGURE 6.

Inter-observer variability of coronary flow reserve with 82Rb.
Figure 7 shows the correlation between myocardial flow estimates obtained at rest and during peak stress in repeated 82Rb studies, as well as the corresponding Bland-Altman plots (20). The reproducibility of MBF estimates at rest was reasonable (r2=0.500) and excellent at stress (r2=0.835). Likewise, the reproducibility of CFR estimation in repeated studies was very good (r2=0.825). Furthermore, the slope of the correlation line was very close to 1 (0.996 and 0.978) when estimating stress MBF and CFR in repeated 82Rb studies. The rest myocardial blood flow was obtained by normalizing the measured MBF to the rate pressure product in order to take into account the rest hemodynamic status of each subject. The coefficient of repeatability (CR) computed from the Bland-Altman plots was 15.2% for rest MBF and 16.0% for stress MBF and CFR. Furthermore, all differences between estimates obtained in visits one and two were within mean ± 1.96 standard deviations for both rest and stress MBF, and no absolute systematic error was observed.
FIGURE 7.
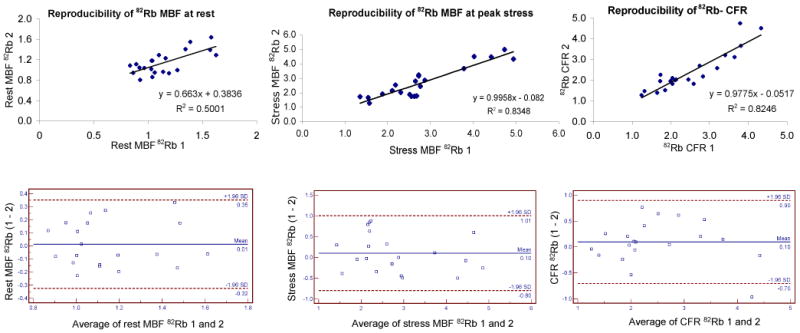
Reproducibility of rest (top left) and stress (top right) myocardial blood flows and coronary flow reserve (bottom) measured with 82Rb at two visits.
Figure 8 shows the correlation between myocardial flow estimates obtained at rest and during peak stress in 82Rb and 13N-ammonia studies. Very good correlations were obtained between the in 82Rb and 13N-ammonia studies at rest (r2=0.843) and stress (r2=0.761). Again, rest MBF were normalized to rate pressure product using hemodynamic data measured during the 82Rb and 13N-ammonia studies. The Bland-Altman plots show no significant presence of proportional error at rest or stress, nor a dependence of the variations on the amplitude of the myocardial blood flow at rest or stress. Furthermore, all differences between estimates obtained in visits one and two were within mean ± 1.96 standard deviations for both rest and stress MBF. A small systematic overestimation of 13N-ammonia MBF was observed with 82Rb at rest (0.129 ml/g/min) and the opposite, i.e., underestimation, at stress (0.22 ml/g/min).
FIGURE 8.
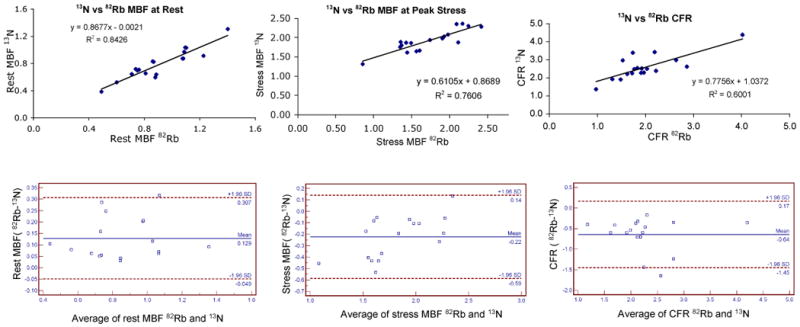
Comparison of rest (top left) and stress (top right) myocardial blood flows and coronary flow reserve (bottom) measured with 82Rb and 13N-ammonia.
Discussion
We report in this work on the reproducibility of quantitation of myocardial blood flow using 82Rb dynamic PET and compare its performance to that of 13N-ammonia dynamic PET. The demonstration of reproducibility of MBF estimates with 82Rb is crucial before it could be used in clinical routine, as it ensure robust comparison of MBF between patients and for a given patient at different visits. Our results show that estimation of MBF with dynamic 82Rb PET is highly reproducible when using generalized factor analysis to automatically estimate the left and right ventricle input functions and compartment analysis while modeling the extraction fraction for 82Rb as a function of flow over a wide range of myocardial blood flows (0.7 ml/g/min up to 5 ml/g/min). Furthermore, our results show that 82Rb flow estimates correlated very well with 13N-ammonia flow estimates over a flows that ranged between 0.5 ml/g/min and 2.5 ml/g/min. The lower maximum flow values observed in the validation study as compared to the reproducibility study can be partly explained by the greater mean age of the subjects participating in the reproducibility study (48 years) as compared to the validation study (34 years). It is also due partly to the greater percentage of CAD patients in the reproducibility study (14%) as compared to the validation study (5%).
Several authors have measured the extraction fraction in animal models (17,21,22) and we have previously reported reasonable agreement among these models over the flow range of interest for normal subjects and patients with mild coronary artery disease (e.g., 1 ≤ flow ≤ 3.5 mL/g/min) as is the case in our present work (23). This is consistent with our results that showed good agreement between MBF estimates at rest and during peak stress measured with 82Rb and 13N-ammonia PET.
We used the generalized factor analysis of dynamic sequences approach we have previously reported in the case of 82Rb (11) to estimate non-invasively the left and right input functions from the dynamic 82Rb and 13N-ammonia PET studies that were used for the subsequent kinetic analysis. After fitting the time-varying factor model to the dynamic data using a least-squares objective function, a different objective function which penalized spatial overlap between factor images was minimized. Our approach does not require a priori knowledge of the kinetics and can be used in other dynamic imaging applications such as 15O-water, etc. Furthermore, our approach does not require drawing of volumes of interest in order to obtain the left and right ventricle input functions. This is a major advantage as it obviates the need for manual intervention in the quantitation scheme, except for an initial definition of a volume comprising the heart, and makes it reproducible as was shown in the reproducibility analysis presented in this work. Although the number of factors must be defined before performing GFADS, we have found that P=3 always yielded robust estimates of the LV and RV input functions in all patient studies included in this work, as well as in more than 100 patient studies performed in our clinic. This is consistent with the fact that the first three eigenvectors, obtained by principal component analysis, were consistently several times greater than the other eigenvectors.
Conclusion
Our results show that absolute quantitation of myocardial bloof flow is reproducible and accurate with 82Rb dynamic cardiac PET as compared to 13N-ammonia. The reproducibility of the quantitation approach itself was very good as well as inter-observer reproducibility. The reproducibility of MBF in repeated 82Rb studies was very good with slopes of the correlation lines very close to unity. The correlations between myocardial flow estimates obtained at rest and during peak stress in 82Rb and 13N-ammonia studies was also very good with no significant presence of proportional errors, nor a dependence of variations on the amplitude of the myocardial blood flow over the range of myocardial blood flows considered in the study.
Acknowledgments
The authors would like to thank Ms. Martha Coughlan and Lisa Cantagallo, for their help collecting the patient data. This work was supported in part by grants from the National Institutes of Health (RO1-EB005876), the American Heart Association (GIA-655909T), and Bracco Diagnostics. The contents of this paper are the responsibility of the authors and do not represent the views of the NIH or AHA.
References
- 1.Kuhle W, Porenta G, Huang SC, Buxton D, Gambhir S, et al. Quantification of regional myocardial blood flow using 13N-ammonia and reoriented dynamic positron emission tomographic imaging. Circulation. 1992;86:1004–1017. doi: 10.1161/01.cir.86.3.1004. [DOI] [PubMed] [Google Scholar]
- 2.Muzik O, Beanlands RS, Hutchins GD, Mangner TJ, Nguyen N, Schwaiger M. Validation of nitrogen-13-ammonia tracer kinetic model for quantification of myocardial blood flow using PET. J Nucl Med. 1993;34:83–91. [PubMed] [Google Scholar]
- 3.Nitzsche EU, Choi Y, Czernin J, Hoh CK, Huang SC, Schelbert HR. Noninvasive quantification of myocardial blood flow in humans. A direct comparison of the [13N]ammonia and the [15O]water techniques. Circulation. 1996;93:2000–2006. doi: 10.1161/01.cir.93.11.2000. [DOI] [PubMed] [Google Scholar]
- 4.Gould KL, Goldstein RA, Mullani NA, Kirkeeide RL, Wong WH, et al. Noninvasive assessment of coronary stenoses by myocardial perfusion imaging during pharmacologic coronary vasodilation. VIII. Clinical feasibility of positron cardiac imaging without a cyclotron using generator-produced rubidium-82. J Am Coll Cardiol. 1986;7:775–789. doi: 10.1016/s0735-1097(86)80336-9. [DOI] [PubMed] [Google Scholar]
- 5.Gould KL. Clinical cardiac PET using generator-produced Rb-82: a review. Cardiovasc Intervent Radiol. 1989;12:245–251. doi: 10.1007/BF02575408. [DOI] [PubMed] [Google Scholar]
- 6.Herrero P, Markham J, Shelton ME, Weinheimer CJ, Bergmann SR. Noninvasive quantification of regional myocardial perfusion with rubidium-82 and positron emission tomography: exploration of a mathematical model. Circulation. 1990;82:1377–1386. doi: 10.1161/01.cir.82.4.1377. [DOI] [PubMed] [Google Scholar]
- 7.Dahl J, Muzik O, Wolfe ER, Allman C, Hutchins G, Schwaiger M. Myocardial rubidium-82 tissue kinetics assessed by dynamic positron emission tomography as a marker of myocardial cell membrane integrity and viability. Circulation. 1996;93:238–245. doi: 10.1161/01.cir.93.2.238. [DOI] [PubMed] [Google Scholar]
- 8.Chen EQ, MacIntyre WJ, Fouad FM, Brunken RC, Go RT, et al. Measurement of cardiac output with first-pass determination during rubidium-82 PET myocardial perfusion imaging. Eur J Nucl Med Mol Imag. 1996;23:993–996. doi: 10.1007/BF01084378. [DOI] [PubMed] [Google Scholar]
- 9.deKemp RA, Ruddy TD, Hewitt T, Dalipaj MM, Beanlands RSB. Detection of serial changes in absolute myocardial perfusion with Rb-82 PET. J Nucl Med. 2000;41:1426–1435. [PubMed] [Google Scholar]
- 10.Knesaurek K, Machac J, Krynyckyi BR, Almeida OD. Comparison of 2-dimensional and 3-dimensional Rb-82 myocardial perfusion PET imaging. J Nucl Med. 2003;44:1350–1356. [PubMed] [Google Scholar]
- 11.El Fakhri G, Sitek A, Guérin B, Kijewski MF, Di Carli MF, Moore SC. Quantitative dynamic cardiac 82Rb-PET imaging using generalized factor and compartment analyses. J Nucl Med. 2005;46:1264–1271. [PubMed] [Google Scholar]
- 12.Lin JW, Sciacca RR, Chou RL, Laine FA, Bergmann SR. Quantification of myocardial perfusion in human subjects using 82Rb and wavelet-based noise reduction. J Nucl Med. 2001;42:201–208. [PubMed] [Google Scholar]
- 13.Burger C, Goerres G, Schoenes S, Buck A, Lonn AHR, von Schulthess GK. PET attenuation coefficients from CT images: experimental evaluation of the transformation of CT into PET 511-keV attenuation coefficients. Eur J Nucl Med Mol Imag. 2002;29:922–927. doi: 10.1007/s00259-002-0796-3. [DOI] [PubMed] [Google Scholar]
- 14.Bergstrom M, Eriksson L, Bohm C, Blomqvist G, Litton J. Correction for scattered radiation in a ring detector positron camera by integral transformation of the projections. J Comput Assist Tomogr. 1983;7:42–50. doi: 10.1097/00004728-198302000-00008. [DOI] [PubMed] [Google Scholar]
- 15.Cerqueira MD, Weissman NJ, Dilsizian V, Jacobs AK, Kaul S, et al. Standardized myocardial segmentation and nomenclature for tomographic imaging of the heart: A statement for healthcare professionals from the Cardiac Imaging Committee of the Council on Clinical Cardiology of the American Heart Association. J Nucl Cardiol. 2002;9:240–245. doi: 10.1067/mnc.2002.123122. [DOI] [PubMed] [Google Scholar]
- 16.Gould KL. Coronary artery stenosis and reversing atherosclerosis. New York: 1999. Absolute myocardial perfusion and coronary flow reserve; pp. 247–273. [Google Scholar]
- 17.Yoshida K, Mullani NA, Gould KL. Coronary flow and flow reserve by PET simplified for clinical application usaing rubidium-82 or nitrogen-13-ammonia. J Nucl Med. 1996;37:1701–1712. [PubMed] [Google Scholar]
- 18.Leader J. Numerical Analysis and Scientific Computation. Addison Wesley; 2004. Pages. [Google Scholar]
- 19.Press WH, Teukolsky SA, Vettering WT, Flannery BP. The art of scientific computing. Cambridge: Cambridge University Press; 1992. Numerical recipes in C. Pages. [Google Scholar]
- 20.Bland JM, Altman DG. Measuring agreement in method comparison studies. Statistical Methods in Medical Research. 1999;8:135–160. doi: 10.1177/096228029900800204. [DOI] [PubMed] [Google Scholar]
- 21.Mullani NA, Goldstein RA, Gould KL, Marani SK, Fisher DJ, et al. Myocardial perfusion with rubidium-82: I. Measurement of extraction fraction and flow with external detectors. J Nucl Med. 1983;24:898–906. [PubMed] [Google Scholar]
- 22.Marshall RC, Taylor SE, Powers-Risius P, Reutter BW, Kuruc A, et al. Kinetic analysis of rubidium and thallium as deposited myocardial blood flow tracers in isolated rabbit heart. Am J Physiol. 1997;272:H1480–H1490. doi: 10.1152/ajpheart.1997.272.3.H1480. [DOI] [PubMed] [Google Scholar]
- 23.Moore SC, El Fakhri G. Principles of quantitation in cardiac PET. In: Di Carli MF, Lipton MJ, editors. Cardiac PET and PET/CT imaging. New York: 2007. pp. 46–70. [Google Scholar]