

Abstract
Poly-Histidine (His) affinity tags are routinely employed as a convenient means of purifying recombinantly expressed proteins. A tacit assumption is commonly made that His tags have little influence on protein structure and function. Attachment of a His tag to the N terminus of the robust globular protein myoglobin leads to only minor changes to the electrostatic environment of the heme pocket, as evinced by the nearly unchanged FT-IR spectrum of CO bound to the heme of His-tagged myoglobin. Experiments employing 2D IR vibrational echo spectroscopy of the heme bound CO, however, find that significant changes occur to the short time scale (ps) dynamics of myoglobin as a result of His tag incorporation. The His tag mainly reduces the dynamics on the 1.4 ps timescale and also alters protein motions of myoglobin on the slower, >100s ps timescale, as demonstrated by the His tag's influence on the fluctuations of the CO vibrational frequency, which reports on protein structural dynamics. The results suggest that affinity tags may have effects on protein function and indicate that investigators of affinity tagged proteins should take this into consideration when investigating the dynamics and other properties of such proteins.
Affinity tags have greatly eased the difficulty of obtaining high quantities of purified proteins for biophysical and biochemical studies.(1-3) While a variety are available, ranging from large protein fusions to short peptide sequences, the poly-Histidine tag (His) tag is the most widely utilized.(4) It involves the introduction of only a short, frequently six, His sequence that enables the purification of proteins by metal affinity chromatography. The affinity tags may be optionally removed by the insertion of a protease recognition sequence; however, the reactions often show low efficiency, require large quantities of costly enzymes, introduce an additional purification step for protease removal, and can lead to side reactions at unwanted protein sites.(5-7) Due to these drawbacks, His tags are frequently retained.(8-12) The addition of a His tag is commonly assumed to result in negligible perturbation to the protein structure and function. While evidence suggests this is often true,(13) in some cases His tag introduction has caused alterations in protein structure or interference with binding interactions.(14-23)
A His tag was introduced for facile purification of recombinant sperm whale myoglobin (His6Mb), perhaps the most extensively studied protein, which reversibly binds oxygen and other small polyatomic molecules (Figure 1). When CO is bound to Mb (MbCO) and other heme proteins, its IR absorption is intense and highly sensitive to the protein electrostatic environment.(24-31) Because of this the IR spectrum of CO has long been analyzed for characterization of heme protein conformations and for identification of features of the heme pocket environment that may be associated with function.(24, 25) In addition to its use in structural studies, the CO vibration provides a convenient probe for measuring the dynamics in heme proteins.(12, 30, 32-36) Protein structural fluctuations throughout the protein lead to corresponding fluctuations in the CO vibrational frequency. The technique of 2D IR vibrational echo spectroscopy can be used to measure the timescales and amplitudes of these frequency fluctuations, and thus characterize the dynamics of the CO's protein environment. MbCO in particular has been a workhorse for our development of 2D IR vibrational echo spectroscopy for the study of dynamics in proteins.(37-47)
Figure 1.

Structure of sperm whale myoglobin (pdb 1bzr) with bound CO ligand. Site of N-terminal His6 affinity tag placement shown by red arrow.
Due to the high sensitivity of the CO vibrational spectrum to protein structure, particularly in or near the heme pocket, any large perturbation to the Mb structure as a result of His tag introduction should to lead to significant changes in the CO spectrum. Very little change is observed in the FT-IR spectrum of MbCO upon introduction of the His tag, suggesting the placement of the His tag at the N-terminus of Mb, located far from the heme pocket and bound CO (Figure 1), has little influence on the heme pocket structure of such of robust, globular protein. Here we report a comparison of the picosecond timescale dynamics of the MbCO and His6MbCO measured with 2D IR vibrational echo spectroscopy. Although the CO vibrational spectrum is virtually unchanged with the addition of the His tag, the dynamics of His6MbCO differ significantly from those of the untagged protein. These results underscore the care that must be taken in studies of the dynamics and other biophysical properties of His-tagged proteins, particularly with spectroscopic techniques that are sensitive to protein structural fluctuations.
II. Experimental Procedures
Sperm whale Mb with an N-terminal His6 tag and TEV cleavage site (MGHHHHHHENLYFQG) was cloned into the pBad vector (Invitrogen) behind the arabinose promoter. The His6Mb was purified using Ni-chelation chromatography. Unmodified, recombinantly expressed sperm whale Mb (95-100 % pure in a 0.02 M Tris-Cl, pH 8 solution) was purchased from Sigma. Both protein samples were exchanged into PBS containing 50% (w/v) glycerol, added to reduce the background IR absorbance for the 2D IR experiments. For FT-IR and 2D IR experiments, the protein samples were concentrated to 7 mM, clarified through 45 μm filters, and reduced with tenfold excess sodium dithionite. It has been shown that myoglobin does not form dimers at concentrations as high as 9 mM.(48) The possibility of dimer formation for His6Mb will be discussed below. The protein samples were placed between two CaF2 windows separated by a 50 μm Teflon spacer. UV/visible and CD spectra of His6Mb were also acquired in on a Cary 3E and Aviv 62A DS spectrometers, respectively.
Linear FT-IR spectra were acquired at 1 cm-1 resolution on a Bruker Vertex 70 spectrometer. The time-resolved infrared experiments were performed as previously described(29, 49) with 120 fs, ∼5 μJ pulses at 1945 cm-1 generated with an ultrafast mid-IR laser system consisting of a Ti:Sapphire oscillator/regenerative amplifier pumped optical parametric amplifier. Briefly, the 2D IR echo experiments involved application of three mid-IR light pulses to the sample (∼0.8 μJ per pulse at the sample) with the times between the first and second pulse and the second and third pulse referred to as τ and Tw, respectively.(49) At a time ≤ τ after the third pulse, a vibrational echo is emitted by the sample in a unique direction. The vibrational echo pulse is overlapped with another IR pulse, called the local oscillator, for heterodyne detection and to provide phase information for the vibrational echo signal. The combined vibrational echo/local oscillator pulse is passed through a monochromator onto an IR array detector, which records a spectrum that yields the ωm frequency axis (vertical axis), the axis of vibrational echo emission. Scanning τ produces an interferogram at each ωm. These interferograms are then Fourier transformed to produce the second, ωτ axis (horizontal axis) of the 2D IR spectrum. In the experiments, τ is scanned for fixed Tw to produce a 2D IR spectrum. Tw is then changed, and τ is again scanned to produce another 2D IR spectrum. The change in the spectra with Tw provides the dynamical information about the system.
Pump probe experiments are also performed to determine the vibrational lifetimes and for use in processing the 2D IR data. An ∼3.5 μJ pump pulse is followed by a variably delayed, ∼0.4 μJ probe pulse. The pump-induced changes in the probe beam spectrum at each time delay were measured by dispersing the transmitted probe beam through the monochromator onto the array detector.
C. Data Analysis
The linear FT-IR spectra were background-corrected by subtracting the solvent FT-IR spectrum, followed by fitting and subtracting a polynomial function to the spectral regions away from the CO band. This function was used to make small residual base line corrections. The resulting spectra were then fit to a sum of Gaussian functions. The time-resolved pump probe spectra were used to determine the vibrational lifetimes (T1) of the CO in the His-tagged and unmodified Mb. At each frequency of a spectrum, the pump-induced difference in the probe beam intensity as function of the probe delay time was fit to an exponential decay.
Protein structural fluctuations cause the CO stretch frequency to evolve in time (spectral diffusion). The frequency-frequency correlation function (FFCF) connects the waiting time (Tw) dependent changes in the 2D band shapes caused by spectral diffusion to the time dependence of the structural changes of the proteins. The center line slope (CLS) method is used to determine the FFCF from 2D and linear spectra.(50, 51) This method provides an accurate way to extract the FFCF and also provides a useful quantity to plot.(50, 51) At a particular ωτ, a slice through the 2D spectrum, projected onto the ωm axis, is a spectrum with a peak at a particular ωm value. Many such slices taken over a range of ωτ values produce a set of points. Connecting the resulting points yields the center line. In the absence of a homogeneous contribution, at Tw = 0 the slope of the center line would be 1. At sufficiently long time, when spectral diffusion has sampled all frequencies within the absorption spectrum, the 2D IR line shape would be circular, and the center line would be horizontal with a slope of zero. It has been shown theoretically that the Tw-dependent part of the normalized FFCF is directly related to the Tw dependence of the slope of the center line.(50, 51) Thus the slope of the center line, the CLS, will vary between a maximum of 1 at Tw = 0 and 0 in the limit of sufficiently long waiting time. The presence of a homogeneous contribution to the spectrum causes the initial value of the slope to be less than 1 at Tw = 0 (see below).
The multiple time scale dynamics were modeled by a multiexponential form of the FFCF, C(t).
| (1) |
For the ith dynamical process, Δi is the range of CO frequencies sampled due to protein structural fluctuations, and τi is the time constant of these fluctuations. This form of the FFCF has been widely used and in particular found applicable in studies of the structural dynamics of heme-CO proteins.(12, 29, 32, 33, 45, 47, 52-54) The experimental time window is limited by the vibrational lifetime decay to several times T1, the vibrational lifetime, which reduces the signal to zero. Occurrence of very slow structural fluctuations on timescales longer than the experimental time window, if present, will appear as one of the τi = ∞ in the FFCF. This term is referred to as the “static” component. The corresponding Δi is the amplitude of the static component, that is, the amplitude of the component of the fluctuations that are on a time scale long compared to the experimental time window.
If Δτ < 1 for one component of the FFCF, then Δ and τ cannot be determined separately, but rather give rise to a motionally narrowed homogeneous contribution to the absorption spectrum with pure dephasing width given by where is the pure dephasing time, and Γ is the pure dephasing linewidth. The total homogeneous dephasing time, T2, also has contributions from the vibrational lifetime. T2 is given by
| (2) |
Detailed procedures for converting the CLS measurement into the FFCF have been described previously.(50, 51) By combining the CLS with the linear absorption spectrum, the full FFCF is obtained including the homogeneous component. Then using the vibrational lifetime, and Γ are obtained from Equation 2.
III. Results and Discussion
The center frequency of the CO vibration in heme proteins is particularly sensitive to the local environment.(24-28) In MbCO, with the imidazole side group of the distal residue His64 in the pocket, there are two peaks, denoted A1 and A3, that have been attributed to different configurations of the imidazole relative to the CO.(29, 31, 32) Figure 2 displays the FT-IR absorption spectrum of unmodified MbCO (panel A) and His6MbCO (panel B) along with fits to a sum of Gaussians functions (dashed lines). The fit provides the center frequency and linewidth of the bands composing the spectra. As expected, the spectrum of unmodified MbCO contains two distinct overlapping bands, a very strong band at 1945 cm-1 (A1 band) and a band at 1934 cm-1 (A3 band) approximately half in total integrated area.
Figure 2.

FT-IR spectra of (A) MbCO and (B) His6MbCO. Gaussian fits are shown as dashed lines. The inset in (B) shows a 30X expanded view (1960-1975 cm-1) of the A0 band.
Comparing the spectra of Figure 2, the FT-IR spectra of His6MbCO and MbCO appear almost identical. The His6MbCO spectra shows two bands reflecting the A1 and A3 states with the same relative populations observed in the MbCO spectra. These two bands are believed to result from only a small change in the orientation of the side chain of His64, illustrating the high sensitivity of the FT IR spectrum to Mb heme pocket structure. The only difference observed in the His6MbCO spectrum is a contribution from a very small band at 1964 cm-1. While the band is clearly apparent and outside the spectral noise (see inset, Figure 2), it only constitutes 2% of the total integrated area of the spectrum. A band of similar frequency, denoted the A0 state, is found in some Mb variants and when the sperm whale protein is in acidic conditions.(25, 55, 56) The A0 state is believed to reflect a conformation in which a protonated His64 side chain is rotated out of the heme pocket. Thus, the FT-IR spectra indicate that the introduction of the His tag leads to very minor changes in the heme pocket environment, only slightly increasing the population of the A0 structure. In comparison, FT IR spectra of mutant MbCO proteins show dramatic changes in the frequencies and relative amplitudes of the composite bands.(57) Furthermore, no change in protein structure due to His tag incorporation is evident from the His6MbCO UV/visible spectra, and the CD spectra is consistent with a largely helical protein (shown in Supporting Information).
2D IR spectra of MbCO and His6MbCO were obtained for varying Tw times to examine the dynamics in presence and absence of the His tag (Figure 3). All spectra show peaks due to the 0-1 transitions along the diagonal (red) as well as negative peaks (blue), which arise from vibrational echo emission at the 1-2 transition frequencies and are shifted to lower frequency along the ωm axis by the vibrational anharmonicity (25 cm-1).(47, 58-60) The key feature in this experiment is the change in the shape of the 0-1 bands in the 2D IR spectra as Tw is increased, as illustrated in Figure 3. As the structure of the protein evolves in time, the CO frequency changes (spectral diffusion) because its frequency is sensitive to the evolving protein structure. Previous experiments and simulations on MbCO and experiments on neuroglobin-CO have shown that the CO frequency fluctuations are sensitive to global protein structural dynamics.(29-31, 54) At short Tw times (Figure 3), the peaks in the spectra are substantially elongated along the diagonal, reflecting the incomplete sampling of the inhomogeneous distribution of states contained in the absorption line shape. The peaks appear elongated along the diagonal because most of the CO molecules initially at frequencies ωτ have the same final frequencies ωm following the short Tw delay. The width perpendicular to the diagonal at very short Tw is caused by the motionally narrowed pure dephasing contribution with a small additional contribution from the vibrational lifetime. At longer Tw times, the protein has had time to sample more of its range of structures. The CO stretching mode no longer has the same initial (ωτ) and final (ωm) frequencies due to evolution of the protein structure during the time period Tw, and the bands in the spectra become less elongated along the diagonal (the major and minor axis are more similar).
Figure 3.
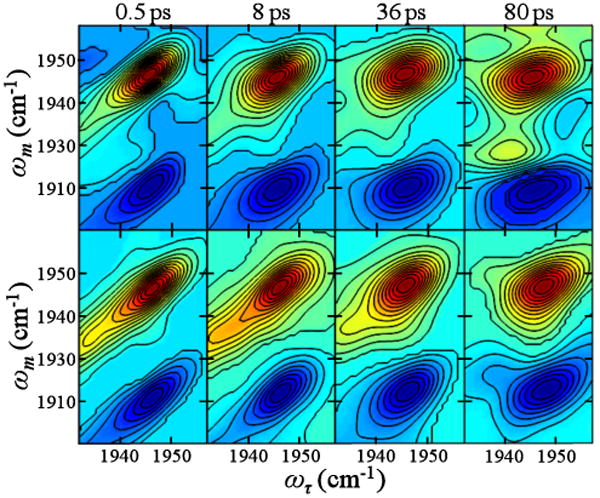
2D IR spectra of MbCO (upper panels) and His6MbCO (lower panels) for various Tw times. A total of 20 contour lines are shown.
To quantitatively compare the dynamics of the His-tagged and unmodified Mb, the CLS was determined from the A1 band in the 2D IR spectra for each Tw.(50, 51) Figure 4 shows the CLS vs. Tw for MbCO and His6MbCO, as well as multiexponential fits to the data. As discussed in Section II, Experimental Procedures, the CLS decays were analyzed in combination with the linear FT-IR spectra and vibrational lifetimes to obtain the FFCFs, which quantify the dynamics associated with the fluctuating CO frequency caused by the structural dynamics of the protein. The parameters describing the FFCFs are listed in Table 1.
Figure 4.

CLS decay curves and corresponding exponential fits for MbCO (blue) and His6MbCO (red).
Table 1. Dynamic Parameters from 2D IR Spectra.
| MbCO | His6MbCO | |
|---|---|---|
| T1 (ps) | 17 | 20 |
| T2* (ps) | 3.8 | 7.3 |
| Γ (cm-1) | 2.8 | 1.5 |
| τ1 (ps) | 1.4 | NA |
| Δ1 (cm-1) | 1.2 | NA |
| t2 (ps) | 19 | 21 |
| Δ2 (cm-1) | 2.7 | 2.7 |
| t3 (ps) | ∞ | ∞ |
| Δ3 (cm-1) | 2.3 | 3.0 |
The ultrafast protein dynamics plus contributions from the solvent fluctuations produce a motionally narrowed Lorentzian (homogeneous) component of the absorption spectrum,(29) which is characterized by the pure dephasing time, , and the pure dephasing linewidth, Γ. Both of these parameters are given in Table 1. Given that the two proteins have nearly identical FT-IR spectra, the initial smaller CLS value of the unmodified protein indicates a greater homogeneous contribution to the dynamics compared to the His-tagged protein. In accordance with this, determination of the FFCF yielded a homogeneous dephasing time of 3.8 ps for MbCO, while the FFCF of His6MbCO showed a slower homogeneous dephasing time of 7.5 ps. The homogeneous dephasing time is thus influenced by the presence of the His tag; however, in both cases the homogeneous component is a minor contributor to the overall linewidth (2-3 cm-1 of the 11 cm-1 linewidth). While the water/glycerol solvent contributes to the homogeneous dephasing, it is unlikely that the presence of the His tag changes the homogeneous dephasing because of its influence on the solvent dynamics per se. The protein is surrounded by solvent, and the fast motions of the solvent molecules gives rise to a component of the homogeneous dephasing by producing fluctuating electric fields at the CO. The presence of the His tag will at most make a difference to those solvent molecules in its immediate vicinity, which is a small fraction of all of the solvent. Most likely the change in the homogeneous dephasing caused by the His tag comes about from changes in the very fast structural fluctuations of the protein itself, not from modification of the solvent.
On a slower timescale, fluctuations of the protein structure lead the CO to sample its possible IR frequencies (spectral diffusion). These dynamics are reflected in the Tw dependence of the CLS. For the unmodified protein, the CLS decay involves three timescales: a fast 1.4 ps component (τ1), a slower 19 ps component (τ2) and a very slow component that appears static on the experimental timescale (τ3 = ∞). The timescales differ from a previous 2D IR study of this protein.(31) However, in the current study, the solvent is 50 % glycerol/PBS as opposed to D2O buffer used in the earlier study. The glycerol increases the viscosity six fold. The glycerol also reduces the solvent background and greatly improves the data quality. The result is that data could be acquired in this study to Tw of 80 ps while the previous data were measured to a Tw of 40 ps. Therefore the current study captures a larger range of the dynamics.
The perturbation of the dynamics of MbCO due to incorporation of the His tag is clear from inspection of the CLS decay curves in Figure 4 and the parameters given in Table 1. The CLS decay of His6MbCO involves only two timescales: a 21 ps component (τ2) and and a very slow component that appears static on the experimental timescale (τ3 = ∞). Thus, the 1.4 ps dynamics of the unmodified protein are no longer observed when the His tag is introduced. The lack of this component is evident from inspection of the CLS decays curves at the shortest Tw times. The initial CLS decay of MbCO is much faster than the decay of His6MbCO. The 1.4 ps component was still absent when experiments were performed with a protein concentration of 3 mM. Dimer formation is known to be absent at 7 mM for MbCO.(48) If dimer formation occurred for His6MbCO at 7 mM, the reduction in concentration to 3 mM would reduce the dimer concentration by >5. The reduction in concentration lowered the viscosity of the sample by a factor of ∼2, which caused a small decrease in the static component of the CLS, otherwise the curve was unchanged. Thus, dimer formation can be ruled out as the reason for the difference in dynamics between His6MbCO and MbCO.
While the timescales of the slower dynamics are very similar, the amplitudes of the frequency fluctuations associated with the timescales differ somewhat between the two proteins. The Δ2 for the two proteins are the same (2.7 cm-1) for the native protein vs. the His-tagged protein (see Table 1). In contrast, the frequency fluctuation amplitude of the dynamics of the native protein on the slowest (>100s ps) timescale is less than that of His6MbCO, 2.3 vs. 3.0 cm-1, respectively. The observed similarity in timescales but variance in amplitudes is consistent with a situation where the His tag does not fundamentally change the nature of slower Mb motions. A possible explanation for the observed differences in the two proteins is that the faster (1.4 ps) motions of the native Mb slow upon His tag addition, leading to the removal of this contribution and increased amplitude of the slowest (>100s ps) timescale contribution to the FFCF of His6MbCO.
Overall, the introduction of the His tag reduces the contributions to the FFCF from fast dynamics, both the very fast homogeneous dynamics and the Tw-dependent 1.4 ps dynamics, and alters the frequency fluctuation amplitudes associated with the slowest motions in MbCO. The influence of the His tag on the dynamics are surprising, as the addition to the protein is relatively small and placed at site distant from the bound CO (Figure 1). Given the similar FT-IR spectra of the modified and His-tagged Mb, the local structure within the heme pocket is not likely perturbed to a great extent by the His-tag. The A1 band in particular showed the same center frequency and linewidth, suggesting the average electrostatic environment and the distribution of environments sampled by Mb in this conformation are unaltered by the His tag. Rather, the 2D IR data show that the His tag changes the motions that lead Mb to sample the environments in the distribution. The differences in the amplitudes of the slowest (>100s ps) dynamics suggest that the His tag affects the global dynamics of Mb, consistent with previous molecular dynamics studies that found the FFCF to result from motions throughout Mb.(46)
IV. Concluding Remarks
This study addressed the general assumption that His tags are non-perturbative. While the His tag does not appear to have a dramatic impact on Mb structure, it does in a more subtle manner influence the Mb dynamics. In a recent survey of structures in the protein data bank, Carsons, et al. overall found no significant changes to protein structures due to the introduction of His tags.(13) However, slightly greater B factors, an indicator of greater structural disorder, were observed for His-tagged compared to the unmodified proteins, suggesting the protein dynamics may be altered. While resolved His tag structures are sometimes observed in crystal structures, more often the His tags are unresolved or unstructured, and assumed to be flopping about in solution. Such motion would be relatively slow, and if present in His6MbCO, could contribute to the greater frequency fluctuation amplitude associated with the slowest motions. However, this type of His tag motion does not account for the loss of the fast 1.4 ps component observed in the native protein.
Several studies have observed adverse affects to protein structure or function due to interaction of the protein with the attached His tag. The effect of His tag incorporation on the structure and dynamics of the protein cytochrome b5 was investigated in a recent study using molecular modeling and molecular dynamics simulations.(16) No disruption to the region surrounding the heme was observed, but a slight decreased RMSD was found in more distant regions of the protein due to stabilizing interactions between the protein with the His tag. In this case, the His tag adopts a helical structure that packs against the hydrophobic core of the protein through salt bridges, hydrogen bonding, and hydrophobic interactions. Similar types of interactions between a His tag and the enzyme tropinone reductase led to interference with enzymatic activity according to a recent experimental and molecular dynamics study.(14) Another investigation of His tag incorporation into the protein dynein found that stabilization of a particular helix through interaction with a His tag creates a new site for protein-protein binding.(15) In a similar manner, interactions between the His tag and Mb may lead to stabilization of a state that removes the contribution of 1.4 ps and faster protein motions to the FFCF.
Although the structural details of the observed changes in Mb dynamics at this point remain unknown, the results imply that caution should be used when studying the dynamics of His-tagged proteins or processes that depend on fast timescale structural fluctuations, such as the access of ligands into buried active sites(61), protein or ligand binding involving entropic changes(62, 63), or crossing a transition state in enzymatic catalysis(64, 65). In Mb, differences observed in the ps timescale geminate rebinding of O2, NO, and CO suggest that motions on this fast timescale may be physiologically important for ligand discrimination.(66, 67) Although the 2D IR experimental data are limited in timescale by the vibrational lifetime of the CO probe, precluding determination of the exact timescales of the slowest, > 100s ps motions, the 2D IR data do show different frequency fluctuation amplitudes associated with the slowest motions. Thus, the CO experiences structural fluctuations on a > 100s ps timescale differently in the Mb variants, but we cannot determine how slow the associated motions are or whether the timescales differ. Data from other techniques sensitive to the protein structural details (e.g. those employing UV/visible and IR spectroscopy) may be influenced similarly.
This current study of dynamics corroborates those previous investigations that observed perturbations to structure,(16, 19, 21) folding,(17) and binding interactions with ligands(14, 18, 68) and protein partners(15, 20, 22, 23) due to His tag incorporation. In some cases His-tags appear to influence some but not all properties,(16, 19) in other cases their influence is position-dependent,(17, 19) further complicating the assessment of His tag perturbation. The significant differences in dynamics due to incorporation of a His tag in MbCO observed here using 2D IR spectroscopy, despite very similar FT-IR spectra, reveals that the perturbations may be subtle, and provides a general reason for caution in analyzing experimental data on His-tagged proteins.
Supplementary Material
Abbreviations
- MbCO
myoglobin-CO
- His6MbCO
His tag-myoglobin-CO
- FFCF
frequency-frequency correlation function
- CLS
center line slope
Footnotes
This work was supported by the National Institutes of Health (2-R01-GM061137-09). MCT acknowledges the NIH for a NRSA postdoctoral fellowship (F32-GM090549).
Supporting Information Available: Multiexponential fits to the MbCO CLS decay, CD and UV/visible spectra of His6MbCO. This material is available free of charge via the Internet at http://pubs.acs.org.
References
- 1.Porath J. Immobilized metal ion affinity chromatography. Protein Expression Purf. 1992;3:263–281. doi: 10.1016/1046-5928(92)90001-d. [DOI] [PubMed] [Google Scholar]
- 2.Terpe K. Overview of tag protein fusions: From molecular and biochemical fundamentals to commercial systems. Appl Microbiol Biotechnol. 2003;60:523–533. doi: 10.1007/s00253-002-1158-6. [DOI] [PubMed] [Google Scholar]
- 3.Lichty JJ, Malecki JL, Agnew HD, Michelson-Horowitz DJ, Tan S. Comparison of affinity tags for protein purification. Protein Expression Purf. 2005;41:98–105. doi: 10.1016/j.pep.2005.01.019. [DOI] [PubMed] [Google Scholar]
- 4.Smith MC, Furman TC, Ingolia TD, Pidgeon C. Chelating peptide-immobilized metal ion affinity chromatography. A new concept in affinity chromatography for recombinant proteins. J Biol Chem. 1988;263:7211–7215. [PubMed] [Google Scholar]
- 5.Pedersen J, L C, Madsen MT, Dahl SW. Removal of n-terminal polyhistidine tags from recombinant proteins using engineered aminopeptidases. Protein Expression Purf. 1999;15:389–400. doi: 10.1006/prep.1999.1038. [DOI] [PubMed] [Google Scholar]
- 6.Jenny RJ, Mann KG, Lundblad RL. A critical review of the methods for cleavage of fusion proteins with thrombin and factor xa. Protein Expression Purf. 2003;31:1–11. doi: 10.1016/s1046-5928(03)00168-2. [DOI] [PubMed] [Google Scholar]
- 7.Hao X, Cheng Y, Li-E C. Current strategies for polypeptide fusion tags removal. Prog Biochem Biophys. 2009;36:1364–1669. [Google Scholar]
- 8.Vassiliev S, Lee CI, Brudvig GW, Bruce D. Structure-based kinetic modeling of excited-state transfer and trapping in histidine-tagged photosystem II core complexes from Synechocystis. Biochemistry. 2002;41:12236–12243. doi: 10.1021/bi0262597. [DOI] [PubMed] [Google Scholar]
- 9.Yao L, Vogeli B, Torchia DA, Bax A. Simultaneous NMR study of protein structure and dynamics using conservative mutagenesis. J Phys Chem B. 2008;112:6045–6056. doi: 10.1021/jp0772124. [DOI] [PubMed] [Google Scholar]
- 10.O'Sullivan DBD, Jones CE, Abdelraheim SR, Brazier MW, Toms H, Brown DR, Viles JH. Dynamics of a truncated prion protein, prp(113–231), from 15n NMR relaxation: Order parameters calculated and slow conformational fluctuations localized to a distinct region. Protein Sci. 2009;18:410–423. doi: 10.1002/pro.44. [DOI] [PMC free article] [PubMed] [Google Scholar]
- 11.Nienhaus K, Deng P, Belyea J, Franzen S, Nienhaus GU. Spectroscopic study of substrate binding to the carbonmonoxy form of dehaloperoxidase from Amphitrite ornata. J Phys Chem B. 2006;110:13264–13276. doi: 10.1021/jp060278z. [DOI] [PubMed] [Google Scholar]
- 12.Ishikawa H, Finkelstein IJ, Kim S, Kwak K, Chung JK, Wakasugi K, Massari AM, Fayer MD. Neuroglobin dynamics observed with ultrafast 2D-IR vibrational echo spectroscopy. Proc Natl Acad Sci USA. 2007;104:16116–16121. doi: 10.1073/pnas.0707718104. [DOI] [PMC free article] [PubMed] [Google Scholar]
- 13.Carson M, Johnson DH, McDonald H, Brouillette C, DeLucas LJ. His-tag impact on structure. Acta Crystallogr Sect D Biol Crystallogr. 2007;63:295–301. doi: 10.1107/S0907444906052024. [DOI] [PubMed] [Google Scholar]
- 14.Freydank AC, Brandt W, Dräger B. Protein structure modeling indicates hexahistidine-tag interference with enzyme activity. Proteins: Struct Funct Bioinf. 2008;72:173–183. doi: 10.1002/prot.21905. [DOI] [PubMed] [Google Scholar]
- 15.Song J, Markley JL. Cautionary tail: The presence of an n-terminal tag on dynein light-chain roadblock/lc7 affects its interaction with a functional partner. Protein Pept Lett. 2007;14:265–268. doi: 10.2174/092986607780090801. [DOI] [PubMed] [Google Scholar]
- 16.Lin YW, Ying TL, Liao LF. Molecular modeling and dynamics simulation of a histidine-tagged cytochrome. J Mol Model. 2010:1–8. doi: 10.1007/s00894-010-0795-4. [DOI] [PubMed] [Google Scholar]
- 17.Klose J, Wendt N, Kubald S, Krause E, Fechner K, Beyermann M, Bienert M, Rudolph R, Rothemund S. Hexa-histidin tag position influences disulfide structure but not binding behavior of in vitro folded n-terminal domain of rat corticotropin-releasing factor receptor type 2a. Protein Sci. 2004;13:2470–2475. doi: 10.1110/ps.04835904. [DOI] [PMC free article] [PubMed] [Google Scholar]
- 18.Emoto C, Murayama N, Wakiya S, Yamazaki H. Effects of histidine-tag on recombinant human cytochrome p450 3a5 catalytic activity in reconstitution systems. Drug Metab Lett. 2009;3:207–211. doi: 10.2174/187231209790218109. [DOI] [PubMed] [Google Scholar]
- 19.Chant A, Kraemer-Pecore CM, Watkin R, Kneale GG. Attachment of a histidine tag to the minimal zinc finger protein of the Aspergillus nidulans gene regulatory protein area causes a conformational change at the DNA-binding site. Protein Expression Purf. 2005;39:152–159. doi: 10.1016/j.pep.2004.10.017. [DOI] [PubMed] [Google Scholar]
- 20.Goel A, Colcher D, Koo JS, Booth BJM, Pavlinkova G, Batra SK. Relative position of the hexahistidine tag effects binding properties of a tumor-associated single-chain fv construct. Biochim Biophys Acta, Gen Subj. 2000;1523:13–20. doi: 10.1016/s0304-4165(00)00086-6. [DOI] [PubMed] [Google Scholar]
- 21.Kim KM, Yi EC, Baker D, Zhang KYJ. Post-translational modification of the n-terminal his tag interferes with the crystallization of the wild-type and mutant sh3 domains from chicken src tyrosine kinase. Acta Crystallographica Section D. 2001;57:759–762. doi: 10.1107/s0907444901002918. [DOI] [PubMed] [Google Scholar]
- 22.Amor-Mahjoub M, Suppini JP, Gomez-Vrielyunck N, Ladjimi M. The effect of the hexahistidine-tag in the oligomerization of hsc70 constructs. J Chromatogr B. 2006;844:328–334. doi: 10.1016/j.jchromb.2006.07.031. [DOI] [PubMed] [Google Scholar]
- 23.Zhu ZC, Gupta KK, Slabbekoorn AR, Paulson BA, Folker ES, Goodson HV. Interactions between eb1 and microtubules: Dramatic effect of affinity tags and evidence for cooperative behavior. J Biol Chem. 2009;284:32651–32661. doi: 10.1074/jbc.M109.013466. [DOI] [PMC free article] [PubMed] [Google Scholar]
- 24.Alben JO, Caughy WS. Biochemistry. 1968;7:175–183. doi: 10.1021/bi00841a022. [DOI] [PubMed] [Google Scholar]
- 25.Li TS, Quillin ML, Phillips GN, Jr, Olson JS. Structural determinants of the stretching frequency of CO bound to myoglobin. Biochemistry. 1994;33:1433–1446. doi: 10.1021/bi00172a021. [DOI] [PubMed] [Google Scholar]
- 26.Park E, Andrews S, Boxer SG. Vibrational stark spectroscopy in proteins: A probe and calibration for electrostatic fields. J Phys Chem. 1999;103:9813–9817. [Google Scholar]
- 27.Phillips GN, Jr, Teodoro MN, Li T, Smith B, Olson JS. Bound CO is a molecular probe of electrostatic potential in the distal pocket of myoglobin. J Phys Chem B. 1999;103:8817–8829. [Google Scholar]
- 28.Spiro TG, Wasbotten IH. CO as a vibrational probe of heme protein active sites. J Inorg Biochem. 2005;99:34–44. doi: 10.1016/j.jinorgbio.2004.09.026. [DOI] [PubMed] [Google Scholar]
- 29.Merchant KA, Noid WG, Akiyama R, Finkelstein I, Goun A, McClain BL, Loring RF, Fayer MD. Myoglobin-CO substate structures and dynamics: Multidimensional vibrational echoes and molecular dynamics simulations. J Am Chem Soc. 2003;125:13804–13818. doi: 10.1021/ja035654x. [DOI] [PMC free article] [PubMed] [Google Scholar]
- 30.Merchant KA, Noid WG, Thompson DE, Akiyama R, Loring RF, Fayer MD. Structural assignments and dynamics of the A substates of MbCO: Spectrally resolved vibrational echo experiments and molecular dynamics simulations. J Phys Chem B. 2003;107:4–7. [Google Scholar]
- 31.Bagchi S, Nebgen BT, Loring RF, Fayer MD. Dynamics of a myoglobin mutant enzyme: 2D-IR vibrational echo experiments and simulations. J Am Chem Soc. 2010;132:18367–18376. doi: 10.1021/ja108491t. [DOI] [PMC free article] [PubMed] [Google Scholar]
- 32.Merchant KA, Thompson DE, Xu QH, Williams RB, Loring RF, Fayer MD. Myoglobin-CO conformational substate dynamics: 2d vibrational echoes and md simulations. Biophys J. 2002;82:3277–3288. doi: 10.1016/S0006-3495(02)75669-5. [DOI] [PMC free article] [PubMed] [Google Scholar]
- 33.Kim S, Chung JK, Kwak K, Bowman SE, Bren KL, Bagchi B, Fayer MD. Native and unfolded cytochrome c-comparison of dynamics using 2D-IR vibrational echo spectroscopy. J Phys Chem B. 2008;112:10054–10063. doi: 10.1021/jp802246h. [DOI] [PMC free article] [PubMed] [Google Scholar]
- 34.Ishikawa H, Kwak K, Chung JK, Kim S, Fayer MD. Direct observation of fast protein conformational switching. Proc Natl Acad Sci USA. 2008;105:8619–8624. doi: 10.1073/pnas.0803764105. [DOI] [PMC free article] [PubMed] [Google Scholar]
- 35.Thielges MC, Chung JK, Fayer MD. Protein dynamics in cytochrome p450 molecular recognition and substrate specificity using 2D IR vibrational echo spectroscopy. J Am Chem Soc. 2010;133:3995–4004. doi: 10.1021/ja109168h. [DOI] [PMC free article] [PubMed] [Google Scholar]
- 36.Bagchi S, Thorpe DG, Thorpe IF, Voth GA, Fayer MD. Conformational switching between protein substates studied with 2D IR vibrational echo spectroscopy and molecular dynamics simulations. J Phys Chem B. 2010;114:17187–17193. doi: 10.1021/jp109203b. [DOI] [PMC free article] [PubMed] [Google Scholar]
- 37.Hill JR, Tokmakoff A, Peterson KA, Sauter B, Zimdars DA, Dlott DD, Fayer MD. Vibrational dynamics of carbon monoxide at the active site of myoglobin: Picosecond infrared free-electron laser pump-probe experiments. J Phys Chem. 1994;98:11213–11219. [Google Scholar]
- 38.Rella CW, Rector KD, Kwok AS, Hill JR, Schwettman HA, Dlott DD, Fayer MD. Vibrational echo studies of myoglobin-CO. J Phys Chem. 1996;100:15620–15629. doi: 10.1103/PhysRevLett.77.1648. [DOI] [PubMed] [Google Scholar]
- 39.Rector KD, Rella CW, Kwok AS, Hill JR, Sligar SG, Chien EYP, Dlott DD, Fayer MD. Mutant and wild type myoglobin-CO protein dynamics:Vibrational echo experiments. J Phys Chem B. 1997;101:1468–1475. [Google Scholar]
- 40.Rector KD, Fayer MD. Vibrational echoes: A new approach to condensed matter vibrational spectroscopy. Intl Rev Phys Chem. 1998;17:261–306. [Google Scholar]
- 41.Rector KD, Fayer MD. Myoglobin dynamics measured with vibrational echo experiments. Laser Chem. 1999;19:19–34. [Google Scholar]
- 42.Rector KD, Thompson DE, Merchant K, Fayer MD. Dynamics in globular proteins: Vibrational echo experiments. Chem Phys Lett. 2000;316:122–128. [Google Scholar]
- 43.Merchant KA, Thompson DE, Fayer MD. Two-dimensional time-frequency ultrafast infrared vibrational echo spectroscopy. Phys Rev Lett. 2001;86:3899–3902. doi: 10.1103/PhysRevLett.86.3899. [DOI] [PubMed] [Google Scholar]
- 44.Merchant KA, Xu QH, Thompson DE, Fayer MD. Frequency selected ultrafast infrared vibrational echo studies of liquids, glasses and proteins. J Phys Chem A. 2002;106:8839–8849. [Google Scholar]
- 45.Finkelstein IJ, Goj A, McClain BL, Massari AM, Merchant KA, Loring RF, Fayer MD. Ultrafast dynamics of myoglobin without the distal histidine: Stimulated vibrational echo experiments and molecular dynamics simulations. J Phys Chem B. 2005;109:16959–16966. doi: 10.1021/jp0517201. [DOI] [PubMed] [Google Scholar]
- 46.Massari AM, Finkelstein IJ, McClain BL, Goj A, Wen X, Bren KL, Loring RF, Fayer MD. The influence of aqueous vs. Glassy solvents on protein dynamics: Vibrational echo experiments and molecular dynamics simulations. J Am Chem Soc. 2005;127:14279–14289. doi: 10.1021/ja053627w. [DOI] [PubMed] [Google Scholar]
- 47.Finkelstein IJ, Zheng J, Ishikawa H, Kim S, Kwak K, Fayer MD. Probing dynamics of complex molecular systems with ultrafast 2D IR vibrational echo spectroscopy. Phys Chem Chem Phys. 2007;9:1533–1549. doi: 10.1039/b618158a. [DOI] [PubMed] [Google Scholar]
- 48.Minton AP, Lewis MS. Self-association in highly concentrated-solutions of myoglobin - a novel analysis of sedimentation equilibrium of highly nonideal solutions. Biophys Chem. 1981;14:317–324. doi: 10.1016/0301-4622(81)85033-8. [DOI] [PubMed] [Google Scholar]
- 49.Park S, Kwak K, Fayer MD. Ultrafast 2D-IR vibrational echo spectroscopy: A probe of molecular dynamics. Laser Phys Lett. 2007;4:704–718. [Google Scholar]
- 50.Kwak K, Park S, Finkelstein IJ, Fayer MD. Frequency-frequency correlation functions and apodization in 2D-IR vibrational echo spectroscopy, a new approach. J Chem Phys. 2007;127:124503. doi: 10.1063/1.2772269. [DOI] [PubMed] [Google Scholar]
- 51.Kwak K, Rosenfeld DE, Fayer MD. Taking apart 2D-IR vibrational echo spectra: More information and elimination of distortions. J Chem Phys. 2008;128:204505. doi: 10.1063/1.2927906. [DOI] [PubMed] [Google Scholar]
- 52.Finkelstein IJ, Ishikawa H, Kim S, Massari AM, Fayer MD. Substrate binding and protein conformational dynamics measured via 2D-IR vibrational echo spectroscopy. Proc Natl Acad Sci USA. 2007;104:2637–2642. doi: 10.1073/pnas.0610027104. [DOI] [PMC free article] [PubMed] [Google Scholar]
- 53.Massari AM, Finkelstein IJ, Fayer MD. Dynamics of proteins encapsulated in silica sol-gel glasses studied with IR vibrational echo spectroscopy. J Am Chem Soc. 2006;128:3990–3997. doi: 10.1021/ja058745y. [DOI] [PMC free article] [PubMed] [Google Scholar]
- 54.Ishikawa H, Kim S, Kwak K, Wakasugi K, Fayer MD. Disulfide bonds' influence on protein structural dynamics probed with 2D-IR vibrational echo spectroscopy. Proc Natl Acad Sci USA. 2007;104:19309–19314. doi: 10.1073/pnas.0709760104. [DOI] [PMC free article] [PubMed] [Google Scholar]
- 55.Shimada H, Caughey WS. Dynamic protein structures. J Biol Chem. 1982;257:1893–1900. [PubMed] [Google Scholar]
- 56.Morikis D, Champion PM, Springer BA, Sligar SG. Resonance raman investigations of site-directed mutants of myoglobin - effects of distal histidine replacement. Biochemistry. 1989;28:4791–4800. doi: 10.1021/bi00437a041. [DOI] [PubMed] [Google Scholar]
- 57.Li T, Quillin ML, Phillips GN, Jr, Olson JS. Structural determinants of the stretching frequency of CO bound to myoglobin. Biochemistry. 1994;33:1433–1446. doi: 10.1021/bi00172a021. [DOI] [PubMed] [Google Scholar]
- 58.Tokmakoff A, Kwok AS, Urdahl RS, Francis RS, Fayer MD. Multilevel vibrational dephasing and vibrational anharmonicity from infrared photon echo beats. Chem Phys Lett. 1995;234:289–295. [Google Scholar]
- 59.Rector KD, Kwok AS, Ferrante C, Tokmakoff A, Rella CW, Fayer MD. Vibrational anharmonicity and multilevel vibrational dephasing from vibrational echo beats. J Chem Phys. 1997;106:10027–10036. [Google Scholar]
- 60.Golonzka O, Khalil M, Demirdoven N, Tokmakoff A. Vibrational anharmonicities revealed by coherent two-dimensional infrared spectroscopy. Phys Rev Lett. 2001;86:2154–2157. doi: 10.1103/PhysRevLett.86.2154. [DOI] [PubMed] [Google Scholar]
- 61.Ruscio JZ, Kumar D, Shukla M, Prisant MG, Murali TM, Onufriev AV. Atomic level computational identification of ligand migration pathways between solvent and binding site in myoglobin. Proc Natl Acad Sci USA. 2008;105:9204–9209. doi: 10.1073/pnas.0710825105. [DOI] [PMC free article] [PubMed] [Google Scholar]
- 62.Frederick KK, Marlow MS, Valentine KG, Wand AJ. Conformational entropy in molecular recognition by proteins. Nature. 2007;448:325–U323. doi: 10.1038/nature05959. [DOI] [PMC free article] [PubMed] [Google Scholar]
- 63.Stone MJ. NMR relaxation studies of the role of conformational entropy in protein stability and ligand binding. Acc Chem Res. 2001;34:379–388. doi: 10.1021/ar000079c. [DOI] [PubMed] [Google Scholar]
- 64.Zhong DP. Ultrafast catalytic processes in enzymes. Curr Opin Chem Biol. 2007;11:174–181. doi: 10.1016/j.cbpa.2007.02.034. [DOI] [PubMed] [Google Scholar]
- 65.Roca M, Moliner V, Tunon I, Hynes JT. Coupling between protein and reaction dynamics in enzymatic processes: Application of grote-hynes theory to catechol o-methyltransferase. J Am Chem Soc. 2006;128:6186–6193. doi: 10.1021/ja058826u. [DOI] [PubMed] [Google Scholar]
- 66.Brunori M, Bourgeois D, Vallone B. The structural dynamics of myoglobin. J Struct Biol. 2004;147:223–234. doi: 10.1016/j.jsb.2004.04.008. [DOI] [PubMed] [Google Scholar]
- 67.Olson JS, Phillips GN. Kinetic pathways and barriers for ligand binding to myoglobin. J Biol Chem. 1996;271:17593–17596. doi: 10.1074/jbc.271.30.17593. [DOI] [PubMed] [Google Scholar]
- 68.Fonda I, Kenig M, Gaberc-Porekar V, Pristovaek P, Menart V. Attachment of histidine tags to recombinant tumor necrosis factor-alpha drastically changes its properties. Sci World J. 2002;2:1312–1325. doi: 10.1100/tsw.2002.215. [DOI] [PMC free article] [PubMed] [Google Scholar]
Associated Data
This section collects any data citations, data availability statements, or supplementary materials included in this article.