Abstract
We investigated with MRI at 7 Tesla the accumulation of manganese in the occipital cortex of common marmoset monkeys (Callithrix jacchus) following four fractionated injections of 30 mg/kg MnCl2·4H2O in the tail vein. We found statistically significant decreases in T1 in the primary (V1) and secondary (V2) areas of the visual cortex caused by an accumulation of manganese. The larger T1 shortening in V1 (ΔT1=641 ms) relative to V2 (ΔT1=491 ms) allowed us to robustly detect the V1/V2 border in vivo using heavily T1-weighted MRI. As well, the dorsomedial (DM) and middle temporal (MT) areas of the visual pathway could be identified by their T1-weighted enhancement. We showed by comparison to histological sections stained for cytochrome oxidase (CO) activity that the extent of V1 is accurately identified throughout the visual cortex by manganese-enhanced MRI (MEMRI). This represents a means of visualizing functional cortical regions in vivo and could be used in longitudinal studies of phenomena such as cortical plasticity, and for localizing cortical areas non-destructively to guide functional techniques.
Keywords: manganese-enhanced MRI (MEMRI), visual cortex, marmoset, non-human primate, Gennari stripe, cytochrome oxidase
Introduction
The primary visual area (V1) of the cortex in the primate brain has several distinguishing features that can be used to accurately identify its extent in the occipital cortex. These include unique patterns of cytoarchitecture (1, 2) and myelination (3, 4) throughout its layers relative to adjacent cortical gray matter. As well, there are proteins whose distributions in V1 also accurately identify it, including cytochrome oxidase (CO) (5, 6) and parvalbumin (7, 8). These features, however, must be visualized ex vivo with histological staining in tissue sections or flat mounts. It would be useful if cortical areas could be identified in vivo based on neuroanatomy for longitudinal studies of phenomena such as cortical plasticity, and for localizing cortical areas non-destructively to guide functional techniques such as optical imaging, position emission tomography (PET), electrophysiology, and fMRI.
MRI is the choice modality for in vivo neuroanatomical studies because of the excellent contrast that is produced between gray and white matter in the central nervous system (CNS). Typically, however, there is little endogenous contrast between gray matter in different areas of the cortex. Studies in humans (9, 10) and macaques (11) have exploited the high myelin content in the stripe of Gennari to identify the extent of V1 in the visual cortex, although this technique is limited by the small size of the structure and hence, the need for very high quality MRI to detect it robustly. Other studies in rodents have used the MRI contrast agent manganese (12, 13) to generate contrast between layers of the cortex. This can also help to identify cortical regions based on the architecture of the cortical layers. The divalent ion of manganese, Mn2+, is paramagnetic and acts as a potent MRI contrast agent by shortening the longitudinal relaxation time, T1, of tissue (14). T1 can be measured quantitatively in vivo in the brain with MRI using T1 mapping techniques. As well, T1 shortening can be detected on quantitative T1-weighted MRI as a brightening of the image. The benefit of T1-weighted MRI is that the images can be made at a much higher resolution and quality than T1 maps can.
In the present study, we use systemic injections of manganese and T1-weigthed MRI to show that in a New World monkey, the common marmoset (Callithrix Jacchus), V1 can be readily detected due to the strong MRI signal enhancement associated with its high accumulation of manganese compared to the surrounding secondary visual cortex (V2). This non-destructive methodology provides a robust mechanism for identifying the V1/V2 border in vivo.
Methods
Animals
All experiments were approved by the NINDS Animal Care and Use Committee. Experiments were carried out in three male and five female common marmosets aged 4.0 ± 3.3 years (mean ± standard deviation) and weighing 365 ± 114 grams. Marmosets were housed two to a cage with a twelve-hour light/dark cycle on an ad libitum diet of Zupreem canned marmoset food, Purina 5040 biscuits, unfiltered water, P.R.A.N.G. rehydrator, and fruit and vegetable treats.
Pre-Injection MRI
Prior to manganese injections, T1 mapping and high resolution 3D T1-weighted MRI were performed in the marmosets. Anaesthesia was induced with an intramuscular injection of 10 mg/kg ketamine. During imaging, the marmosets were placed on an MRI-compatible cradle and anesthetized through a nose cone with isoflurane in a 2:2:1 mixture of medical air, nitrogen, and oxygen. The isoflurane was varied around 2% to maintain anaesthesia which was monitored by end tidal CO2, heart rate, and SPO2 using a capnograph and pulse oximeter (Surgivet, Waukesha, WI, USA). The rectal temperature was measured and the body temperature was maintained at 38.5 °C with a water heating pad augmented with blown hot air. MRI was performed on a 7T/30 cm USR MRI scanner (Bruker Biospin Corp., Ettlingen, Germany) equipped with a 15 cm gradient set of 450 mT/m strength (Resonance Research Inc., Billerica, MA, USA). A custom-built 16-rung high pass birdcage radiofrequency coil with a 12 cm inner diameter was used for transmission, and a four-element phased-array receiver coil (Bruker Biospin) for reception.
Low resolution T1 mapping was performed in a single slice in the occipital lobe using a 2D inversion-recovery EPI sequence (TE = 55 ms, TR = 9400 ms, FOV = 32.0 mm × 32.0 mm, Matrix = 128 × 128, Slice thickness = 1 mm, Slice orientation = coronal, Number of inversion times = 90, Inversion time increment = 100 ms, Range of inversion times = 25 – 9025 ms, Number of averages = 2), producing an in-plane resolution of 250 µm. The data were fit to a three parameter, single-exponential T1 recovery function in Matlab (MathWorks, Natick, MI, USA) to produce T1 maps. T1s in specific regions were measured by region of interest (ROI) analysis in Amira (Mercury Computer Systems, Houston, TX, USA).
High resolution 3D T1-weighted imaging was performed over the entire occipital lobe with a 3D MP-RAGE sequence (Inversion time = 1300 ms, TE = 4 ms, TR = 13 ms, FOV = 42.8 × 42.8 × 16.0 mm, Matrix = 256 × 256 × 96, Number of segments = 4, Segment repetition time = 6200 ms, Number of averages = 5), producing an isotropic resolution of 167 µm in about three hours. B1 inhomogeneities were corrected using a reference image method (15).
Manganese Injections
Manganese was administered to the marmosets in fractionated doses (16). A 40 mM solution of MnCl2·4H2O (Sigma Aldrich, St. Louis, MO, USA) was prepared in 200 mM bicine buffer and the pH of the solution was corrected to 7.4 using 1 M NaOH. The measured osmolarity was 280 mOsm, close to the normal osmolarity of blood. Using a solution that is corrected to physiological pH and osmolarity can reduce tissue damage at the injection site. Anaesthesia was induced with 5% isoflurane in an induction chamber and maintained around 2% isoflurane via a facemask. Animal physiology was monitored as in the MRI experiments. A 26 G butterfly catheter was placed in the lateral tail vein of anaesthetized marmosets and the MnCl2 solution was slowly infused at 1.25 ml/hr to reduce stress to the heart. A dose of 30 mg/kg MnCl2·4H2O (drug weight/body weight) was given to each animal. Marmosets were returned to their cages after dosing with free access to food and water. After 48 hours, the animals received another injection. This was repeated for four doses.
Post-Injection MRI
Forty eight hours following the fourth manganese injection, the marmosets were imaged again as for the Pre-Injection MRI with both the T1-weigthed and T1-mapping sequences. Since the T1s were reduced in the brain, the inversion time in the MP-RAGE sequence was reduced to 1100 ms for optimal global T1-weighted contrast.
Statistics
The presence of significant differences in tissue T1s from the T1 maps was tested for using a non-parametric analysis of variance (Kruskal-Wallis) performed in Systat 12 (Systat Software, San Jose, CA, USA). Multiple comparisons were performed using pair-wise comparison with a correction (Bonferroni) to determine if the post-hoc tests were significant. Significance was set at p < 0.01 before the Bonferroni correction.
Histology
Following imaging, marmosets were sacrificed under deep anesthesia (sodium pentobarbital, 100 mg/kg, iv) via perfusion fixation through the ascending aorta with 500 mL of ice cold 4.0% paraformaldehyde in 0.1 M phosphate buffer (pH 7.4). The brain was removed and further fixed by immersion in the paraformaldehyde solution for 2 hours at 4° C. Four brains were stained for cytochrome oxidase activity, one brain was imaged ex vivo with MRI for anatomical comparisons, and the remaining brains were stored for future studies.
For cytochrome oxidase staining, the brains were cryoprotected, frozen, and sectioned on a SM 2000R freezing microtome (Leica Microsystems Inc., Bannockburn, IL, United States). Using the modified method of Wong-Riley (17), free-floating 40-µm thick coronal sections were incubated in the dark at 37°C for 4 hours in 9 ml of 0.1 M phosphate buffer (pH 7.4) containing 5 mg DAB (Sigma Aldrich), 1 mg cytochrome C from bovine heart (Sigma Aldrich), and 360 mg sucrose (Sigma Aldrich). The sections were then mounted on gelatin-subbed slides, dehydrated and coverslipped. As a negative control for CO staining (18), additional sections were incubated for the same duration in the absence of cytochrome C or with 0.01M potassium cyanide (Sigma Aldrich) added to the incubation medium. These showed no visible CO reaction product (data not shown). Stained sections were analyzed with light microscopy, digital pictures were taken and edited with Adobe Photoshop CS (Adobe Systems, San Jose, CA, USA).
For ex vivo MRI (19), an excised brain was stored in 10% neutral buffered formalin doped with 5 mM gadopentetate dimeglumine (Magnevist) (Berlex Laboratories, Wayne, NJ, USA) contrast agent for one week. The brain was imaged in a 3.5 cm inner diameter transmit/receive birdcage coil (Bruker Biospin) with a T2-weighted 3D multi spin echo sequence (TE = 13 ms, Number of Echoes = 2, TR = 350 ms, FOV = 34 mm × 26 mm × 22 mm, Matrix = 512 × 395 × 335) producing an isotropic resolution of 66 µm in about 13 hours.
Results
In a previous study (20), we used MRI to document the distribution of manganese in the brain following systemic injections of the metal in marmosets. We found that following four injections of 30 mg/kg MnCl2·4H2O in the tail vein, there was a high accumulation of manganese in regions like the striatum, thalamus, cerebellum, and hippocampus that lie proximal to ventricles. We attributed the pattern of accumulation at the doses we injected to a cerebral spinal fluid (CSF) to brain route of manganese uptake. Since the CSF in the ventricles is continuous with the extracellular space in the parenchyma, Mn2+ ions that enter the CSF from the bloodstream across the choroid plexus can diffuse throughout brain regions that are near the ventricles (21) and enter cells through uptake mechanisms. We also noted that there was a strong enhancement in T1-weighted images in the visual area of the occipital cortex. Interestingly, we did not see any other correspondingly strong enhancement in the cortex, save for in small regions immediately adjacent to the middle cerebral arteries. Specifically, there was no strong enhancement seen in the primary somatosensory, auditory, or motor cortices.
The T1-weighted images in our previous study were acquired at a lower resolution than the images obtained for the present study and had a lower contrast because they were based on a saturation-recovery pulse sequence; thus, we were not able to identify specific regions of the visual cortex or the laminar distribution of enhancement. In the present work, we further explore this uptake by using higher resolution in vivo MRI to quantify differences in manganese accumulation between visual areas, and to image the distribution of manganese across the cortical layers in V1. To improve our imaging efficiency, we have limited our field-of-view (FOV) to the occipital cortex, since there were no major enhancements seen in other cortical areas in our last study.
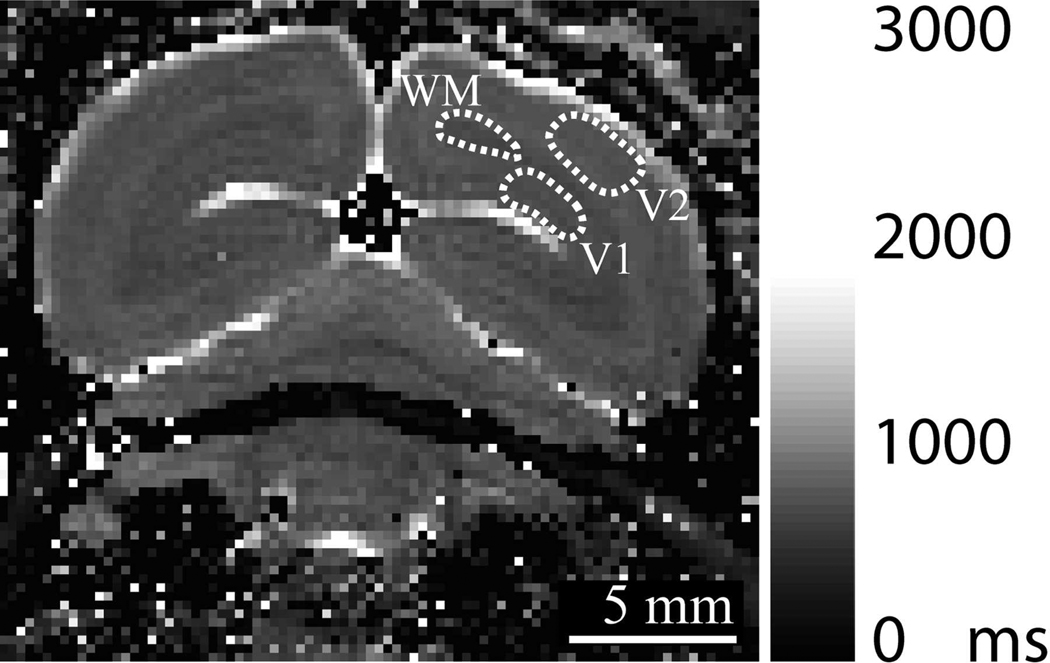
We investigated manganese accumulation following systemic injections with T1 mapping in the marmoset occipital lobe in three brain tissues: V1 gray matter in the dorsal bank of the calcarine fissure, proximal white matter, and V2 gray matter. The resolution of the T1 mapping was suitable for accurately identifying tissue in each region based on published brain maps (22), although it was too low for a detailed analysis of the distribution across cortical layers. Figure 1 shows the regions-of-interest (ROIs) we used for our measurements and Table 1 summarizes our results.
Figure 1.
A representative T1 map in a marmoset following four injections of 30 mg/kg MnCl2·4H2O showing the regions of interest (ROIs) used to measure the values in Table 1. (V1 = gray matter in V1, WM = white matter proximal to V1, V2 = gray matter in V2).
Table 1.
Brain Tissue Manganese Concentration
| Region | T1pre (ms) | T1post (ms) | ΔT1 (ms) | Estimated Δ[Mn] (µg/g) |
|---|---|---|---|---|
| Gray Matter V1 | 1813 ± 71 | 1172 ± 71 * | 641± 68 | 2.15 |
| White Matter | 1309 ± 73 | 1018 ± 77* | 291 ± 54# | 1.58 |
| Gray Matter V2 | 1752 ± 39 | 1261 ± 60* | 491 ± 94 | 1.60 |
In vivo longitudinal relaxation times (mean ± SD, n = 4) in tissue regions before (T1pre) and after (T1post) four injections of 30 mg/kg MnCl2·H2O.
The * denotes a significant decrease in T1pre over T1post in the same region (p < 0.01) while # denotes a significantly smaller ΔT1 for a region versus that of gray matter in V1 (p < 0.01). The estimated change in the concentration of manganese in a tissue region as is also shown in µg of Mn per g wet tissue weight. These estimations were performed with MRI.
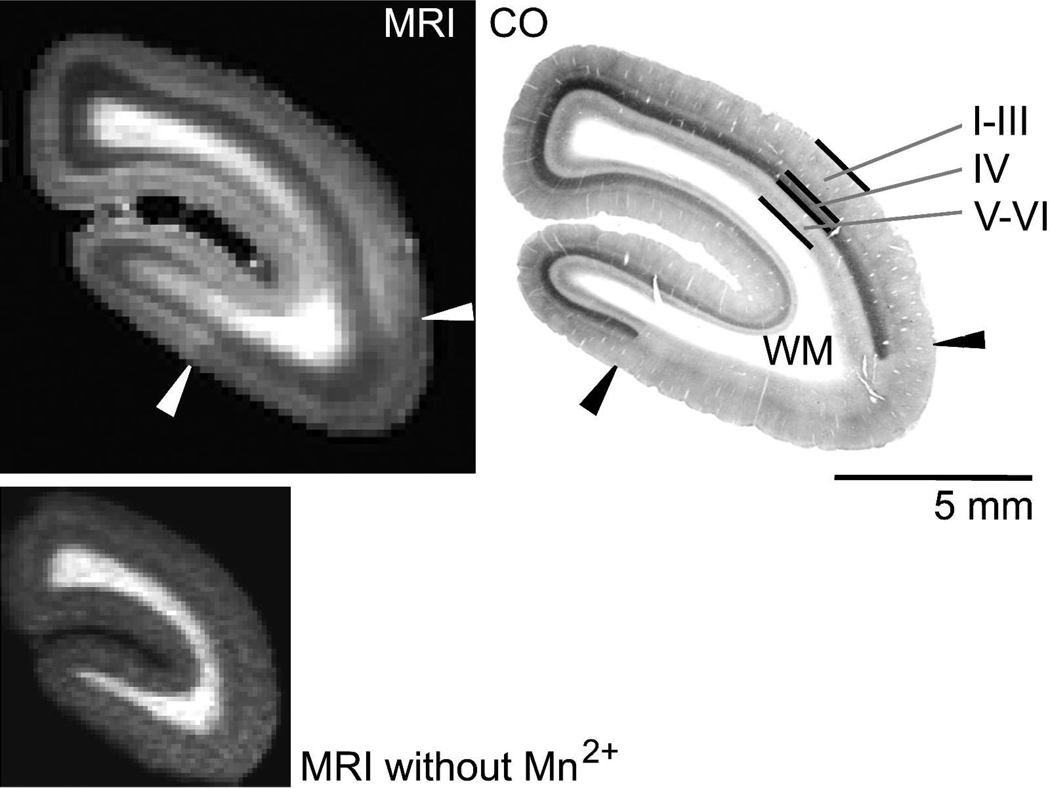
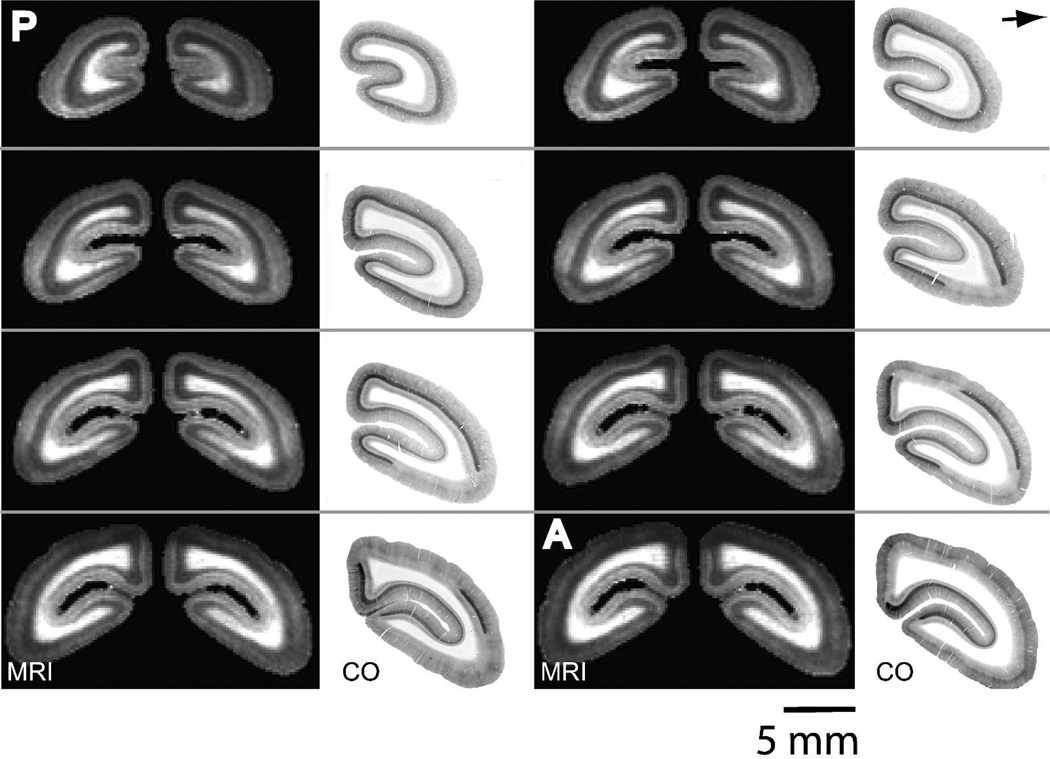
We found that the injections of manganese caused statistically significant decreases in T1 in all tissues (p < 0.01). The largest T1decrease was 641 ± 68 ms (mean ± SD, n = 4) in V1 gray matter, corresponding to a 35% reduction in the native longitudinal relaxation time. There was a statistically smaller decrease of 291 ± 54 ms (22% reduction) in white matter proximal to V1 (p < 0.01). This indicates that V1 gray matter has a greater accumulation of manganese, even though it and the proximal white matter are similarly exposed to manganese diffusing from CSF in the posterior horn of the lateral ventricle. As well, we found that the decrease in T1 of 491 ± 94 in the V2 gray matter (28% reduction) was smaller than in the V1 gray matter. Although the difference was not statistically significant across animals (p = 0.06), it provided a sufficient difference in T1 within the brains of each animal to detect the V1/V2 border on strongly T1-weighted images. Figure 2 shows a representative coronal slice from a 3D T1-weighted MR image in the occipital cortex. For reference, a corresponding section stained for cytochrome oxidase (CO) is also shown. Previous work has shown that the V1 area of the visual cortex in the marmoset can be readily identified by a high CO activity in cortical layer IV that is not seen in the V2 area (7). There is a corresponding enhancement on the T1-weighted MR image throughout the same area identified as V1 in the CO section. Across the layers, the T1 enhancement is strongest in the more superficial layers (I–IV), peaking at a depth roughly corresponding to layer IV. Layers V and VI show very little enhancement. This pattern persists throughout the visual cortex and can be seen to delineate V1 identically to CO activity staining (Figure 3).
Figure 2.
A comparison of contrast in manganese-enhanced MRI in the marmoset occipital cortex versus staining for cytochrome oxidase (CO) activity. Upper Left: Slice from an in vivo T1-weighted coronal MRI in the occipital cortex of a marmoset following systemic injections of manganese. The in-plane image resolution and slice thickness are 167 µm. The cerebellum, brainstem, skull, and surrounding tissue have been masked in the MRI during post processing. The contrast to noise ratio (CNR) between V1 and V2 is 1.4 (CNR = magnitude signal intensity in V1 > magnitude signal intensity V2 / standard deviation of the noise in the image background). Lower Left: An image made prior to manganese injections using the same MP-RAGE pulse sequence, but with a shorter inversion time to maximize global image contrast in the presence of the longer, endogenous T1s. Upper Right: A corresponding 40 µm thick histological section stained for cyctochrome oxidase (CO) activity. (I–III, IV, V–VI denote cortical layers, WM = white matter). Note the strong staining in layer IV in the CO section that defines the extent of V1. The arrows denote the V1/V2 border. The T1 enhancement in the MRI corresponds to V1 identified on the CO section with the strongest layer-specific enhancement occurring in the location of layer IV.
Figure 3.
The extent of V1 is identically identified across the occipital cortex with manganese-enhanced MRI and CO staining. 167 µm in vivo T1-weighted MRI slices and corresponding 40 µm thick CO sections through the occipital cortex. The area of T1 enhancement in the MRI slices corresponds well to V1 as defined by the dark staining in layer IV in the CO sections. The MRI slices are from a 3D MRI in a single marmoset. Slices begin 2.0 mm anterior to the occipital pole and continue in the anterior direction with 0.84 mm spacing. The CO slices are from four marmosets. (P = posterior, A = anterior).
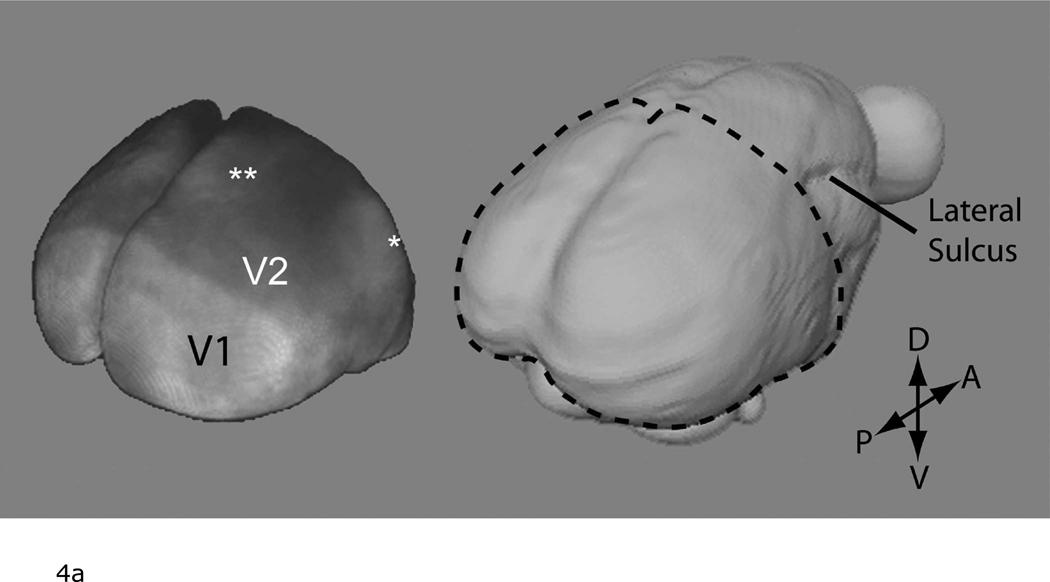
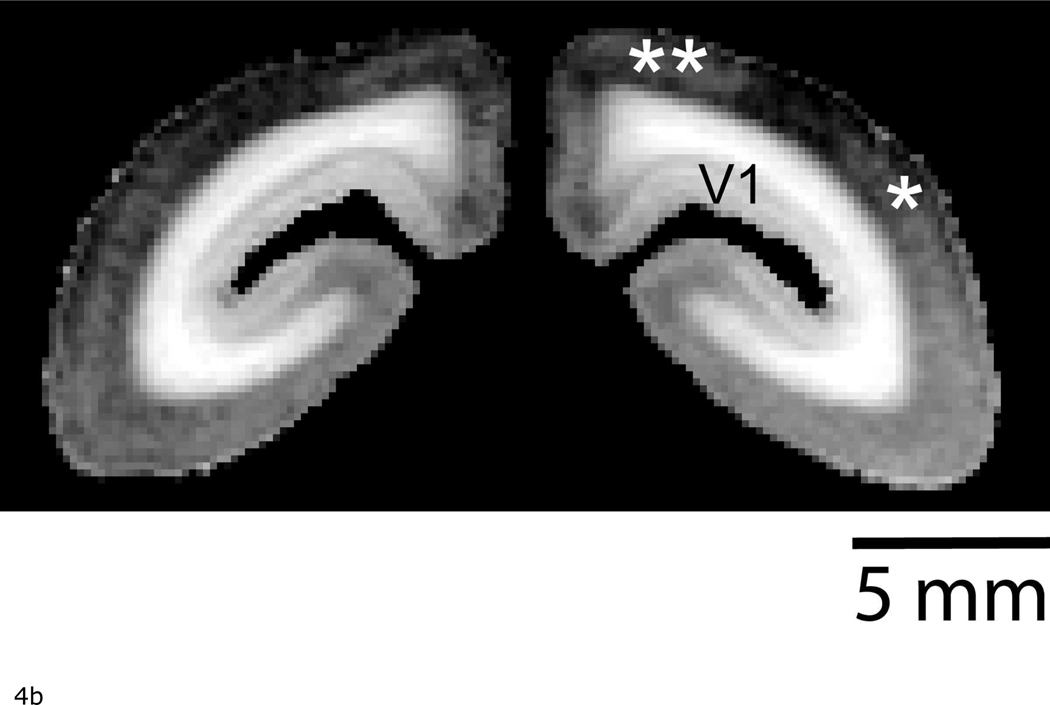
Figure 4a shows a volume rendering of the 3D T1-weighted MR image to better show the enhancement over the area of the occipital cortex. Here, a strong demarcation can be seen between V1 and V2 based on T1 enhancement. As well, there is an enhancement in areas that correspond to the dorsomedial (DM) and middle temporal areas (MT) (Figure 4b). These regions can also be identified in flat mounted sections stained for cytochrome oxidase activity in the marmoset (23).
Figure 4.
a: The V1/V2 border identified on the surface of the occipital cortex by manganese-enhanced MRI. Left: A volume rendering of a T1-weighted 3D MRI in a marmoset following systemic manganese injections. Note that the 3D MRI only covered the occipital cortex. The data is displayed using the >Voltex> rendering function in Amira. For this, the MRI volume was masked to only include cortical tissue. Each voxel in the the data volume was assumed to emit and absorb light. The amount of emitted light and the amount of absorption was determined from the MRI magnitude data by using a colormap. This image thus intuitively shows the strong T1 enhancement in V1. There is also lighter enhancement in regions corresponding to the location of the middle temporal (*) and dorsomedial (**) areas. Right: A surface rendering of the marmoset brain shown for localization. The dotted line shows the extent of the 3D image used to generate the Left figure. (P = posterior, A = anterior, D = dorsal, V = ventral).
b: Coronal slice from the in vivo T1-weighted MR image used to created Figure 4a showing light enhancement in the middle temporal (*) and dorsomedial areas (**).
For comparison with other studies of manganese accumulation in the brain, we estimated from our T1 maps the change in tissue manganese concentration ([ΔMn]) following injections by the equation:
| (1) |
where T1post is the longitudinal relaxation time in the tissue following injections, T1pre is the longitudinal relaxation time before injections, and χ1 is the longitudinal relaxivity. We used an empirical value for χ1 in marmoset brain at 7 Tesla measured in a previous study of 0.14 s−1 µg−1g (20). Our results are shown in Table 1; the largest manganese accumulation was 2.15 µg of Mn per g wet tissue weight in the V1 gray matter. A limitation in this calculation is that we do not know the chemical fate of manganese in brain tissue – that is, whether the Mn2+ ion is free or sequestered in proteins. The value of χ1 we used was empirically determined in four gray matter structures in the brain (frontal cortex, striatum, thalamus, and hippocampus). In our calculation, we assume that the chemical fate of manganese is the same in all regions of the brain; however, if it is different in other brain regions, such as V1 and white matter, χ1 could change and the estimation of [ΔMn] would be incorrect. It should also be noted that a larger χ1 value in V1 could result in the large decrease in T1 being incorrectly interpreted as a preferential accumulation of manganese in the structure. While it would require a large number of excised tissue samples from all regions of the brain, an analysis of the variation of χ1 across regions would be very interesting.
Discussion
In this paper, we show that the extent of V1 in the marmoset visual cortex can be accurately identified in vivo using MRI and the contrast agent manganese. As well, the DM and MT areas of the visual pathway can be distinguished, showing that manganese-enhanced MRI is a powerful technique for studying marmoset neuroanatomy in vivo. The contrast mechanism may also exist in other species of monkey. The ability to map V1 in vivo and non-destructively is important to neuroimaging for two reasons. First, it provides a means for measuring the size of V1 relative to the rest of the cortex for studies of comparative neuroanatomy or neuronal plasticity. Traditionally, studies comparing the size ratio of V1 relative to V2 and other cortical areas in various primates have relied on flat-mounted sections (24, 25). Manganese-enhanced MRI allows this measurement to be made accurately without sacrificing animals – which is important in studies of valuable primates. Also, each animal can be followed longitudinally for the periodic monitoring of regional changes in the brain associated with development, learning, aging, brain injury, and neurological disorders such as Alzheimer’s disease. Second, the technique provides a means to independently map the extent of V1 for the localization of functional activity identified with optical imaging of intrinsic signals, electrophysiology, PET, or fMRI. This can be done either before functional measurements to guide the techniques, or after to confirm the location of measurements.
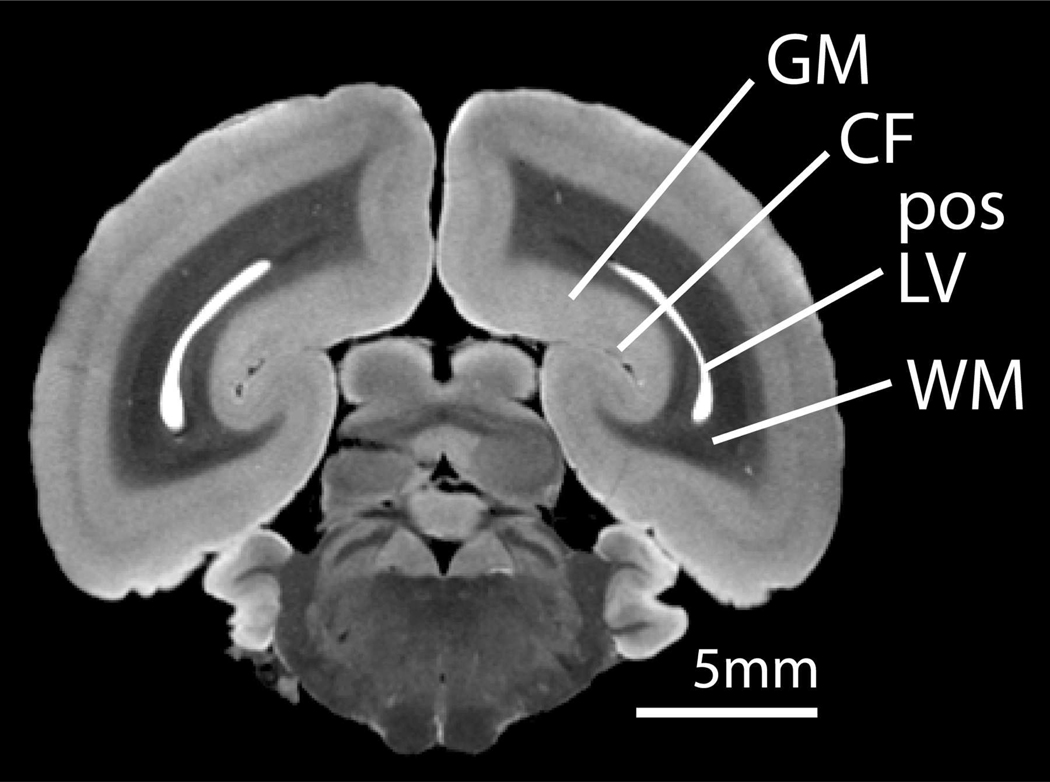
The underlying cause of the unique pattern of manganese accumulation in the marmoset visual cortex is unknown. A CSF-to-brain route of manganese uptake may partially explain the unique enhancement seen in the visual cortex relative to other major sensory areas in the cortex with similar tissue properties, since gray matter surrounding the calcarine fissure is supplied with Mn2+ ions from proximal CSF in the posterior horn of the lateral ventricle (Figure 5). Other major cortical regions are not proximal to large CSF spaces and therefore, not readily supplied with Mn2+ ions. Proximity to the ventricles, however, does not fully explain the pattern of Mn accumulation in V1. Here we show by our T1 maps that the manganese accumulation in V1 gray matter is much higher than in adjacent white matter. This and the sharp border between gray matter in V1 and V2 seen on T1-weighted MRI suggest that the accumulation of manganese in V1 is not explained by diffusion from the ventricles alone. Rather, there must be a greater uptake and or retention of Mn2+ in cells in V1 gray matter following exposure relative to surrounding tissue.
Figure 5.
An ex vivo coronal MR image of a fixed marmoset brain showing the position of the lateral ventricles in the occipital lobe. Gray matter surrounding the calcarine fissure in the occipital cortex is supplied with Mn2+ ions via a CSF-brain uptake route. (GM = gray matter, CF = calcarine fissure, pos LV = posterior horn of the lateral ventricle, WM = white matter).
The dominant mechanism of manganese uptake into cells in the CNS from the extracellular space remains unknown; however, the divalent metal transporter (DMT-1) (26) and transferrin (Tf) (27) have been shown to transport Mn2+ across the blood-brain-barrier (BBB) into cells at low exposure doses (manganese does not readily cross the BBB otherwise). Whether these transporters contribute to uptake from the extracellular space is unclear. Mn2+ can also enter excitable cells in the CNS via voltage-gated calcium channels (28) because it has a similar ionic radius to Ca2+. Additionally, there may be unidentified uptake mechanisms that contribute to a high uptake of manganese by cells in V1. Once inside cells, the biological half-life of Mn2+ in various regions of the brain is between 51–74 days (29) suggesting that the metal is sequestered into organelles or proteins. At physiological levels, manganese in the brain is found primarily in mitochondrial superoxide dismutase and glutamine synthetase metalloproteins (30); however, its actual fate in cells in the CNS following overexposure is unknown. Interestingly, manganese is sequestered in mitochondria by the Ca2+ uniporter (31). An association with mitochondria would explain the similarity between the distribution of Mn2+ and cytochrome oxidase activity across the layers of V1. More work is needed, however, on the uptake and speciation mechanisms of manganese in the CNS before the pattern of T1 contrast enhancement in our images can be fully explained. For instance, manganese-related T1-enhancement has also been shown to correlate with glutamine synthetase immunoactivity in a rat model of noncystic periventricular leukomalacia (32).
One further interesting question is whether the manganese accumulation in V1 in the marmoset is related to the high functional activity in this region. The fact that Mn2+ can enter neurons during action potentials via voltage-gated calcium channels has lead to its use as an MR-visible marker of brain activation in rodents (33, 34). One way to test whether there is a functional component to the manganese accumulation in V1 in the marmoset would be to perform a monocular deprivation experiment during manganese injections and see if ocular dominance columns (ODCs) can be observed in V1 with high resolution T1-weighted MRI. A similar approach has been used to show the relation of cytochrome oxidase activity (17) and [2-14C] deoxyglucose uptake (35) to underlying neuronal activity in the visual cortex.
A caveat to using manganese as an MRI contrast agent is that an overexposure to the metal in the brains of monkeys and humans can produce manganism – a motor disorder with similarities to Parkinson’s disease. In humans, the late-stage symptoms include generalized bradykinesia, widespread rigidity, and occasional resting tremor (36) and are thought to be related to an accumulation of manganese in the substructures of the basal ganglia, particularly the globus pallidus. This precludes the use of manganese as a contrast agent in humans and means that care must be taken when using it in monkeys, as symptoms of manganism have also been noted in macaques (37). We did not see any signs of manganism in our marmosets treated with four injections of 30 mg/kg MnCl2·4H2O, but symptoms may develop at higher doses and longer exposure periods.
In summary, the primary area V1 in the marmoset visual cortex can be accurately identified in vivo and distinguished from other areas of the visual cortex using manganese-enhanced MRI. This provides a non-destructive, longitudinal tool to monitor anatomical and functional changes in the brain during development, learning and aging, as well the pathological changes caused by brain injury or neurological disorders.
Acknowledgements
The authors would like to acknowledge the technical assistance of Lisa Zhang and the veterinary care and advice of Dr. James O’Malley. This research was supported by the Intramural Research Program of the NIH, NINDS (Alan P. Koretsky, Scientific Director). Nicholas Bock is the recipient of a Natural Sciences and Engineering Research Council of Canada postdoctoral fellowship.
References
- 1.Brodmann K. Vergleichende lokalisationslehre der grosshirnrinde in ihren prinzipien dargestellt auf grund des zellenbaues. Leipzig: Johann Ambrosius Barth Verlag; 1909. [Google Scholar]
- 2.Amunts K, Malikovic A, Mohlberg H, Schormann T, Zilles K. Brodmann's areas 17 and 18 brought into stereotaxic space-where and how variable? Neuroimage. 2000;11(1):66–84. doi: 10.1006/nimg.1999.0516. [DOI] [PubMed] [Google Scholar]
- 3.Peters A, Sethares C. Myelinated axons and the pyramidal cell modules in monkey primary visual cortex. J Comp Neurol. 1996;365(2):232–255. doi: 10.1002/(SICI)1096-9861(19960205)365:2<232::AID-CNE3>3.0.CO;2-6. [DOI] [PubMed] [Google Scholar]
- 4.Vogt C, Vogt O. Allgemeinere ergebnisse unserer hirnforschung. J Psychol Neurol. 1919;25:292–398. [Google Scholar]
- 5.Adams DL, Sincich LC, Horton JC. Complete pattern of ocular dominance columns in human primary visual cortex. J Neurosci. 2007;27(39):10391–10403. doi: 10.1523/JNEUROSCI.2923-07.2007. [DOI] [PMC free article] [PubMed] [Google Scholar]
- 6.Livingstone MS, Hubel DH. Thalamic inputs to cytochrome oxidase-rich regions in monkey visual cortex. Proc Natl Acad Sci U S A. 1982;79(19):6098–6101. doi: 10.1073/pnas.79.19.6098. [DOI] [PMC free article] [PubMed] [Google Scholar]
- 7.Spatz WB, Illing RB, Weisenhorn DM. Distribution of cytochrome oxidase and parvalbumin in the primary visual cortex of the adult and neonate monkey, Callithrix jacchus. J Comp Neurol. 1994;339(4):519–534. doi: 10.1002/cne.903390405. [DOI] [PubMed] [Google Scholar]
- 8.Blumcke I, Hof PR, Morrison JH, Celio MR. Distribution of parvalbumin immunoreactivity in the visual cortex of Old World monkeys and humans. J Comp Neurol. 1990;301(3):417–432. doi: 10.1002/cne.903010307. [DOI] [PubMed] [Google Scholar]
- 9.Duyn JH, van GP, Li TQ, de Zwart JA, Koretsky AP, Fukunaga M. High-field MRI of brain cortical substructure based on signal phase. Proc Natl Acad Sci U S A. 2007;104(28):11796–11801. doi: 10.1073/pnas.0610821104. [DOI] [PMC free article] [PubMed] [Google Scholar]
- 10.Barbier EL, Marrett S, Danek A, Vortmeyer A, van GP, Duyn J, Bandettini P, Grafman J, Koretsky AP. Imaging cortical anatomy by high-resolution MR at 3.0T: detection of the stripe of Gennari in visual area 17. Magn Reson Med. 2002;48(4):735–738. doi: 10.1002/mrm.10255. [DOI] [PubMed] [Google Scholar]
- 11.Goense JB, Zappe AC, Logothetis NK. High-resolution fMRI of macaque V1. Magn Reson Imaging. 2007;25(6):740–747. doi: 10.1016/j.mri.2007.02.013. [DOI] [PubMed] [Google Scholar]
- 12.Silva AC, Lee JH, Wu CW, Tucciarone J, Pelled G, Aoki I, Koretsky AP. Detection of cortical laminar architecture using manganese-enhanced MRI. J Neurosci Methods. 2008;167(2):246–257. doi: 10.1016/j.jneumeth.2007.08.020. [DOI] [PMC free article] [PubMed] [Google Scholar]
- 13.Angenstein F, Niessen HG, Goldschmidt J, Lison H, Altrock WD, Gundelfinger ED, Scheich H. Manganese-enhanced MRI reveals structural and functional changes in the cortex of Bassoon mutant mice. Cereb Cortex. 2007;17(1):28–36. doi: 10.1093/cercor/bhj121. [DOI] [PubMed] [Google Scholar]
- 14.Kang YS, Gore JC. Studies of tissue NMR relaxation enhancement by manganese. Dose and time dependences. Invest Radiol. 1984;19(5):399–407. doi: 10.1097/00004424-198409000-00012. [DOI] [PubMed] [Google Scholar]
- 15.Wang J, Qiu M, Constable RT. In vivo method for correcting transmit/receive nonuniformities with phased array coils. Magn Reson Med. 2005;53(3):666–674. doi: 10.1002/mrm.20377. [DOI] [PubMed] [Google Scholar]
- 16.Bock NA, Paiva FF, Silva AC. Fractionated manganese-enhanced MRI. NMR Biomed. 2008;21(5):473–478. doi: 10.1002/nbm.1211. [DOI] [PMC free article] [PubMed] [Google Scholar]
- 17.Wong-Riley M. Changes in the visual system of monocularly sutured or enucleated cats demonstrable with cytochrome oxidase histochemistry. Brain Res. 1979;171(1):11–28. doi: 10.1016/0006-8993(79)90728-5. [DOI] [PubMed] [Google Scholar]
- 18.Strazielle C, Hayzoun K, Derer M, Mariani J, Lalonde R. Regional brain variations of cytochrome oxidase activity in Relnrl-orl mutant mice. J Neurosci Res. 2006;83(5):821–831. doi: 10.1002/jnr.20772. [DOI] [PubMed] [Google Scholar]
- 19.Johnson GA, Cofer GP, Gewalt SL, Hedlund LW. Morphologic phenotyping with MR microscopy: the visible mouse. Radiology. 2002;222(3):789–793. doi: 10.1148/radiol.2223010531. [DOI] [PubMed] [Google Scholar]
- 20.Bock NA, Paiva FF, Nascimento GC, Newman JD, Silva AC. Cerebrospinal fluid to brain transport of manganese in a non-human primate revealed by MRI. Brain Res. 2008;1198:160–170. doi: 10.1016/j.brainres.2007.12.065. [DOI] [PMC free article] [PubMed] [Google Scholar]
- 21.Ingersoll RT, Montgomery EB, Jr, Aposhian HV. Central nervous system toxicity of manganese. I. Inhibition of spontaneous motor activity in rats after intrathecal administration of manganese chloride. Fundam Appl Toxicol. 1995;27(1):106–113. doi: 10.1006/faat.1995.1113. [DOI] [PubMed] [Google Scholar]
- 22.Rosa MG, Tweedale R. Brain maps, great and small: lessons from comparative studies of primate visual cortical organization. Philos Trans R Soc Lond B Biol Sci. 2005;360(1456):665–691. doi: 10.1098/rstb.2005.1626. [DOI] [PMC free article] [PubMed] [Google Scholar]
- 23.Lyon DC, Kaas JH. Connectional and architectonic evidence for dorsal and ventral V3, and dorsomedial area in marmoset monkeys. J Neurosci. 2001;21(1):249–261. doi: 10.1523/JNEUROSCI.21-01-00249.2001. [DOI] [PMC free article] [PubMed] [Google Scholar]
- 24.Pessoa VF, Abrahao JC, Pacheco RA, Pereira LC, Magalhaes-Castro B, Saraiva PE. Relative sizes of cortical visual areas in marmosets: functional and phylogenetic implications. Exp Brain Res. 1992;88(2):459–462. doi: 10.1007/BF02259123. [DOI] [PubMed] [Google Scholar]
- 25.Rosa MG, Fritsches KA, Elston GN. The second visual area in the marmoset monkey: visuotopic organisation, magnification factors, architectonical boundaries, and modularity. J Comp Neurol. 1997;387(4):547–567. doi: 10.1002/(sici)1096-9861(19971103)387:4<547::aid-cne6>3.0.co;2-2. [DOI] [PubMed] [Google Scholar]
- 26.Garrick MD, Dolan KG, Horbinski C, Ghio AJ, Higgins D, Porubcin MM, Moore EG, Hainsworth LN, Umbreit JN, Conrad ME, Feng L, Lis A, Roth JA, Singleton S, Garrick LM. DMT1: a mammalian transporter for multiple metals. Biometals. 2003;16(1):41–54. doi: 10.1023/a:1020702213099. [DOI] [PubMed] [Google Scholar]
- 27.Aschner M, Gannon M. Manganese (Mn) transport across the rat blood-brain barrier: saturable and transferrin-dependent transport mechanisms. Brain Res Bull. 1994;33(3):345–349. doi: 10.1016/0361-9230(94)90204-6. [DOI] [PubMed] [Google Scholar]
- 28.Narita K, Kawasaki F, Kita H. Mn and Mg influxes through Ca channels of motor nerve terminals are prevented by verapamil in frogs. Brain Res. 1990;510(2):289–295. doi: 10.1016/0006-8993(90)91379-u. [DOI] [PubMed] [Google Scholar]
- 29.Takeda A, Sawashita J, Okada S. Biological half-lives of zinc and manganese in rat brain. Brain Res. 1995;695(1):53–58. doi: 10.1016/0006-8993(95)00916-e. [DOI] [PubMed] [Google Scholar]
- 30.Takeda A. Manganese action in brain function. Brain Res Rev. 2003;41(1):79–87. doi: 10.1016/s0165-0173(02)00234-5. [DOI] [PubMed] [Google Scholar]
- 31.Gavin CE, Gunter KK, Gunter TE. Manganese and calcium transport in mitochondria: implications for manganese toxicity. Neurotoxicology. 1999;20(2–3):445–453. [PubMed] [Google Scholar]
- 32.Yang J, Wu EX. Detection of cortical gray matter lesion in the late phase of mild hypoxic-ischemic injury by manganese-enhanced MRI. Neuroimage. 2008;39(2):669–679. doi: 10.1016/j.neuroimage.2007.09.009. [DOI] [PubMed] [Google Scholar]
- 33.Lin YJ, Koretsky AP. Manganese ion enhances T1-weighted MRI during brain activation: an approach to direct imaging of brain function. Magn Reson Med. 1997;38(3):378–388. doi: 10.1002/mrm.1910380305. [DOI] [PubMed] [Google Scholar]
- 34.Yu X, Wadghiri YZ, Sanes DH, Turnbull DH. In vivo auditory brain mapping in mice with Mn-enhanced MRI. Nat Neurosci. 2005;8(7):961–968. doi: 10.1038/nn1477. [DOI] [PMC free article] [PubMed] [Google Scholar]
- 35.Kennedy C, Des Rosiers MH, Sakurada O, Shinohara M, Reivich M, Jehle JW, Sokoloff L. Metabolic mapping of the primary visual system of the monkey by means of the autoradiographic [14C]deoxyglucose technique. Proc Natl Acad Sci U S A. 1976;73(11):4230–4234. doi: 10.1073/pnas.73.11.4230. [DOI] [PMC free article] [PubMed] [Google Scholar]
- 36.Pal PK, Samii A, Calne DB. Manganese neurotoxicity: a review of clinical features, imaging and pathology. Neurotoxicology. 1999;20(2–3):227–238. [PubMed] [Google Scholar]
- 37.Olanow CW, Good PF, Shinotoh H, Hewitt KA, Vingerhoets F, Snow BJ, Beal MF, Calne DB, Perl DP. Manganese intoxication in the rhesus monkey: a clinical, imaging, pathologic, and biochemical study. Neurology. 1996;46(2):492–498. doi: 10.1212/wnl.46.2.492. [DOI] [PubMed] [Google Scholar]


