

Abstract
The paucity of murine memory B cell markers has been a significant impediment to the study of memory. The most commonly used marker is IgG, which is neither sensitive nor specific, because activated nonmemory cells can be IgG+, and memory cells can be IgM+. In this article, we show that, together, PD-L2 (CD273), CD80, and CD73 define at least five phenotypic subsets of murine memory B cells. These subsets are generated from naive cells bearing a single BCR in response to a single T-dependent Ag. This diversity is independent of class switch, because IgG1- and IgM-bearing memory cells are found within each compartment. Memory subsets defined by PD-L2, CD80, and CD73 are biologically distinct from one another, because they differ in ontogeny and selection. Together, these distinctions suggest that there is a spectrum of memory B cells and progressive acquisition from more naive-like to more memory-like properties.
Emerging evidence suggests that intrinsic memory B cell properties contribute to the unique quality of the secondary response (1–6). Based on precedents in T cells (7) and the observation of phenotypic heterogeneity among human memory B cells (8–12), it seems likely that memory B cell subtypes serve distinct functions.
Much of what is known about memory B cell biology comes from humans, in whom CD27 marks a population of Ag-experienced cells (11, 13). Intriguingly, several other surface proteins, including FcRH4 (8), CD80 (9), and BCR isotype (10, 11), define additional subsets of human Ag-experienced cells, and there is also evidence for CD27neg memory cells (12). These heterogeneous populations likely arise from naive precursors of various affinities and specificities after exposure to different Ags via multiple routes at different, often undefined, periods of time prior to sampling. The inability to pinpoint origins of heterogeneity reflects inherent limitations in the study of humans.
Our laboratory has developed murine systems in which memory B cells arise from immunization of naive cells bearing a defined BCR (3, 5, 14, 15). More than 12 wk following a single immunization, these systems generate a stably expanded population of Ag-specific, Ag-experienced cells, which meets the functional definition of memory B cells. Using such systems, we demonstrated that PD-L2 (CD273) (16), CD80 (3), and CD73 (3) were all expressed at higher levels among memory B cells compared with naive B cells. Interestingly, however, for each of these markers, expression was elevated only on a fraction of memory cells (3), suggesting unexpected diversity within the memory compartment.
In this study, we used detection of PD-L2, CD80, and CD73 to reveal remarkable phenotypic heterogeneity among memory B cells, defining at least five distinct subsets of memory cells. Notably, each of these subsets exists among IgM and switched-memory B cells. Further, we demonstrate ontogenic differences among these subsets, and, based on V-region sequence analysis, conclude that the subsets are not undergoing interconversion in a resting immune animal. Together, these data give substantial insight into the memory B cell compartment. They delineate a variety of stable subsets of murine memory B cells, provide markers to identify them, and give clues to their function and origin.
Materials and Methods
Mice, transfers and immunizations, and generation of murine memory B cells
mVh186.2 (B1-8) transgenic (Tg), Vh186.2 (B1-8) site-directed-Tg (Sd-Tg), Jh knockout (KO), Jκ KO, AM14 Tg, and Vκ8R mice were bred and maintained as described (5, 15). C57BL/6J were purchased from The Jackson Laboratory (Bar Harbor, ME). The Yale Institutional Animal Care and Use Committee approved all animal experiments.
Nitrophenyl (NP)-reactive memory B cells were generated in previously validated systems after i.p. immunization with NP25-chicken γ-globulin (4-hydroxy-3-nitrophenyl)acetyl chicken γ-globulin (NP-CGG) precipitated in alum. Memory cells were generated in BALB/c background mVh186.2 Tg JH KO mice after two immunizations spaced 6 wk apart (5, 14), in wild-type Bl/6 mice after a single immunization (3), and from donor BALB/c background B1-8 Sd-Tg splenocytes after i.v. adoptive transfer into recipient animals and subsequent immunization (5, 15). Adoptive-transfer recipients were AM14 Tg × Vκ8R Tg F1; parental strains were CB.17 or Bl/6 (AM14 Tg) and BALB/c (Vk8R Tg). These recipients mount poor endogenous NP responses because their B cells predominantly harbor the irrelevant AM14 IgH/Vκ8R IgL specificity. Transferred precursor numbers were confirmed to be within 10% of the intended dose by flow cytometry. Flow-cytometric analysis of CD38 and CD95 expression confirmed the resting, nonactivated phenotype of the memory populations.
Identification of Ag-specific memory B cells formed in response to immunization with NP-CGG was accomplished using (4-hydroxy-5-iodo-3-nitrophenyl)acetyl (NIP)-conjugated fluorochromes. In the context of these adoptive-transfer systems, NP- and NIP-conjugated reagents have similar efficacy in identifying Ag-specific memory B cells. Frequencies of NP- and NIP-binding B cells were similar, and both identified a similar λhi κlow population (Supplemental Fig. 1A).
Purification and analysis of cells by flow cytometry
Single-cell suspensions of RBC-depleted splenocytes were stained for flowcytometric analysis (5, 17), analyzed, and sorted on an LSRII or FACSAria (BD Biosciences, San Jose, CA); data were analyzed with FlowJo (Tree Star, Ashland, OR), as described (5).
Anti-κ (187.1), anti-IgMa (RS3.1), anti-CD80 (16-10A1), and labeled-NIP and NP reagents were produced in our laboratory. Anti-IgG1 (A85-1), anti-CD73 (TY/23), anti-CD38 (90), anti-B220 (RA3-6B2), anti-CD19 (1D3), anti-CD95/Fas (Jo2), and streptavidin reagents were from BD Biosciences. Anti-CD80 (16-10A1) and anti-IgD (11-26c.2a) Abs were from BioLegend (San Diego, CA), and anti-CD273/PD-L2 (TY25) was from eBioscience (San Diego, CA). Ethidium monoazide was from Molecular Probes (Carlsbad, CA), and propidium iodide was from Invitrogen (Carlsbad, CA).
Mutational analysis
Vλ1 sequences were amplified and sequenced from FACS-sorted cells and aligned to a rearranged germline Vλ1/Jλ1 sequence, as described (3). Statistical analysis of replacement and silent mutations in the CDR and framework regions of the Vλ1 sequences to detect selection was performed as described (18).
Statistical analysis
Statistical significance of differences between groups was determined by the unpaired Student t test.
Results and Discussion
There are phenotypic subsets of murine memory B cells
The bimodal expression of the PD-L2, CD80, and CD73 markers suggested that together they might define novel subsets of memory B cells. To test this idea, we used flow cytometry to examine their expression on memory B cells. NP-reactive splenic B cells from Vh186.2 Sd-Tg donor mice were transferred into recipients that harbor irrelevant specificity-encoding IgH + L chain transgenes and, hence, mount a poor endogenous NP response (see Materials and Methods). Mice were then immunized with NP-CGG precipitated in alum and evaluated 12–20 wk later for the nature of the NP-specific memory compartment. PD-L2 or CD80, together with CD73, each defined four populations of cells. In contrast, CD80 and PD-L2 defined three populations (Fig. 1A). These markers identified similar subsets among memory B cells generated in three independent memory systems, including in wild-type mice (Supplemental Fig. 2). These subsets were identified equally well by the use of NP- or NIP-reagents (Supplemental Fig. 1B); the NIP-reagent was used throughout the remainder of this study. Memory B cell subsets, as defined by PD-L2 and CD73, were also identified among isotype-switched (IgD−) NIP-specific memory B cells in wild-type mice (Supplemental Fig. 2C).
Figure 1.
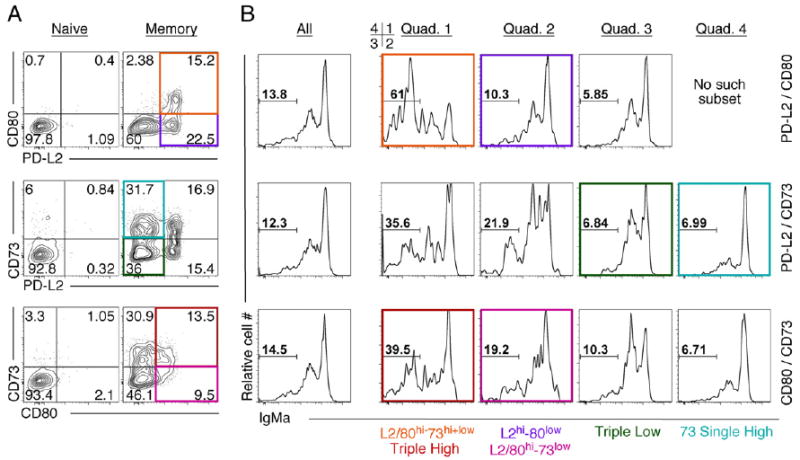
Surface expression of PD-L2 (CD273), CD80, and CD73 define phenotypic subsets of IgM and isotype-switched memory B cells. Memory cells were generated after adoptive transfer of Vh186.2 Sd-Tg BALB/c splenic B cells into AM14 × Vκ8R Tg CB.17 recipients, immunization with NP-CGG precipitated in alum, and 12–20 wk rest. Naive cells were harvested from unimmunized Vh186.2 Sd-Tg mice. The percentage of the parent population of each quadrant or gate is indicated for individual mice shown. A, FACS plots of splenocytes stained with Abs to the indicated markers gated on live, NIP-binding κneg splenic B cells. Representative plots for >11 mice are shown. B, Representative graphs of IgM staining of memory B cell subpopulations defined as in A. Individual quadrants are depicted clockwise, beginning with the upper right. Parallel stains with anti-IgG1 (data not shown) confirmed the IgM− gates. Naive B cells were lacking IgM− and IgG1+ populations (data not shown). Representative plots from at least five individual mice per dose are shown. Specific memory subpopulations discussed in the text are highlighted in color.
Although technical limitations prevented us from examining all three markers simultaneously, the observation that virtually all CD80hi cells were found within the larger PD-L2hi population (Fig. 1A, upper right panel) means that expression of PD-L2, CD80, and CD73 defines, at a minimum, the following five phenotypic subsets of murine memory B cells: Triple Low (PD-L2lowCD73low cells that are also CD80low), Triple High (CD80hiCD73hi that are also PD-L2hi), CD73 Single High (PD-L2lowCD73hi that are also CD80low), L2/ 80hi–73low (PD-L2hiCD80hiCD73low, because CD80hiCD73low cells are also PD-L2hi), and L2hi80low (PD-L2hiCD80low, which may or may not be subdivided by CD73 expression). From these observations, we formulated the hypothesis that memory cells could progressively acquire markers and properties that distinguish them from naive cells and instead are associated with more memory-like qualities; in this context, cells that are CD80hi and/or PD-L2hi would be considered more memory-like.
Because the memory B cell pool is composed of IgM and isotype-switched–bearing cells (3, 6, 14, 19), we next asked whether upregulation of PD-L2, CD80, or CD73 was related to isotype switch. IgG1 is the dominant switched isotype in the NP response; however, as a result of interactions between anti-IgG and anti–PD-L2 reagents, we could not directly coexamine their expression. Instead, we stained memory B cells with anti-IgM Abs and gated on cells that were clearly negative to identify isotype-switched cells. Memory B cells were gated by subset and then IgM expression was evaluated. Isotype-switched (IgM−) and unswitched (IgM+) B cells were found in each subset, although not at equal frequencies (Fig. 1B). Subsets with a rate of switch significantly higher than the overall memory population were the Triple High and the overlapping L2/80hi–73hi+low subsets (39.5% and 61%, respectively). Subsets with a frequency of switch lower than the overall population were the Triple Low and the CD73 Single High subsets (6.8% and 7.0% switched, respectively). Together, these data indicated that upregulation of the PD-L2, CD80, or CD73 memory markers is not causally linked with isotype switch. However, consistent with the working hypothesis stated above, CD80hi and/or PD-L2hi memory cells are more likely to bear isotype-switched BCRs than are other memory cells; thus, they might be said to have a more memory-like phenotype with regard to isotype switch. In contrast, upregulation of CD73 alone is not correlated with isotype switch. Thus, although BCR isotype correlates to a degree with expression of PD-L2 and CD80, it defines an additional independent level of diversity within the murine memory B cell pool.
Memory B cell subset formation depends on precursor frequency
Initial experiments investigated memory B cells arising in systems with relatively high frequencies of naive precursors. Directly immunized mVh186.2 Tg mice had 1.5–3.0 × 10⁶ endogenous splenic precursors. In Vh186.2 Tg or Sd-Tg adoptive-transfer recipient mice, there were 1 × 10⁶ transferred precursors, of which, <10% could have been expected to have lodged in secondary lymphoid organs and to have participated in the immune response (20). In the study of T cells, it was shown that precursor frequency influences memory formation (20).
To determine whether precursor frequency influences the size of the memory B cell pool or the distribution of different subsets formed, we titrated the number of NP-reactive naive precursors transferred to recipients containing essentially no NP-specific B cells across a broad range. Because wild-type Bl/6 mice have ∼10,000 NP-reactive B cells per spleen (21) (Supplemental Fig. 3), we designed a titration range that included lower and higher precursor doses. Splenocytes containing 1 × 10⁶, 5 × 10⁴, or 1 × 10³ NP-reactive B cells were transferred into AM14 × Vκ8R recipient mice of two background strains: CB.17 or Bl/6 × BALB/c F1. The CB.17 recipient system was technically superior, because it permitted greater donor B cell expansion and had less of an endogenous response so that the resultant signal-to-noise ratio was larger. Nonetheless, results in the two systems paralleled one another. Fig. 2 and the values in the text below are derived from the CB.17 system; both data sets are summarized in Supplemental Table I.
Figure 2.
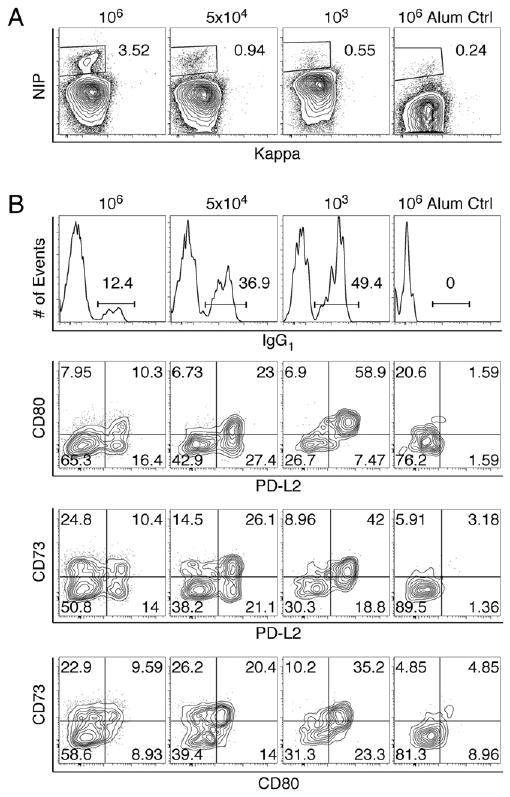
Memory B cell subset formation is influenced by naive precursor frequency. Memory B cells were generated from the indicated numbers of naive NP-specific B cells after adoptive transfer of Vh186.2 Sd-Tg donor splenocytes into AM14 × Vκ8R CB.17 recipients, i.p. immunization with NP-CGG precipitated in alum, and ≥12 wk rest. The number of naive NP-reactive B cells adoptively transferred is indicated above each column. The percentage of the parent population is indicated adjacent to the gates or within the respective quadrant. Representative plots from three to five individual mice per cell dose are shown. A, FACS plots of live splenic B cells demonstrating NIP binding and κ L chain expression. B, FACS graphs and plots of NIP-binding B cells gated as in A, stained with Abs to the indicated markers.
The frequency of memory cells among splenic B cells diminished, but not proportionally, when fewer precursors were transferred (Fig. 2A). From baseline (106), precursors were diluted 20- and 1000-fold (5 × 10⁴ and 103 cells). In response, numbers of resultant total memory cells decreased by an average of only 7.1- and 9.4-fold of the baseline response (Supplemental Table I, row 5). Thus, as was described in T cell systems (20), the relative yield of memory cells increased as precursors were diluted.
In these experiments, an average of 1.6, 4.5, and 168.7 memory B cells was generated per transferred precursor at each respective dose (Supplemental Table I, row 6). However, these numbers almost certainly underestimate the actual relative precursor to progeny expansion. First, as alluded to above, most transferred lymphocytes are thought not to survive to participate in the immune response, so the true precursor frequencies are likely at least 10-fold lower. Second, these calculations of the splenic memory pool underestimate the size of the total memory pool, which includes memory cells in other lymphoid organs. However, it is reasonable to assume that these variables are equal across experimental groups, so the relative differences in expansion hold true.
With fewer precursors, the fraction of the memory pool bearing isotype-switched BCRs increased (Fig. 2B, Supplemental Table I, row 10), indicating that average expansion of isotype-switched memory B cells also increased. Normalized to expansion at the baseline 106 naive precursor dose, the lower doses resulted in 23.5- and 762.3-fold greater average expansion into IgG1 memory B cells, respectively (Supplemental Table I, row 12).
Interestingly, precursor frequency also affected the distribution of resultant phenotypic subsets of memory B cells. With smaller numbers of naive precursors, the resulting memory population was enriched for cells that had increased expression of PD-L2, CD80, and CD73 (Fig. 2B). For example, as precursors were titrated down, PD-L2hi cells increased from 24.6 to 49.6 to 59.9% of the total memory pool (Supplemental Table I, row 13). Conversely, the Triple Low subset decreased in frequency from an average of 37–56.7% to 31.9% of total memory B cells (Supplemental Table I, row 14). The enrichment in PD-L2hi and decrease in Triple Low memory B cells occurred among unswitched and switched memory B cells (Supplemental Fig. 4, Supplemental Table I, rows 13–16). Thus, like switched memory B cells, unswitched memory cells acquire a more memory-like phenotype when precursors are limiting and the resultant memory cells have arisen after a greater degree of expansion.
Mechanistically, how is it that proportionally more memory cells are generated when precursors are limiting? The simplest explanation is that at the lowest dose, memory precursors divided more. The increased class switch observed among memory B cells at lower precursor doses supports this hypothesis, because switch is division linked (22). It is also possible that death rates were higher when precursors were more plentiful; competition for survival factors could impose such homeostatic constraints.
BCR mutation rates differ among memory B cell subsets
To further understand the relationships between these memory subsets, we sorted memory cells based on PD-L2, CD80, and BCR isotype expression and sequenced theirVλ1 gene segments (Supplemental Table II). Overall, the frequency of Vλ1 gene segments containing mutations and the mutational content per Vλ1 gene were higher among switched (IgM−) cells compared with unswitched (IgM+) cells. These frequencies were also higher among cells that upregulated CD80 and PD-L2 compared with those that had not. Thus, all 30 sequences derived from IgM+ L2/80low cells were unmutated, whereas 28/31 (90.3%) of isotype-switched L2/80hi cells had mutated Vλ1 gene segments. Regardless of BCR isotype, nearly all L2/80hi cells had mutated Vλ1 gene segments (82.5% versus 90.3% for IgM+ versus IgM−, respectively). However, mutational content per sequence was greater (4.7 versus 2.65) among isotype-switched cells. We also analyzed the quality of mutations across these subsets. There was positive selection of replacement mutations in the CDR regions among switched L2/80hi cells (p < 0.001) and negative selection of replacement mutations in the framework regions among IgM+ L2/80hi cells (p = 0.003), switched L2hi/80low cells (p = 0.002), and switched L2/80hi cells (p = 0.011). However, the patterns of mutations in other subsets did not show evidence of such positive or negative selection, consistent with the notion that they had undergone fewer rounds of mutation and selection in the germinal center (GC) prior to differentiating into memory cells. Hence, the most memory-like cells showed the strongest evidence of having undergone selection.
These data argue that memory B cells do not fluidly shift back and forth between subsets, such as might be predicted if these subsets represented different activation states. If cells switched between subsets, mutations would not be compartmentalized but rather would be equally distributed among subsets, because hypermutation occurred prior to memory differentiation. Rather, memory B cells from different subsets seem to be derived from different developmental experiences. One possible explanation is that memory cells with higher mutational content and greater affinity maturation spent a longer time in the GC and received relatively more cognate T cell help than did those with lesser mutational content and lesser affinity maturation (23). It is also possible that subsets with less frequent mutations were generated outside of the GC (19, 23). Assuming a steady rate of mutation per cell division, these data also support the notion, again commensurate with the effects of precursor frequency on expansion and subset distribution, that subset development and proliferation are linked.
In summary, the data presented suggest that some memory B cell subsets are more memory-like, whereas others are more naive-like. Memory-like subsets have higher frequencies of class-switched B cells and higher mutational content. They also tend to express markers found only on memory B cells and not follicular naive B cells. Thus, those that have upregulated PD-L2 and CD80 (L2/80hi) seem to be the most memory-like. This subset is enriched in switched cells and in cells with high mutational content (even when IgM bearing); it also demonstrates the effects of Ag-driven selection on the patterns of V-region mutations. Conversely, the Triple Low and the CD73 Single High subsets are more naive-like. These have lower rates of mutation, and are infrequently isotype switched.
Our observation that marker upregulation and class switch correlate with the extent of precursor expansion suggests that both processes, although independent, are division linked. Increased probability of switch per division in vitro was described (22) and could be a useful model for how marker upregulation and switch are correlated with one another, yet independent. Increased cell divisions as a requirement for the ontogeny of L2/80hi memory B cells might also provide an explanation for why this subset is enriched in mutational content, because mutations would accumulate over subsequent divisions.
Recent work in the murine system by Dogan et al. (6) demonstrated that subpopulations of Ag-experienced cells tend toward separate functions in the secondary response. Although that study presented the concept of memory B cell heterogeneity, only two resting populations were defined (because other cells considered were persistent GC B cells): IgM and switched. Our data are consistent with this observation but go further to demonstrate clearly that IgM memory itself is heterogeneous. IgM memory includes all subsets defined by PD-L2, CD80, and CD73 expression and includes mutated and nonmutated cells, suggesting that functional diversity must exist within this compartment. Furthermore, we found that switched memory is also heterogeneous in terms of marker expression and rate of mutation. Thus, although IgM and switched isotypes may be gross proxy markers for biologically significant subpopulations of memory cells, the markers we described in this article offer greater precision and clearly define common properties, including degree of mutation, independent of class switch.
Taken together, our data demonstrate that there is significantly more heterogeneity within the murine memory B cell compartment than has been previously appreciated. In addition, we shed light on the ontogeny of these subsets, with more memory-like ones arising under conditions of greater clonal expansion. This study should be of importance to the field, because we define markers to readily identify different types of memory B cells. Thus, this report provides both important insights and needed tools for the study of murine B cell memory.
Acknowledgments
We thank E. Song, L. Conter, the Yale Animal Resources Center, and the Yale Cell Sorting Facility for expert assistance and M. Cancro, K.G. Jacobson, G. Zuccarino-Catania, and A. Haberman for insightful discussions.
This work was supported by National Institutes of Health Grants A143603 and K08AI78533. M.M.T. was supported by the Dermatology Foundation and the Arthritis Foundation.
Abbreviations used in this paper
- CGG
chicken γ-globulin
- GC
germinal center
- KO
knockout
- NIP
(4-hydroxy-5-iodo-3-nitrophenyl)acetyl
- NP
nitrophenyl
- NP-CGG
(4-hydroxy-3-nitrophenyl)acetyl chicken γ-globulin
- Sd-Tg
site-directed transgenic
- Tg
transgenic
Footnotes
The online version of this article contains supplemental material.
Disclosures: The authors have no financial conflicts of interest.
Supplementary Material
Suppl. Fig. 1. NIP- and NP-conjugated fluorochromes effectively identify memory B cells and memory B cell subsets expanded in response to immunization with NP-CGG. Memory B cells were generated in AM14 Tg × Vκ8R Sd.-Tg CB.17 recipients after adoptive transfer of B1.8 Sd.-Tg Jκ KO splenic B cells and immunization with NP-CGG in alum. Splenic B cells were stained with NP- or NIP-APC in combination with other markers for memory B cells and analyzed by flow cytometry. A. Shown are FACS plots of live splenic B cells. NP- and NIP-APC identify similar fractions of B cells. These Ag-specific cells are predominately κIow λhi. Mice A and B have different frequencies of Ag-specific cells, demonstrating that these properties are consistent over more than a 10-fold range. B. Shown are FACS plots of live splenic B cells gated by NP or NIP binding and by lgG1 expression. For comparison, on the left are are plots of naïve NP- or NIP- IgG1-B cells isolated from recipient mice immunized with alum alone. The protocol for simultaneous evaluation of PD-L2 and lgG1 expression was developed subsequent to submission of the manuscript.
Suppl. Fig. 2. Surface expression of PD-L2 (CD273), CD80 and CD73 define phenotypic subsets of both IgM and switched memory B cells in multiple systems, including immunized wild-type mice. Shown are FACS plots of live NIP-binding κneg splenic B cells stained with antibodies to the indicated markers. The % of the parent population for the individual mice shown is indicated in the individual quadrants. A. Memory B cells were generated in mVh186.2 Tg mice after 2 i.p. immunizations with NP-CGG in alum, spaced 6 weeks apart, and subsequent rest for 12-20 weeks. Note that in this system, all memory cells are IgM-bearing and produce only membrane-bound Ab due to the use of the mVh186.2 IgH Tg. Naive ceils were isolated from unimmunized Vh186.2Tg mice. Representative plots of at least 5 individual mice are shown. B. Memory B cells were generated in wild-type BI/6 mice after i.p. immunization with NP-CGG in alum (memory) or alum alone (naive) and 12.5 weeks rest. Representative plots of NIP-binding splenic B cells from 2-6 individual mice are shown. C. Memory B cells were generated in wild-type BI/6 mice as described in B. Switched (IgD-) NIP-binding splenic memory B cells are shown. PD-L2loW CD73loW Triple Low cells comprised an average of 19.6 % (+/- 7.0%) of the total switched memory B cell population. Plots are from individual mice and are representative of 4 mice total.
Suppl. Fig. 3. Frequency of NP-reactive B cells among splenocytes of unimmunized wild-type BI/6 mice. Shown are FACS plots of live-gated splenocytes stained with APC-NP or APC alone and PE-anti-CD19. A representative plot of 4 mice total is shown.
Splenocytes ranged from 80-100 million per mouse.
Suppl. Fig. 4. Unswitched memory B cell subset formation is influenced by naïve precursor frequency. Memory B cells were generated after adoptive transfer of the indicated numbers (above each plot) of Vh186.2 Sd-Tg (Balb/c background) splenic B cells into AM14 × Vκ8R Tg BI/6 × Balb/c F1 recipients, immunization with NP-CGG in alum, and 10 weeks rest. Shown are data from at least 3 individual mice per cell dose. A. FACS plots of NIP versus IgD staining of live splenic B cells. Unswitched memory cells are found within the oval-shaped lgDhi NIP+ gate. The total NP-specific B cell gate was drawn to exclude the population of B cells that bind NIP via NP-specific cytophilic antibody bound to the FCR. Averaged frequencies of the gated populations across replicates are shown. B. FACS plots of PD-L2 and CD73 staining of total (top row) versus lgD+ (unswitched, bottom row) NP-specific splenic B cells, gated as shown in A The % of the parent population for the individual mice shown is indicated for each quadrant. C. Frequency of PD-L2hi (left) and PD-L2low CD73low (Triple Low, right) cells among the unswitched (lgD+) NIP-binding splenic B cell population. P-values from 2-tailed Student's t-tests are indicated above the brackets.
Supplemental Table I. Precursor and progeny relationships in dose response experiments
aCompared with highest (1 million) dose.
bCalculated as (%NIP-binding κlow CD19+ B cells) * (# splenocytes). Alum corrected.
c(# memory cells generated at given dose)/(# memory cells generated from 1 million precursors).
d(# IgG1+ memory cells generated)/(# total memory cells generated).
e(# memory cells generated)/(# naïve precursors).
f(Av. expansion per tx'd precursor at given dose)/(Av. expansion per tx'd precursor from 1 million dose).
gCalculated as (%IgG1+ NIP-binding κlow CD19+ B cells) * (# splenocytes). Alum corrected.
hCalculated from anti-PD-L2 and anti-CD73 stain.
iPD-L2hi CD73low + PD-L2hi CD73hi
jPD-L2low CD73low, which are also CD80low
kGated as IgD+ from the anti-PD-L2 and anti-CD73 stain.
Data were calculated from averaged data from 3-6 individual mice per group.
Supplemental Table II. Comparison of Vλ1 mutations across memory B cell subsets defined by PD-L2 and CD80 expression and Ig isotypea
a1 million Vh186.2 Sd.-Tg naïve precursors were transferred into AM14 × Vκ8R F1 CB.17 background recipients. 17-weeks post i.p. immunization with NP-CGG in alum, spleens from 3 mice were harvested and pooled for sorting. DNA was prepared from the indicated fractions by nested PCR as described in reference 3. PCR products were cloned into bacteria and the inserts in individual colonies were sequenced. The total number of individual colonies sequenced is listed in the second column.
References
- 1.Klein U, Tu Y, Stolovitzky GA, Keller JL, Haddad J, Jr, Miljkovic V, Cattoretti G, Califano A, Dalla-Favera R. Transcriptional analysis of the B cell germinal center reaction. Proc Natl Acad Sci USA. 2003;100:2639–2644. doi: 10.1073/pnas.0437996100. [DOI] [PMC free article] [PubMed] [Google Scholar]
- 2.Tangye SG, Avery DT, Deenick EK, Hodgkin PD. Intrinsic differences in the proliferation of naive and memory human B cells as a mechanism for enhanced secondary immune responses. J Immunol. 2003;170:686–694. doi: 10.4049/jimmunol.170.2.686. [DOI] [PubMed] [Google Scholar]
- 3.Anderson SM, Tomayko MM, Ahuja A, Haberman AM, Shlomchik MJ. New markers for murine memory B cells that define mutated and unmutated subsets. J Exp Med. 2007;204:2103–2114. doi: 10.1084/jem.20062571. [DOI] [PMC free article] [PubMed] [Google Scholar]
- 4.Bhattacharya D, Cheah MT, Franco CB, Hosen N, Pin CL, Sha WC, Weissman IL. Transcriptional profiling of antigen-dependent murine B cell differentiation and memory formation. J Immunol. 2007;179:6808–6819. doi: 10.4049/jimmunol.179.10.6808. [DOI] [PMC free article] [PubMed] [Google Scholar]
- 5.Tomayko MM, Anderson SM, Brayton CE, Sadanand S, Steinel NC, Behrens TW, Shlomchik MJ. Systematic comparison of gene expression between murine memory and naive B cells demonstrates that memory B cells have unique signaling capabilities. J Immunol. 2008;181:27–38. doi: 10.4049/jimmunol.181.1.27. [DOI] [PMC free article] [PubMed] [Google Scholar]
- 6.Dogan I, Bertocci B, Vilmont V, Delbos F, égret JM, Storck S, Reynaud CA, Weill JC. Multiple layers of B cell memory with different effector functions. Nat Immunol. 2009;10:1292–1299. doi: 10.1038/ni.1814. [DOI] [PubMed] [Google Scholar]
- 7.Lefrançois L, Marzo AL. The descent of memory T-cell subsets. Nat Rev Immunol. 2006;6:618–623. doi: 10.1038/nri1866. [DOI] [PubMed] [Google Scholar]
- 8.Ehrhardt GR, Hsu JT, Gartland L, Leu CM, Zhang S, Davis RS, Cooper MD. Expression of the immunoregulatory molecule FcRH4 defines a distinctive tissue-based population of memory B cells. J Exp Med. 2005;202:783–791. doi: 10.1084/jem.20050879. [DOI] [PMC free article] [PubMed] [Google Scholar]
- 9.Bar-Or A, Oliveira EM, Anderson DE, Krieger JI, Duddy M, O'Connor KC, Hafler DA. Immunological memory: contribution of memory B cells expressing costimulatory molecules in the resting state. J Immunol. 2001;167:5669–5677. doi: 10.4049/jimmunol.167.10.5669. [DOI] [PubMed] [Google Scholar]
- 10.Klein U, Küppers R, Rajewsky K. Evidence for a large compartment of IgM-expressing memory B cells in humans. Blood. 1997;89:1288–1298. [PubMed] [Google Scholar]
- 11.Klein U, Rajewsky K, Küppers R. Human immunoglobulin (Ig) M+IgD+ peripheral blood B cells expressing the CD27 cell surface antigen carry somatically mutated variable region genes: CD27 as a general marker for somatically mutated (memory) B cells. J Exp Med. 1998;188:1679–1689. doi: 10.1084/jem.188.9.1679. [DOI] [PMC free article] [PubMed] [Google Scholar]
- 12.Sanz I, Wei C, Lee FE, Anolik J. Phenotypic and functional heterogeneity of human memory B cells. Semin Immunol. 2008;20:67–82. doi: 10.1016/j.smim.2007.12.006. [DOI] [PMC free article] [PubMed] [Google Scholar]
- 13.Tangye SG, Liu YJ, Aversa G, Phillips JH, de Vries JE. Identification of functional human splenic memory B cells by expression of CD148 and CD27. J Exp Med. 1998;188:1691–1703. doi: 10.1084/jem.188.9.1691. [DOI] [PMC free article] [PubMed] [Google Scholar]
- 14.Anderson SM, Hannum LG, Shlomchik MJ. Memory B cell survival and function in the absence of secreted antibody and immune complexes on follicular dendritic cells. J Immunol. 2006;176:4515–4519. doi: 10.4049/jimmunol.176.8.4515. [DOI] [PubMed] [Google Scholar]
- 15.Scholz JL, Crowley JE, Tomayko MM, Steinel N, O'Neill PJ, Quinn WJ, III, Goenka R, Miller JP, Cho YH, Long V, et al. BLyS inhibition eliminates primary B cells but leaves natural and acquired humoral immunity intact. Proc Natl Acad Sci USA. 2008;105:15517–15522. doi: 10.1073/pnas.0807841105. [DOI] [PMC free article] [PubMed] [Google Scholar]
- 16.Good-Jacobson KL, Szumilas CG, Chen L, Sharpe AH, Tomayko MM, Shlomchik MJ. PD-1 regulates germinal center B cell survival and the formation and affinity of long-lived plasma cells. Nat Immunol. 2010;11:535–542. doi: 10.1038/ni.1877. [DOI] [PMC free article] [PubMed] [Google Scholar]
- 17.Shlomchik MJ, Zharhary D, Saunders T, Camper SA, Weigert MG. A rheumatoid factor transgenic mouse model of autoantibody regulation. Int Immunol. 1993;5:1329–1341. doi: 10.1093/intimm/5.10.1329. [DOI] [PubMed] [Google Scholar]
- 18.Hershberg U, Uduman M, Shlomchik MJ, Kleinstein SH. Improved methods for detecting selection by mutation analysis of Ig V region sequences. Int Immunol. 2008;20:683–694. doi: 10.1093/intimm/dxn026. [DOI] [PubMed] [Google Scholar]
- 19.Toyama H, Okada S, Hatano M, Takahashi Y, Takeda N, Ichii H, Takemori T, Kuroda Y, Tokuhisa T. Memory B cells without somatic hypermutation are generated from Bcl6-deficient B cells. Immunity. 2002;17:329–339. doi: 10.1016/s1074-7613(02)00387-4. [DOI] [PubMed] [Google Scholar]
- 20.Hataye J, Moon JJ, Khoruts A, Reilly C, Jenkins MK. Naive and memory CD4+ T cell survival controlled by clonal abundance. Science. 2006;312:114–116. doi: 10.1126/science.1124228. [DOI] [PubMed] [Google Scholar]
- 21.McHeyzer-Williams MG, McLean MJ, Lalor PA, Nossal GJ. Antigen-driven B cell differentiation in vivo. J Exp Med. 1993;178:295–307. doi: 10.1084/jem.178.1.295. [DOI] [PMC free article] [PubMed] [Google Scholar]
- 22.Hodgkin PD, Lee JH, Lyons AB. B cell differentiation and isotype switching is related to division cycle number. J Exp Med. 1996;184:277–281. doi: 10.1084/jem.184.1.277. [DOI] [PMC free article] [PubMed] [Google Scholar]
- 23.Inamine A, Takahashi Y, Baba N, Miyake K, Tokuhisa T, Takemori T, Abe R. Two waves of memory B-cell generation in the primary immune response. Int Immunol. 2005;17:581–589. doi: 10.1093/intimm/dxh241. [DOI] [PubMed] [Google Scholar]
Associated Data
This section collects any data citations, data availability statements, or supplementary materials included in this article.
Supplementary Materials
Suppl. Fig. 1. NIP- and NP-conjugated fluorochromes effectively identify memory B cells and memory B cell subsets expanded in response to immunization with NP-CGG. Memory B cells were generated in AM14 Tg × Vκ8R Sd.-Tg CB.17 recipients after adoptive transfer of B1.8 Sd.-Tg Jκ KO splenic B cells and immunization with NP-CGG in alum. Splenic B cells were stained with NP- or NIP-APC in combination with other markers for memory B cells and analyzed by flow cytometry. A. Shown are FACS plots of live splenic B cells. NP- and NIP-APC identify similar fractions of B cells. These Ag-specific cells are predominately κIow λhi. Mice A and B have different frequencies of Ag-specific cells, demonstrating that these properties are consistent over more than a 10-fold range. B. Shown are FACS plots of live splenic B cells gated by NP or NIP binding and by lgG1 expression. For comparison, on the left are are plots of naïve NP- or NIP- IgG1-B cells isolated from recipient mice immunized with alum alone. The protocol for simultaneous evaluation of PD-L2 and lgG1 expression was developed subsequent to submission of the manuscript.
Suppl. Fig. 2. Surface expression of PD-L2 (CD273), CD80 and CD73 define phenotypic subsets of both IgM and switched memory B cells in multiple systems, including immunized wild-type mice. Shown are FACS plots of live NIP-binding κneg splenic B cells stained with antibodies to the indicated markers. The % of the parent population for the individual mice shown is indicated in the individual quadrants. A. Memory B cells were generated in mVh186.2 Tg mice after 2 i.p. immunizations with NP-CGG in alum, spaced 6 weeks apart, and subsequent rest for 12-20 weeks. Note that in this system, all memory cells are IgM-bearing and produce only membrane-bound Ab due to the use of the mVh186.2 IgH Tg. Naive ceils were isolated from unimmunized Vh186.2Tg mice. Representative plots of at least 5 individual mice are shown. B. Memory B cells were generated in wild-type BI/6 mice after i.p. immunization with NP-CGG in alum (memory) or alum alone (naive) and 12.5 weeks rest. Representative plots of NIP-binding splenic B cells from 2-6 individual mice are shown. C. Memory B cells were generated in wild-type BI/6 mice as described in B. Switched (IgD-) NIP-binding splenic memory B cells are shown. PD-L2loW CD73loW Triple Low cells comprised an average of 19.6 % (+/- 7.0%) of the total switched memory B cell population. Plots are from individual mice and are representative of 4 mice total.
Suppl. Fig. 3. Frequency of NP-reactive B cells among splenocytes of unimmunized wild-type BI/6 mice. Shown are FACS plots of live-gated splenocytes stained with APC-NP or APC alone and PE-anti-CD19. A representative plot of 4 mice total is shown.
Splenocytes ranged from 80-100 million per mouse.
Suppl. Fig. 4. Unswitched memory B cell subset formation is influenced by naïve precursor frequency. Memory B cells were generated after adoptive transfer of the indicated numbers (above each plot) of Vh186.2 Sd-Tg (Balb/c background) splenic B cells into AM14 × Vκ8R Tg BI/6 × Balb/c F1 recipients, immunization with NP-CGG in alum, and 10 weeks rest. Shown are data from at least 3 individual mice per cell dose. A. FACS plots of NIP versus IgD staining of live splenic B cells. Unswitched memory cells are found within the oval-shaped lgDhi NIP+ gate. The total NP-specific B cell gate was drawn to exclude the population of B cells that bind NIP via NP-specific cytophilic antibody bound to the FCR. Averaged frequencies of the gated populations across replicates are shown. B. FACS plots of PD-L2 and CD73 staining of total (top row) versus lgD+ (unswitched, bottom row) NP-specific splenic B cells, gated as shown in A The % of the parent population for the individual mice shown is indicated for each quadrant. C. Frequency of PD-L2hi (left) and PD-L2low CD73low (Triple Low, right) cells among the unswitched (lgD+) NIP-binding splenic B cell population. P-values from 2-tailed Student's t-tests are indicated above the brackets.
Supplemental Table I. Precursor and progeny relationships in dose response experiments
aCompared with highest (1 million) dose.
bCalculated as (%NIP-binding κlow CD19+ B cells) * (# splenocytes). Alum corrected.
c(# memory cells generated at given dose)/(# memory cells generated from 1 million precursors).
d(# IgG1+ memory cells generated)/(# total memory cells generated).
e(# memory cells generated)/(# naïve precursors).
f(Av. expansion per tx'd precursor at given dose)/(Av. expansion per tx'd precursor from 1 million dose).
gCalculated as (%IgG1+ NIP-binding κlow CD19+ B cells) * (# splenocytes). Alum corrected.
hCalculated from anti-PD-L2 and anti-CD73 stain.
iPD-L2hi CD73low + PD-L2hi CD73hi
jPD-L2low CD73low, which are also CD80low
kGated as IgD+ from the anti-PD-L2 and anti-CD73 stain.
Data were calculated from averaged data from 3-6 individual mice per group.
Supplemental Table II. Comparison of Vλ1 mutations across memory B cell subsets defined by PD-L2 and CD80 expression and Ig isotypea
a1 million Vh186.2 Sd.-Tg naïve precursors were transferred into AM14 × Vκ8R F1 CB.17 background recipients. 17-weeks post i.p. immunization with NP-CGG in alum, spleens from 3 mice were harvested and pooled for sorting. DNA was prepared from the indicated fractions by nested PCR as described in reference 3. PCR products were cloned into bacteria and the inserts in individual colonies were sequenced. The total number of individual colonies sequenced is listed in the second column.