

Abstract
The goal of opening wedge high tibial osteotomy (HTO) is to reduce excessive loading on the medial compartment of the knee by correcting varus deformity, thereby reducing pain and improving function. Although surgical outcome is reportedly poor in cases of under- or over-correction, the recommended alignment varies. The aim of this study was to investigate the effect of the degree of frontal plane knee alignment following open wedge HTO surgery on muscle co-contraction, joint moments, and self-reported functional outcome. Sixteen patients with medial compartment osteoarthritis (OA), who were scheduled for an opening wedge osteotomy, were recruited for participation in the study. Data were collected using an optoeletric motion analysis system and varus and valgus angulations of the knee were measured, using standing, long cassette, radiographs of the lower extremities. Results showed that physical function improved significantly overall (p < 0.001). However, those subjects whose knee alignment was further away from the group’s postoperative mean tended to improve less in their Knee Outcome Survey-Activities of Daily Living Scale (KOS-ADLS) scores than those closer to the mean (p = 0.07). They also had higher medial and lateral co-contractions and higher adduction moments one year after surgery (p ≤ 0.009 and p = 0.048, respectively) and were more likely to show a change towards increased medial muscle co-contraction following surgery, when compared to presurgical values. This outcome may contribute to accelerated degeneration of the knee for this group of people. © 2006 Orthopaedic Research Society. Published by Wiley Periodicals, Inc. J Orthop Res 2007
Keywords: osteoarthritis, knee, osteotomy, correction, co-contraction
INTRODUCTION
Medial opening wedge (OW) high tibial osteotomy (HTO) is an established operative procedure to correct varus malalignment among patients with osteoarthritis (OA) of the medial compartment of the knee. Medial compartment OA is associated with genu varum, medial joint space narrowing, medial joint laxity, and quadriceps weakness, as well as sclerosis and attrition of subchondral bone.1 Sharma and colleagues2 have shown that varus deformity can hasten the progression of OA in the medial compartment of the knee.
The goal of HTO is to reduce excessive loading of the medial compartment of the knee by correcting the varus deformity, thereby reducing pain and improving function. The biomechanical basis for the optimal degree of correction has been disputed3,4 and the recommended postsurgical knee alignment varies widely.5,6
Results from previous studies have shown that people with medial knee OA use greater muscle co-contraction and longer duration of muscle activation during walking than controls.7–9 These individuals have also been shown to have a greater than normal knee adduction moment,10–12 and suggests that people are walking with increased joint loads on the medial compartment of the knee.10 The large adduction moment may, in part, be due to anatomical alterations in the varus aligned knee and to the pathophysiology of OA disease progression.10 Frontal plane laxity is found in individuals with knee OA8,9,13 and this has been shown to contribute significantly to the medial muscle co-contraction and adduction moment at the knee.8 Over time, the greater adduction moment coupled with high muscle co-contraction may have adverse effects on the knee joint due to increased compressive loads across the joint, possibly accelerating the progression of the disease,7,10,14 although this has yet to be supported by longitudinal research.
While studies on the outcome of HTO have generally shown positive effects with regard to knee function and cartilage regeneration,6,15,16 poor results have been linked to the knee frontal plane valgus angle after surgery being either too small or too great.5,15–18 When individual goal achievement has been used as an outcome criterion, improvement following HTO has not been so impressive.19 No studies have focused on the relationship between the absolute deviation from an optimal HTO correction with outcome measures which may be detrimental to the knee, such as adduction moment and muscle co-contraction, and the way these variables change as a result of surgery.
The aim of this study was to investigate the effect of the degree of frontal plane knee alignment following open wedge HTO surgery on variables that affect disease progression (muscle co-contraction and joint moments) and on self-reported physical function. We hypothesized that worse outcomes would be associated with over- or undercorrection.
METHODS
People diagnosed with genu varum and medial compartment knee OA and scheduled for an OW-HTO with a single orthopedic surgeon were recruited into the study. Sixteen patients, 10 male (52.2 ± 6.7 years, body mass index (BMI) 31.3 ± 5.0) and 6 female (49.3 ± 9.0 years, BMI 29.2 ± 4.3) who met the inclusion criteria were enrolled and agreed to participate in all data collection procedures. Testing was performed an average of 25 days prior to surgery and again 1 year after surgery. Patients were excluded if they were pregnant, had uncontrolled cardiovascular disease, neurological impairments, impaired balance or history of unexplained falls, rheumatoid arthritis, total knee replacement in either knee, any other orthopedic problems in the hips, ankles or spine, or a BMI of greater than or equal to 40.0 (morbid obesity). The protocol for the study was approved by the Institutional Review Board at the University of Delaware and all subjects gave informed consent. Kinematic, kinetic, and functional data were collected prior to and 1 year following surgery, as well as pre- and postoperative skeletal alignment, as measured from weight-bearing radiographs of the lower extremities. (Table 1)
Table 1.
Values for Mechanical Axes Angle (MAA) and Weight-Bearing Line (WBL) Ratio for Before Surgery (Pre-Op), the Point of Fixator Locking (Fixator), and One Year After Surgery (1 Year)
| Subject | Weight-Bearing Line Ratio
|
Mechanical Axis Angle
|
||||
|---|---|---|---|---|---|---|
| Pre-Op | Fixator | 1 Year | Pre-Op | Fixator | 1 Year | |
| 1 | 0.148 | 0.550 | 0.450 | 173 | 184 | 179 |
| 2 | 0.352 | 0.660 | 0.751 | 177 | 184 | 186 |
| 3 | 0.157 | 0.741 | 0.843 | 173 | 185 | 187 |
| 4 | 0.155 | 0.689 | 0.750 | 174 | 184 | 185 |
| 5 | 0.300 | 0.652 | 0.770 | 176 | 183 | 184 |
| 6 | 0.227 | * | 0.692 | 174 | * | 184 |
| 7 | 0.254 | 0.671 | 0.625 | 174 | 184 | 183 |
| 8 | 0.223 | 0.691 | 0.810 | 175 | 185 | 187 |
| 9 | 0.390 | 0.867 | 0.819 | 176 | 189 | 189 |
| 10 | 0.034 | 0.727 | 0.850 | 170 | 185 | 189 |
| 11 | 0.016 | 0.670 | 0.808 | 168 | 183 | 186 |
| 12 | 0.286 | 0.719 | 0.749 | 176 | 186 | 186 |
| 13 | 0.344 | 0.713 | 0.694 | 178 | 187 | 184 |
| 14 | 0.058 | 0.633 | 0.720 | 172 | 184 | 185 |
| 15 | 0.133 | 0.603 | 0.691 | 173 | 183 | 185 |
| 16 | 0.046 | 0.763 | 0.729 | 170 | 186 | 185 |
| Mean | 0.195 | 0.690 | 0.734 | 173.7 | 184.8 | 185.3 |
| Standard deviation | 0.120 | 0.073 | 0.098 | 2.7 | 1.7 | 2.4 |
| Minimum | 0.016 | 0.550 | 0.450 | 168 | 183 | 179 |
| Maximum | 0.390 | 0.867 | 0.850 | 178 | 189 | 189 |
Radiographs not available.
Surgery
All subjects underwent OW-HTO performed by a single, experienced orthopedic surgeon (WMN) a mean of 25 days (range, 2–62 days) after preoperative testing. The osteotomy was carried out at the level of the most proximal portion of the pes anserine, which is at the lower quarter of the tibial tuberosity, and monitored via radiography. If the preoperative weight-bearing line (WBL) ratio was 15% or less, a fibular osteotomy was required. After a 10-day latency period, an articulated external fixator was used to gradually open the wedge by approximately 1 mm per day at the medial tibial cortex. The surgeon monitored the patients’ progress and determined with full-length, weight-bearing radiographs when the desired degree of correction had been achieved. The external fixator was then locked in until the traction callus was mature. The surgeon aimed for the WBL ratio falling within a window of 66% and 70%, and the mean ratio at the time of locking the fixator was 69% ± 0.07% (Table 1). Patients were non–weight-bearing on crutches for 4 weeks and subsequently began slow progression from partial to full weight bearing over the ensuing 4 weeks. Most patients had no formal physical therapy.
Skeletal Alignment
Varus and valgus angulations of the knee were measured using the angle between the femoral and tibial mechanical axes20 and also by calculating a WBL ratio,21 using standing long cassette radiographs of the lower extremities (Fig. 1). The mechanical axis of the femur was defined as the line connecting the hip and the knee joint centers. The mechanical axis of the tibia was defined as the line connecting the knee and the ankle joint centers. Knee alignment was derived by measuring the angle of intersection between these two axes, where 180º equated to a straight line, angles greater than 180º indicated a valgus knee position, and angles less than 180º indicated varus alignment. The WBL ratio was found by drawing a line from the center of the femoral head to the center of the ankle mortise. The horizontal distance from the WBL to the medial edge of the tibial plateau was then divided by the width of the tibial plateau. Thus, a WBL ratio of less than 0.5 indicated varus angulation with the load shifted medially, whereas a value of greater than 0.5 denoted valgus angulation with the load shifted towards the lateral compartment.
Figure 1.

The weight-bearing line (WBL) runs from the femoral head to the ankle (A) and with no angulation, it runs through the center of the knee with a ratio of 50%. Varus alignment gives a smaller ratio found by dividing the horizontal distance from the WBL to the medial border of the tibial plateau (B) by its total width. The mechanical axes of the femur and the tibia intersect at the center of the knee (C) and in the case of varus alignment will create an angle of less than 180º.
Motion Analysis
The methods used for motion recording and analysis are fully described elsewhere.8 In brief, subjects underwent three-dimensional (3D) lower extremity gait analysis. Kinematic data were collected at 120 Hz using a six-camera optoelectric motion analysis system (VICON, Oxford Metrics, London, England) and kinetic data were collected at 1800 Hz with a Bertec (Worthington, OH) force platform. Marker trajectories and ground reaction force data were low-pass filtered (Butterworth fourth order, phase lag) at 6 and 40 Hz, respectively. Data were analyzed using Visual 3D software (C-Motion, Inc, Rockville, MD). Lower limb kinematics were calculated using rigid body analysis and Euler angles and joint moments were derived using inverse dynamics and normalized to body mass and height.
Muscle activity was recorded simultaneously at 1800 Hz using active surface electrodes (Motion Lab Systems, Baton Rouge, LA) placed over the medial and lateral hamstrings (MH and LH), the medial and lateral vasti (VM and VL), and the medial and lateral gastrocnemius (MG and LG). Maximal voluntary isometric contractions (MVIC) were recorded for each muscle for normalization.
Subjects walked along a 10-m walkway at self-selected pace until consistent velocity was achieved, determined from two photoelectric cells. Walking trials were collected whereby subjects contacted the force platform with their involved limb without targeting. Velocity was maintained to within 5%.
The raw electromyographic (EMG) data were full wave rectified and low pass filtered with a phase corrected eight order, 20 Hz low pass Butterworth filter, creating a linear envelope for each muscle. Linear envelopes were normalized to each subject’s peak EMG recorded during a MVIC. Antagonistic muscles were grouped accordingly: quadriceps–hamstrings (VLLH and VMMH for lateral and medial co-contraction, respectively) and quadriceps–gastrocnemius (VLLG and VMMG for lateral and medial co-contraction, respectively). Co-contraction indices were calculated as follows22:
| (1) |
Muscle response was analyzed from 100 ms prior to initial contact (to account for electromechanical delay) to when the first peak knee adduction moment occurred. This time interval was normalized to 100 data points and the resulting values at each data point averaged to arrive at a single unitless value representing the magnitude of co-contraction between the two muscles.
Pain and Functional Status Measurement
Pain and functional status were assessed using the self-reported Knee Outcome Survey-Activities of Daily Living Scale (KOS-ADLS).23
Statistics
Any postoperative deviation from the mean of the desired corrections, whether positive or negative, was reported as an absolute number of degrees and used for further statistical analysis.
Paired t-tests were used to determine differences between testing sessions. Pearson product-moment correlation coefficients and linear regression analysis were used to determine the associations between deviations from desired (5º) valgus knee angle postoperatively and the degree of muscle activation, joint moments, and KOS-ADLS measures, as well as the way in which these variables changed from pre- to postsurgery. Significance was set at α = 0.05.
RESULTS
Skeletal Alignment
At 1 year after surgery, the mechanical axis angle was on average 185º (valgus), whereas preopera-tively the angle was an average of 174º (varus) (Table 1). The WBL ratio at 1 year was a mean of 73.4% of the width of the tibial plateau from medial to lateral, and significantly different from the prior medially situated mean of 19.4% (p < 0.001) (Table 1). As expected, there was a strong positive relationship between the tibiofemoral mechanical axes angle (MAA) and the WBL ratio preoperatively (r2 = 0.88, p < 0.001) and at 12 months postoperatively (r2 = 0.90, p < 0.001).
Pain and Functional Status Measurement
After 1 year, physical function had improved significantly overall, as determined by the KOS-ADLS score (preoperative 53.3 vs. postoperative 79.8, p < 0.001). However, regression analysis revealed a trend towards a negative relationship between the amount of postsurgical improvement in the KOS-ADLS score and the amount of deviation from the desired postoperative MAA (r2 = 0.215, p = 0.07), regardless of whether that deviation was due to under- or overcorrection (Fig. 2).
Figure 2.

Relationship between postsurgical change in the KOS-ADLS score and degrees from the mean postoperative angle between femoral and tibial mechanical axes.
Motion Analysis
Analysis of the subjects’ muscle activity during gait showed a strong positive relationship between the degree of deviation from the desired MAA and the amount of co-contraction of the VMMH (r2 = 0.654, p < 0.001) and the VLLG (r2 = 0.394, p = 0.009) muscle groups at 1 year. There was also a significant positive relationship between the degree of deviation from the desired MAA and knee adduction moment at initial contact (AMic) (r2 = 0.44, p = 0.048).
A positive correlation was seen between the degree of deviation from the desired MAA and the changes seen in VMMH co-contraction during the period from baseline to 1 year (r2 = 0.512, p = 0.002). Those close to the desired MAA showed a tendency towards decreased co-contractions, while those further away from the group mean were more likely to show increased co-contraction at 1 year (Fig. 3).
Figure 3.

Relationship between the change in VMMH co-contraction index from baseline to 1 year, and the degrees from the mean postoperative angle between femoral and tibial mechanical axes.
Regression analysis revealed a positive relationship between the amount of VMMH co-contraction and AMic at 12 months postoperatively (r2 = 0.431, p = 0.006). A positive relationship was also seen between the changes in VMMH co-contraction from baseline to 1 year and the changes in AMic (r2 = 0.443, p = 0.005) as well as VLLG co-contraction (r2 = 0.311, p = 0.031) in the same time period. This indicates that, on average, the subjects that showed a decrease in VMMH co-contractions also tended to show a decrease in the AMic and in the VLLG co-contraction index and vice versa (Figs. 4 and 5).
Figure 4.
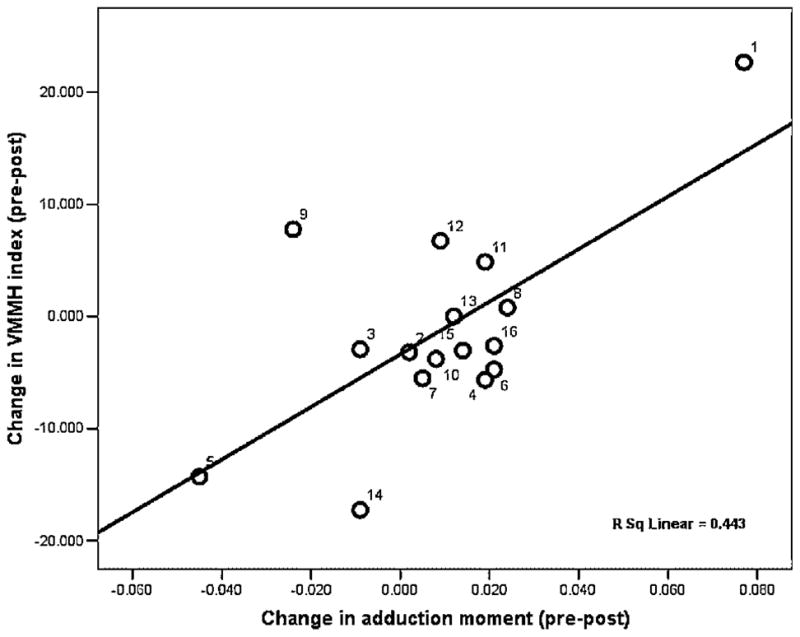
Relationship between the change in VMMH co-contraction index and the change in adduction moment at initial contact from baseline to 1 year.
Figure 5.
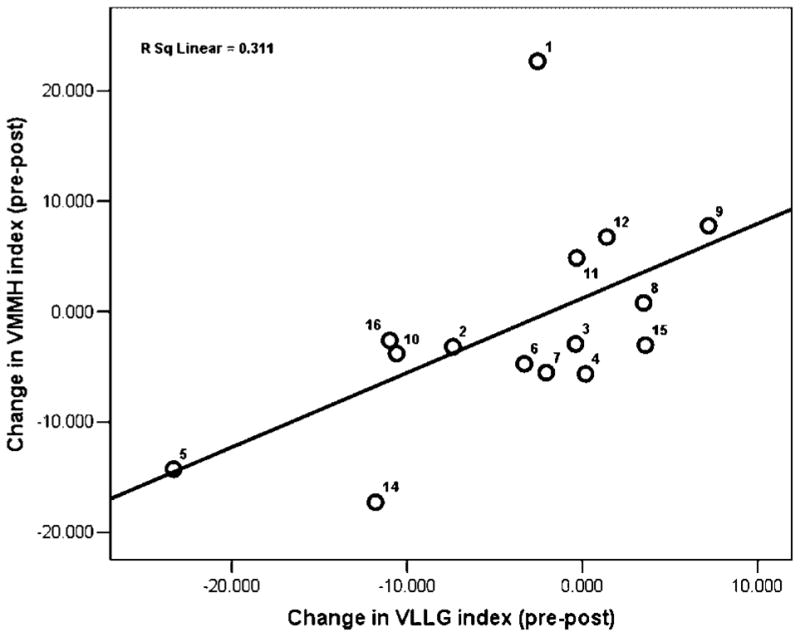
Relationship between the change in VMMH co-contraction index and the changes in VLLG co-contraction index from baseline to 1 year.
DISCUSSION
Our hypotheses that worse outcome would be associated with either inadequate or excessive correction of varus deformity in patients with medial OA were generally supported by the data. Variables that may negatively affect disease progression (muscle co-contraction and joint moments) were significantly higher in patients with worse, postsurgical, knee alignment 1 year after HTO. The change in VMMH co-contraction after surgery differed depending on the degree of frontal plane alignment. These changes, in turn, were positively correlated with pre- to postoperative changes in the AMic and VLLG co-contraction indices. Although the higher, mean KOS-ADLS score at 1 year postsurgery demonstrated that the group as a whole did better, the changes seen in pre- to postoperative scores differed in a way that suggests that both limited and excessive correction may not afford the same improvements in pain and function after HTO as the optimal degree of correction does.
Among the factors that have been suggested to affect poor results following HTO surgery are previous arthroscopic debridement, obesity, lateral knee OA, and an age greater than 55 years.24 Frequently, a poor surgical outcome has been correlated with an insufficient valgus correction.17,18,24 Possible causes for not reaching the desired angle include an insufficient osteotomy (undercorrection), a gradual loss of limb alignment resulting from improper internal fixation or osteoporosis, and recurrence of degeneration leading to further varus angulation as a result of insufficient initial valgus correction.15,25 Furthermore, better clinical results and a lower recurrence of varus deformity have been linked to low preoperative adduction moments.11
Undercorrection may fail to sufficiently alter the joint laxity that is found in patients with medial knee OA. In knees that have joint laxity, altered muscle activity is a compensatory mechanism that reflects attempts to stabilize the knee and/or avoid pain, but ultimately leads to greater joint reaction forces.7,26 Thus, if joint laxity remains in the undercorrected joint, greater levels of muscle activity and co-contraction may continue to excessively load the medial compartment and even lead to later recurrence of varus deformity.
One concern with overcorrection into valgus is that of cosmetic deformity3,18,27 and overloading the lateral compartment.18 Cadaver studies have shown that in order to effectively unload the medial compartment during gait, a much greater correction is needed than is usually done.3,4 Thus, successful outcome is not solely based on alignment, but includes other factors intrinsically involved in the way the joint is dynamically loaded.
Our data support the suggestion that accuracy of correction is integral in improving function of the knee following opening wedge HTO. The recommendations for the optimal degree of surgical correction range from alignments of 183º to 190º17,18,27,28 and a WBL ratio from 62% to 72%.6,21,29–31 Our decision to use the mean of the targeted correction as the optimal angle for comparison falls well within these suggestions, while taking into consideration outcome measures and cosmetic appearance.17,27 At 1 year after surgery, the mean mechanical axis angle in the sample was 185º (valgus) and the mean WBL ratio was 73.4%. The strong correlation between the WBL and MAA indicates that both measures reflect the frontal plane joint position in the same way. The discrepancy between the mean WBL at the time of locking the external fixator and the postoperative measurement at 1 year is likely explained by the physical condition of the patient at the time of correction. When long cassette radiographs are taken during the callus distraction, the patient is most often unable to fully extend the knee secondary to the discomfort involved. Furthermore, whether the patient is truly placing equal weight on both lower extremities is not monitored. When the knee is not fully extended an altered tibial rotation is seen, both of which will affect the measurement directly.5 The long cassette radiographs at 12 months, however, reflect the true corrected WBL when the patient has reached full postsurgical recovery. To our knowledge, this has not been previously reported in the literature but should be addressed and specifications made as to when reported measurements are taken.
The relationship between the changes in VMMH co-contraction from baseline to 1 year and the changes in AMic in the same time period underscore how those variables changed in similar ways depending on how far removed from our optimal alignment people were at 1 year. The mechanisms by which these changes occur remain unclear. Intuitively, one would expect the adduction moment to decrease as the alignment of the knee changed from varus to valgus, and this was indeed more often the case for the subjects whose correction angle was closer to optimal. Anatomical knee alignment after surgery had significantly shifted the WBL away from the medial compartment, which should aid in decreasing the adduction moment. Thus, the observed increase in adduction moment was likely due to increased medial muscle activation.
Subjects whose knees are undercorrected may still demonstrate medial laxity and concurrent medial co-contraction as the muscles continue their attempt to stabilize the joint, at which the super-ficial fibers of the medial collateral ligament (MCL) have also been released as part of the HTO procedure.32 Those who are overcorrected are unlikely to have joint laxity, as a larger wedge will re-tension the remaining, intact, MCL fibers.32 Thus, these patients may have the opposite problem in that the medial joint structures are stressed with every step taken. The extreme anatomical angulation of the overcorrected knee may cause a valgus load at the knee joint. Buchanan and colleagues33 have shown that medial muscles (vastus medialis, sartorius, gracilis, semitendinosus) can be reflexively activated, independent of their role as knee extensors or flexors, to provide stability during valgus loads. The response was thought to arise primarily from joint mechanoreceptors, possibly with stretch reflex involvement. Moreover, Kim and colleagues34 demonstrated that current-modulated electrical stimulation of the MCL of the knee activated the medial muscles; most consistently vastus medialis. They suggested that a neurosensory reflex from ligament mechanoreceptors selectively activated muscles to counter the valgus loads at the knee.34
Our results show that those patients further removed from the optimal alignment had signifi-cantly higher medial and lateral co-contractions and adduction moments 1 year after surgery than those who were at our optimal postsurgical alignment, and were more likely to show a change towards an increase versus decrease in medial muscle co-contraction following surgery, when compared to presurgical values. This was reflected by less improvement in their KOS-ADLS scores and may certainly contribute to continued degeneration of the knee at a faster rate for this group of people, than that which subjects with optimal, postsurgical alignment, experience.
The results of this study should be considered in light of the relatively small number of patients included in the study. However, the results showed strong statistically significant differences in the data, which suggests that the results will be valid in a larger population of patients with medial compartment OA, who undergo open wedged HTO. Other aspects of the surgical procedure may influence outcome, such as changes in tibial slope, which is the inclination angle of the tibial plateau in the sagittal plane.6,25,30 This variable was not investigated in this study, nor was the longer term effects of under- and overcorrection.
The goal of medial OW-HTO is to unload the medial aspect of the knee joint, in order to improve function and decrease pain in patients with medial compartment OA. Our data suggest the further the correction is from 185º degrees, as measured 1 year postoperatively, the higher the likelihood of high postsurgical values of muscle co-contraction indices and knee adduction moments. These variables are associated with poor quality dynamic loading and high compressive loads in the knee, and may contribute to poorer postsurgical outcomes. Moreover, rather than unloading the joint, under- or overcorrection may ultimately lead to an accelerated rate of progression of arthritic changes in the knee.
Acknowledgments
The authors thank Laurie Andrews, RTR, for her assistance with the radiographs. Funding was provided by the National Institutes of Health (1P20RR016458, R01HD037985, R01AR048212). No benefits have been received or will be received from a commercial party related directly or indirectly to the subject of this article.
References
- 1.Sharma L, Hayes KW, Felson DT, et al. Does laxity alter the relationship between strength and physical function in knee osteoarthritis? Arthritis Rheum. 1999;42:25–32. doi: 10.1002/1529-0131(199901)42:1<25::AID-ANR3>3.0.CO;2-G. [DOI] [PubMed] [Google Scholar]
- 2.Sharma L, Song J, Felson DT, et al. The role of knee alignment in disease progression and functional decline in knee osteoarthritis. JAMA. 2001;286:188–195. doi: 10.1001/jama.286.2.188. [DOI] [PubMed] [Google Scholar]
- 3.Shaw JA, Moulton MJ. High tibial osteotomy: an operation based on a spurious mechanical concept. A theoretic treatise. Am J Orthop. 1996;25:429–436. [PubMed] [Google Scholar]
- 4.Shaw JA, Dungy DS, Arsht SS. Recurrent varus angulation after high tibial osteotomy: an anatomic analysis. Clin Orthop. 2004;420:205–212. doi: 10.1097/00003086-200403000-00029. [DOI] [PubMed] [Google Scholar]
- 5.Kawakami H, Sugano N, Yonenobu K, et al. Effects of rotation on measurement of lower limb alignment for knee osteotomy. J Orthop Res. 22:1248–1253. doi: 10.1016/j.orthres.2004.03.016. [DOI] [PubMed] [Google Scholar]
- 6.Naudie DD, Amendola A, Fowler PJ. Opening wedge high tibial osteotomy for symptomatic hyperextension-varus thrust. Am J Sports Med. 2004;32:60–70. doi: 10.1177/0363546503258907. [DOI] [PubMed] [Google Scholar]
- 7.Childs JD, Sparto PJ, Fitzgerald GK, et al. Alterations in lower extremity movement and muscle activation patterns in individuals with knee osteoarthritis. Clin Biomech (Bristol, Avon) 2004;19:44–49. doi: 10.1016/j.clinbiomech.2003.08.007. [DOI] [PubMed] [Google Scholar]
- 8.Lewek MD, Rudolph KS, Snyder-Mackler L. Control of frontal plane knee laxity during gait in patients with medial compartment knee osteoarthritis. Osteoarthritis Cartilage. 2004;12:745–751. doi: 10.1016/j.joca.2004.05.005. [DOI] [PMC free article] [PubMed] [Google Scholar]
- 9.Lewek MD, Ramsey DK, Snyder-Mackler L, et al. Knee stabilization in patients with medial compartment knee osteoarthritis. Arthritis Rheum. 2005;52:2845–2853. doi: 10.1002/art.21237. [DOI] [PMC free article] [PubMed] [Google Scholar]
- 10.Baliunas AJ, Hurwitz DE, Ryals AB, et al. Increased knee joint loads during walking are present in subjects with knee osteoarthritis. Osteoarthritis Cartilage. 10:573–579. doi: 10.1053/joca.2002.0797. [DOI] [PubMed] [Google Scholar]
- 11.Prodromos CC, Andriacchi TP, Galante JO. A relationship between gait and clinical changes following high tibial osteotomy. J Bone Joint Surg Am. 1985;67:1188–1194. [PubMed] [Google Scholar]
- 12.Sharma L, Hurwitz DE, Thonar EJ, et al. Knee adduction moment, serum hyaluronan level, and disease severity in medial tibiofemoral osteoarthritis. Arthritis Rheum. 41:1233–1240. doi: 10.1002/1529-0131(199807)41:7<1233::AID-ART14>3.0.CO;2-L. [DOI] [PubMed] [Google Scholar]
- 13.Sharma L, Lou C, Felson DT, et al. Laxity in healthy and osteoarthritic knees. Arthritis Rheum. 42:861–870. doi: 10.1002/1529-0131(199905)42:5<861::AID-ANR4>3.0.CO;2-N. [DOI] [PubMed] [Google Scholar]
- 14.Hodge WA, Fijan RS, Carlson KL, et al. Contact pressures in the human hip joint measured in vivo. Proc Natl Acad Sci U S A. 1986;83:2879–2883. doi: 10.1073/pnas.83.9.2879. [DOI] [PMC free article] [PubMed] [Google Scholar]
- 15.Koshino T, Yoshida T, Ara Y, et al. Fifteen to twenty-eight years’ follow-up results of high tibial valgus osteo-tomy for osteoarthritic knee. Knee. 2004;11:439–444. doi: 10.1016/j.knee.2004.03.005. [DOI] [PubMed] [Google Scholar]
- 16.Koshino T, Wada S, Ara Y, et al. Regeneration of degenerated articular cartilage after high tibial valgus osteotomy for medial compartmental osteoarthritis of the knee. Knee. 2003;10:229–236. doi: 10.1016/s0968-0160(03)00005-x. [DOI] [PubMed] [Google Scholar]
- 17.Hernigou P, Medevielle D, Debeyre J, et al. Proximal tibial osteotomy for osteoarthritis with varus deformity. A ten to thirteen-year follow-up study. J Bone Joint Surg Am. 1987;69:332–354. [PubMed] [Google Scholar]
- 18.Coventry MB, Ilstrup DM, Wallrichs SL. Proximal tibial osteotomy. A critical long-term study of eighty-seven cases. J Bone Joint Surg Am. 1993;75:196–201. doi: 10.2106/00004623-199302000-00006. [DOI] [PubMed] [Google Scholar]
- 19.Oberg U, Oberg T. Functional outcome after high tibial osteotomy: a study using individual goal achievement as the primary outcome variable. J Rehabil Res Dev. 2000;37:501–510. [PubMed] [Google Scholar]
- 20.Specogna AV, Birmingham TB, DaSilva JJ, et al. Reliability of lower limb frontal plane alignment measurements using plain radiographs and digitized images. J Knee Surg. 2004;17:203–210. doi: 10.1055/s-0030-1248222. [DOI] [PubMed] [Google Scholar]
- 21.Dugdale TW, Noyes FR, Styer D. Preoperative planning for high tibial osteotomy. The effect of lateral tibiofemoral separation and tibiofemoral length. Clin Orthop. 1992;274:248–264. [PubMed] [Google Scholar]
- 22.Rudolph KS, Axe MJ, Snyder-Mackler L. Dynamic stability after ACL injury: who can hop? Knee Surg Sports Traumatol Arthrosc. 2000;8:262–269. doi: 10.1007/s001670000130. [DOI] [PubMed] [Google Scholar]
- 23.Irrgang JJ, Snyder-Mackler L, Wainner RS, et al. Development of a patient-reported measure of function of the knee. J Bone Joint Surg Am. 1998;80:1132–1145. doi: 10.2106/00004623-199808000-00006. [DOI] [PubMed] [Google Scholar]
- 24.Pfahler M, Lutz C, Anetzberger H, et al. Long-term results of high tibial osteotomy for medial osteoarthritis of the knee. Acta Chir Belg. 2003;103:603–606. doi: 10.1080/00015458.2003.11679501. [DOI] [PubMed] [Google Scholar]
- 25.Marti CB, Gautier E, Wachtl SW, et al. Accuracy of frontal and sagittal plane correction in open-wedge high tibial osteotomy. Arthroscopy. 2004;20:366–372. doi: 10.1016/j.arthro.2004.01.024. [DOI] [PubMed] [Google Scholar]
- 26.Sharma L, Dunlop DD, Cahue S, et al. Quadriceps strength and osteoarthritis progression in malaligned and lax knees. Ann Intern Med. 2003;138:613–619. doi: 10.7326/0003-4819-138-8-200304150-00006. [DOI] [PubMed] [Google Scholar]
- 27.Hart JA, Sekel R. Osteotomy of the knee: is there a seat at the table? J Arthroplasty. 2002;17:45–49. doi: 10.1054/arth.2002.32686. [DOI] [PubMed] [Google Scholar]
- 28.Klinger HM, Lorenz F, Harer T. Open wedge tibial osteotomy by hemicallotasis for medial compartment osteoarthritis. Arch Orthop Trauma Surg. 2001;121:245–247. doi: 10.1007/s004020000216. [DOI] [PubMed] [Google Scholar]
- 29.Fujisawa Y, Masuhara K, Shiomi S. The effect of high tibial osteotomy on osteoarthritis of the knee. An arthroscopic study of 54 knee joints. Orthop Clin North Am. 1979;10:585–608. [PubMed] [Google Scholar]
- 30.Nakamura E, Mizuta H, Kudo S, et al. Open-wedge osteotomy of the proximal tibia hemicallotasis. J Bone Joint Surg Br. 2001;83:1111–1115. doi: 10.1302/0301-620x.83b8.11993. [DOI] [PubMed] [Google Scholar]
- 31.Amendola A. Unicompartmental osteoarthritis in the active patient: the role of high tibial osteotomy. Arthroscopy. 2003;19(Suppl 1):109–116. doi: 10.1016/j.arthro.2003.09.048. [DOI] [PubMed] [Google Scholar]
- 32.Pape D, Duchow J, Rupp S, et al. Partial release of the superficial medial collateral ligament for open-wedge high tibial osteotomy A human cadaver study evaluating medial joint opening by stress radiography. Knee Surg Sports Traumatol Arthrosc. 2006;14:141–148. doi: 10.1007/s00167-005-0649-2. [DOI] [PubMed] [Google Scholar]
- 33.Buchanan TS, Kim AW, Lloyd DG. Selective muscle activation following rapid varus/valgus perturbations at the knee. Med Sci Sports Exerc. 1996;28:870–876. doi: 10.1097/00005768-199607000-00014. [DOI] [PubMed] [Google Scholar]
- 34.Kim AW, Rosen AM, Brander VA, et al. Selective muscle activation following electrical stimulation of the collateral ligaments of the human knee joint. Arch Phys Med Rehabil. 1995;76:750–757. doi: 10.1016/s0003-9993(95)80530-3. [DOI] [PubMed] [Google Scholar]