Abstract
Human duodenal cytochrome b (Dcytb) is a transmembrane hemoprotein found in the duodenal brush border membrane and in erythrocytes. Dcytb has been linked to uptake of dietary iron and to ascorbate recycling in erythrocytes. Detailed biophysical and biochemical characterization of Dcytb has been limited by difficulties in expressing sufficient amounts of functional recombinant protein in yeast and insect cell systems. We have developed an E. coli Rosetta-gami B(DE3) cell system for production of recombinant His-tagged human Dcytb with a yield of ~26 mg of purified, ascorbate-reducible cytochrome per liter of culture. The recombinant protein is readily solubilized with n-dodecyl-β-D-maltoside and purified to electrophoretic homogeneity by one-step chromatography on cobalt affinity resin. The purified recombinant Dcytb has a heme to protein ratio very close to the theoretical value of two and retains functional reactivity with ascorbate, as assessed by spectroscopic and kinetic measurements. Ascorbate showed a marked kinetic selectivity for the high-potential heme center over the low-potential heme center in purified Dcytb. This new E. coli expression system for Dcytb offers ~7-fold improvement in yield and other substantial advantages over existing expression systems for reliable production of functional Dcytb at levels suitable for biochemical, biophysical and structural characterization.
Keywords: Duodenal cytochrome b, ascorbate-dependent cytochrome b561, transmembrane hemoprotein, Escherichia coli Rosetta-gami B(DE3) expression system
Introduction
The discovery of duodenal cytochrome b (Dcytb or Cybrd1) in 2001 by McKie and colleagues [1] as a ferrireductase in duodenal mucosal cells paved the way for a number of studies that implicate the protein in ascorbate-dependent transmembrane electron transfer [2–6]. Dcytb belongs to the cytochrome (cyt) b561 family, which has members in all eukaryotic kingdoms [7]. These proteins constitute a growing family of di-heme b-containing transmembrane redox proteins that are homologous to the family prototype–adrenal cyt b561 [7]. Although basic structural and functional information is lacking for most cyt b561 family proteins, they share the defining structure motifs: six putative transmembrane domains and four histidine residues capable of coordinating two heme groups for electron transport [7–10].
Several cyt b561 family members have physiological and/or pathological significance in humans, including adrenal cyt b561 [11], Dcytb [1,2]; the 101F6 gene product [12], and stromal cell-derived receptor 2 (SDR2) [13]. With the exception of adrenal cyt b561, the endogenous levels of cyt b561 family members studied so far are low. Purification of endogenous Dcytb has not been reported, presumably due to difficulties related to purification of a low-abundance, integral membrane protein, and structure-function studies of Dcytb have been hampered by the lack of a high-yield system for production of the recombinant protein in functional form. Oakhill et al. [4] reported unsuccessful attempts to express Dcytb in amounts suitable for protein characterization using a yeast (Saccharomyces cerevisiae) system. This situation was improved somewhat with a baculovirus-mediated expression system, which yielded 3–4 mg of protein per liter of cell culture [4]. However, bacterial expression systems offer considerable advantages over eukaryotic systems in terms of the fast growth rate, inexpensive media and well understood genetics, and we sought to develop such a system for Dcytb expression. Ludwiczek et al. [14] recently reported a bacterial system for Dcytb expression, but the recombinant protein was in inclusion bodies and could not be refolded to a form that was reducible by ascorbate, indicating complete loss of functionality.
In this study, we found that optimizing the bacterial strain, growth conditions, and the cDNA codon usage resulted in high yields of recombinant Dcytb that could be solubilized with mild non-ionic detergent and purified to homogeneity in an ascorbate-reducible form. This development of a versatile and economical expression system for production of considerable amounts of functional recombinant Dcytb should greatly facilitate biochemical, biophysical and structural characterization of this important cytochrome.
Experimental Procedures
Materials
Hemin, sodium ascorbate, ascorbic acid, δ-aminolevulinic acid, isopropyl-1-thio-β-D-galactopyranoside, egg lysozyme, and antibiotics were from Sigma (St. Louis, MO). n-Dodecyl-β-D-maltoside was from Anatrace (Maumee, OH). Restriction enzymes were from New England Bio-Labs (Beverly, MA). Reagents for DNA extraction and purification were from Qiagen (Valencia, CA). Chromatographic columns, immunoblotting reagents and DC protein assay kit were from Bio-Rad (Hercules, CA). E. coli strain Rosetta-gami B(DE3), pET43.1a plasmid, Benzonase nuclease, protease inhibitor cocktail (without EDTA), and anti-HisTag monoclonal antibody were from Novagen (Madison, WI). TALON cobalt affinity resin was from BD Biosciences Clontech (Palo Alto, CA). Centriprep and Centricon concentrators were from Millipore (Billerica, MA). Custom gene synthesis was performed at Epoch Life Science (Houston, TX). DNA sequencing was performed at the Microbiology and Molecular Genetics Core Facility, UTHealth at Houston.
Construction of expression vector for His-tagged Dcytb
The CYBRD1 cDNA sequence (GenBank Accession No. NM_024843.3) was first optimized for E. coli codon usage, replacing several rare codons in CYBRD1 with high-frequency synonymous codons to form a synthetic gene encoding Dcytb. This optimized cDNA, together with six histidine codons inserted upstream of the stop codon (resulting in recombinant Dcytb with a C-terminal His-tag), was synthesized and cloned into pBSK vector (Epoch BioLabs, Houston). The Dcytb cDNA was released by digesting with NdeI and XhoI and subcloned into pET43.1a (pre-digested by NdeI and XhoI). The integrity of the resulting plasmid, designated pET43.1a-DcytbC6H, was confirmed by restriction digestion and DNA sequencing.
Expression of His-tagged recombinant Dcytb in E. coli
The E. coli Rosetta-gami B(DE3) strain (Genotype: F− ompT hsdSB[rB− mB−] gal dcm lacY1 ahpC [DE3] gor522::Tn10 trxB pRARE [CamR, KanR, TetR]) was transformed with the pET43.1a-DcytbC6H expression plasmid and grown overnight in Terrific Broth medium containing chloramphenicol (45 μg/mL), kanamycin (15 μg/mL), tetracycline (15 μg/mL) and ampicillin (150 μg/mL) at 37 °C. The overnight culture (20 mL) was used to inoculate 1 L of Terrifc Broth containing ampicillin (150 μg/mL) and incubated with shaking (200 rpm) at 37 °C until the A610 reached 0.8. After chilling to 20 °C, heme (2 μM final, from a filter-sterilized 5 mM stock in dimethysulfoxide), δ-aminolevulinic acid (0.2 mM), and isopropyl-1-thio-β-D-galactopyranoside (IPTG, 1 mM) were added, and culture was continued for 48 h at 20 °C with shaking at 200 rpm. Cells were harvested by centrifugation and stored at −76 °C.
Purification of His-tagged recombinant Dcytb
Cells from 2 liters of culture were resuspended in 250 mL of 0.1 M potassium phosphate (KPi), pH 7.5, containing 5% (v/v) glycerol. Egg lysozyme (0.15 g in 5 mL of buffer) was added and the suspension stirred at 4 °C for 1 h and then sonicated (6 min total; 10 s intervals, 50% duty cycle), then centrifuged at 100,000g at 4 °C for 1 h. The pellet containing the membrane fraction was resuspended with 150 mL of 0.1 M KPi, pH 7.5, containing 5% (v/v) glycerol and 2% (w/v) n-dodecyl-β-D-maltoside (DM) and stirred on ice for 1 h. Benzonase nuclease (5 μL), MgCl2 (5 mM) and protease inhibitor were added, and stirring continued at 4°C overnight. Unextracted material was pelleted by centrifugation at 100,000g at 4 °C for 1 h and the pH of the crude detergent extract was adjusted to 7.5. The amount of recombinant Dcytb in the crude extract was estimated from the reduced minus oxidized difference spectrum (see below). A 1-mL portion of TALON resin suspension was prepared for each 3 mg of recombinant Dcytb. The affinity resin was packed in a glass column (2.8×20 cm) and washed with 10 vol of deionized water and 10 vol of 0.1 M KPi, 0.25 M NaCl, 10% glycerol, 0.08% DM, pH 7.5. The crude detergent extract containing recombinant Dcytb was then added to the column, and the mixture agitated gently for 2 h at 4 °C on a rotating mixer. The liquid was then drained from the column and the resin washed twice by capping the ends and agitating with 10 vol of 0.1 M KPi, 0.25 M NaCl, 10% glycerol, 0.08% DM, pH 7.5 for 15 min. Then, two similar wash steps were performed with 10 vol of 0.1 M KPi, 0.25 M NaCl, 20% glycerol, 0.08% DM, 5 mM imidazole, pH 7.5. The His-tagged Dcytb was eluted with 5 vol of 0.1 M KPi, 0.25 M NaCl, 5% glycerol, 0.08% DM, 250 mM imidazole, pH 7.5, and collected in 3 mL fractions. Fractions containing purified recombinant Dcytb (based on the A414/A280 ratio) were pooled and concentrated with a 30 kDa cutoff Centricon device. The concentrated Dcytb was oxidized with 5 μM potassium ferricyanide and then chromatographed on a 10-DG column pre-equilibrated with 0.1 M KPi, pH 7.2, containing 18% glycerol and 0.08% DM to remove imidazole and ferricyanide, and stored at −76 °C.
Assay of protein and heme content
Total protein was assayed with Bio-Rad DC protein assay kit using bovine serum albumin as the standard. Dcytb content was calculated using a reduced (dithionite-treated) minus oxidized (ferricyanide-treated) difference absorbance coefficient (560–575 nm) of 21.5 (mM heme)−1 cm−1 (see Table 3, below). Heme content was determined by the pyridine hemochrome method [15] using an absorbance coefficient difference (556–538 nm) of 24.5 mM−1 cm−1 [16]. The homogeneity of purified Dcytb was determined by densitometry (ImageJ software from NIH) of Coomassie blue-stained bands after separation of proteins by polyacrylamide gel electrophoresis (see below). The heme/Dcytb monomer stoichiometry was calculated by dividing the heme concentration (determined by pyridine hemochrome assay) by the monomer concentration (determined by total protein assay and electrophoretic analysis).
Table 3.
Kinetic parameters for reactions of ferric and partially reduced Dcytb with ascorbatea
| Data set | Asc (mM) | ΔA1/heme (mM heme−1) | k1 (s−1) | ΔA2/heme (mM heme−1) | k2 (s−1) | ΔA3/heme (mM heme−1) | k3 (s−1) |
|---|---|---|---|---|---|---|---|
| Oxidized Dcytb | 1.0 | 26.9 | 68.7 | 15.8 | 1.29 | 15.1 | 0.13 |
| 2.0 | 33.1 | 101 | 16.5 | 1.81 | 12.8 | 0.18 | |
| 4.0 | 39.4 | 137 | 13.5 | 2.95 | 12.7 | 0.29 | |
| 8.0 | 45.6 | 181 | 12.5 | 3.85 | 10.4 | 0.40 | |
|
| |||||||
| Partially Reduced Dcytb | 1.0 | 10.1 | 72.6 | 6.7 | 1.52 | 15.4 | 0.15 |
| 2.0 | 14.7 | 76.1 | 10.4 | 1.09 | 10.4 | 0.15 | |
| 4.0 | 19.9 | 109 | 9.6 | 1.94 | 10.2 | 0.24 | |
| 8.0 | 24.9 | 149 | 8.5 | 3.66 | 9.8 | 0.39 | |
|
| |||||||
| (Oxidized) – (Partially reduced) | 1.0 | 16.6 | 69.1 | 8.1 | 1.47 | 0.8 | 0.07 |
| 2.0 | 18.5 | 110 | 7.4 | 2.18 | 0.5 | 0.04 | |
| 4.0 | 19.2 | 147 | 5.3 | 2.55 | 0.3 | 0.09 | |
| 8.0 | 20.2 | 234 | 4.7 | 3.50 | 0.1 | 0.10 | |
Electrophoretic and immunoblot analyses
Protein samples were prepared by mixing with electrophoresis sample buffer [Ref 16] containing 4.3% SDS and 250 mM dithiothreitol and incubation for 1 h at 37 °C. Protein mixtures were separated by electrophoresis under denaturing conditions [17] using 12% polyacrylamide gels, with the protein bands either visualized by Coomassie blue staining or electrophoretically transferred onto polyvinylidene difluoride membranes for immunoblotting. The membranes were probed with an anti-HisTag monoclonal antibody (Novagen) at a dilution of 1:2,000 and immunoreactive bands were visualized with horseradish peroxidase-conjugated secondary antibody and 4-chloro-1-naphthol and followed the manufacturer’s protocol.
Electronic absorption spectroscopy
Absorbance spectra were recorded at room temperature in 0.1 M KPi, pH 7.2, containing 0.08% DM and 18% glycerol in 1-cm pathlength quartz cuvettes in a Shimadzu Model 2101PC spectrophotometer, using a scan rate of 20 nm/min, 20 data points/nm, and a spectral band width of 0.5 nm.
Ascorbate titrations of purified recombinant Dcytb
The basic procedure has been described [18]. Pre-oxidized Dcytb (~10 μM heme) in 0.1 M KPi (pH 7.2) containing 18% glycerol and 0.08% DM was placed in a 1-cm quartz cuvette and titrated with 22 increments of ascorbate between 0.3 μM and 75 mM. The system was allowed to equilibrate completely (5 min) after each addition of ascorbate before the spectrum was recorded. Ascorbate stock solutions were prepared at pH 7.2 using an appropriate ratio of ascorbic acid and sodium ascorbate. The stocks were freshly made before use and kept on ice and protected from light. The observed increases in A560 during the titrations were corrected for dilution and fitted by nonlinear regression to a three-phase, six-parameter equation:
| (Eq. 1) |
Here, [Asc] is the ascorbate concentration, ΔA(bH) and ΔA(bL) are overall absorbance changes for the high- and low-potential heme transitions, respectively, and CH and CL are midpoint ascorbate concentrations for the high- and low-potential heme center transitions, respectively. The additional parameters, ΔA(bVL) and CVL, are the overall absorbance change and midpoint ascorbate concentration, respectively, for the very low-potential heme center which was reduced only at very high ascorbate levels.
Electron paramagnetic resonance (EPR) spectroscopy
Purified recombinant Dcytb was concentrated and pre-oxidized as described above before transfer to a quartz EPR tube and freezing in a dry ice/acetone bath. EPR spectra were recorded with a Bruker EMX EPR spectrometer. The liquid helium system included an Oxford GFS 600 transfer line, an ITC 503 temperature controller, and an ESR 900 cryostat. The spectrometer conditions were: frequency, 9.60 GHz; field modulation, 100 kHz; modulation amplitude, 10.9 G; power, 4.0 mW; and temperature, 8.1 K.
Stopped-flow measurements
Rapid kinetic measurements were performed at 23 °C using an Applied Photophysics (Leatherhead, U.K.) SX18MV stopped-flow instrument and the accompanied software. One syringe contained oxidized Dcytb (2.0 μM) in 0.1 M KPi, pH 7.2, containing 0.08% DM and 18% glycerol; the other syringe contained the desired level of ascorbate dissolved in the same buffer. The mixing ratio was 1:1, and Dcytb reduction was followed spectrophotometrically at 426 nm. Data points were collected at 2.5 ms intervals up to 5 s and every 25 ms from 5 s to 55 s. Data were fitted to a three-exponential model (Eq. 2, below) using KaleidaGraph (Synergy Software, Reading, PA) to estimate the amplitudes (ΔA1, ΔA2, and ΔA3) and apparent first order rate constants (k1, k2, and k3) for each of the three phases.
| (Eq. 2) |
The fitting was done in steps, with the fastest phase (only data points up to 40–75 ms) fitted first. The resulting parameters (A0, ΔA1, and k1) were then fixed and the fitting process repeated to estimate the parameters for the slower phases.
Results and Discussion
Optimization of bacterial system for expression of recombinant Dcytb
Initial trials to express human Dcytb in the E. coli BL21Star(DE3)/pT-groE strain, which worked well for adrenal cyt b561 [19], were unsuccessful. So we switched to the E. coli Rosetta-gami B(DE3) strain, a strain designed to address problems with codon bias, disulfide bond formation and target plasmid stability. Using this strain, with low-temperature (20 °C) induction and supplementation with heme and δ-aminolevulinic acid, it was possible to produce more than 30 mg of crude recombinant Dcytb per liter of culture. n-Dodecyl-β-D-maltoside (DM) was found to be suitable for efficient extraction of the recombinant protein from the membrane fraction and for maintaining solubility during purification. Cobalt ion affinity chromatography of the extract resulted in electrophoretically with a typical yield of 26.4 mg of purified, ascorbate-reducible Dcytb per liter of bacterial culture (Table 1). It is important to note that this represents at least a sevenfold improvement in yield of purified Dcytb over the baculovirus-mediated expression system [4], a substantial improvement when producing cytochrome for biophysical and structural studies.
Table 1.
Purification of recombinant Dcytb expressed in E. coli cellsa
| Step | Protein (mg) | Cytochromeb (nmol) | Specific content (nmol/mg) | Yield (%) | Purification (fold) |
|---|---|---|---|---|---|
| Cell lysate | 5460 | 2160 | 0.40 | 100 | 1 |
| Detergent extract | 1520 | 2020 | 1.33 | 94 | 3.3 |
| Talon Affinity chromatography | 52.8 | 1590 | 30.2 | 74 | 76 |
Starting from 25 g of packed cells harvested from 2 L of culture.
Cytochrome content determined from reduced vs. oxidized difference spectrum as described in Experiemntal procedures.
The combination of extraction with mild detergent and affinity chromatography on cobalt ion affinity resin resulted in purified preparations of His-tagged recombinant Dcytb that was 97% homogeneous by electrophoretic analysis (Fig. 1), with a Mr value (an estimated molecular mass) of 32 kDa, the expected size of His-tagged Dcytb. Heating of purified recombinant Dcytb samples at temperatures above 37 °C in electrophoresis sample buffer decreased the intensity of the 32 kDa band and increased the intensity of Coomassie-stained (and immunoreactive) bands with Mr values two- four- and eight-fold larger (60, 125, and 250 kDa; data not shown), indicating that recombinant Dcytb has a tendency to oligomerize. Heating electrophoretic samples at 100 °C for 2–5 min led to complete aggregation, with none of the protein penetrating the gel. Similar tendencies to oligomerize upon heating in SDS-PAGE sample buffer have been reported for adrenal cyt b561 [19,20], lysosomal cyt b561 [9], tumor suppressor 101F6 [21], mouse Dcytb [2], and mitochondrial b cytochromes [22].
Fig. 1.
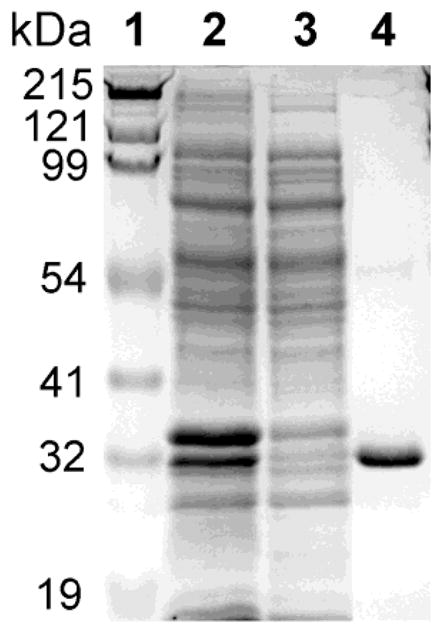
SDS-PAGE analysis of purified recombinant Dcytb expressed in E. coli. Lane 1, molecular weight standards; lane 2, crude detergent extract; lane 3, flow-through fraction from affinity chromatography; and lane 4, affinity-purified Dcytb. Details are described in Experimental Procedures.
Heme stoichiometry and electronic absorbance characteristics of recombinant Dcytb
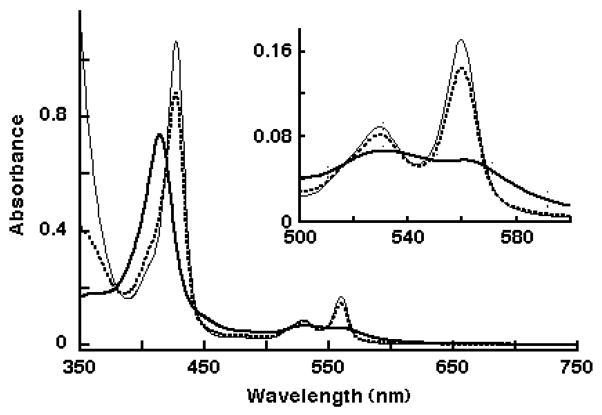
The heme stoichiometry of purified recombinant Dcytb was 1.93 ± 0.07 heme/monomer (n=5), indicating that the bacterial system produces Dcytb with essentially a full complement of heme. The absorption spectrum of oxidized Dcytb has a Soret band at 414 nm with an extinction coefficient of 137 (mM heme)−1 cm−1 (Fig. 2 and Table 2). Reaction of Dcyt b with 15 mM ascorbate led to spectral changes typical for a reduced b-type cytochrome, with a Soret peak at 426 nm and α- and β-bands at 560 and 529 nm, respectively (Fig. 2). These absorbance spectrum features of Dcytb expressed in the E. coli system are essentially the same as those reported for Dcyt b expressed in the insect cell system [4]. Addition of dithionite to the ascorbate-treated Dcytb resulted in further reduction (Fig. 2). Comparison of the intensity of α band absorbance after addition of ascorbate to that with complete reduction by dithionite indicated that Dcytb was 83% reducible by 15 mM ascorbate and 93% reducible by 75 mM ascorbate. Dcytb expressed in the insect cell system was only 67% reduced by 15 mM ascorbate [4], indicating that the Dcytb produced by the bacterial system has considerably improved redox functionality with the physiological reductant.
Fig. 2.
Absorbance spectra of purified recombinant Dcytb (7.1 μM heme) after pre-oxidation with 5 μM ferricyanide (thick line), reduction with 15 mM ascorbate (dashed line), and reduction with dithionite (thin line). The visible region is enlarged in the inset.
Table 2.
Optical spectral parameters of oxidized (ox) and dithionite-reduced (red) states of purified recombinant Dcytba
| Wavelength (nm) | Extinction coefficientb (mM heme)−1 cm−1 | |
|---|---|---|
| Soret nm (ox) | 414 | 137 |
| Soret nm (red) | 427 | 188 |
| Beta nm (red) | 529 | 14.4 |
| Alpha nm (red) | 560 | 29.6 |
| Difference spectrum (red-ox) | 560–575 | 21.5 |
Values represent the averages of six measurements.
Extinction coefficient based on heme content determined by pyridine hemochrome assay.
It is worth noting that the redox behavior of purified Dcytb could be altered by exposure to excess ferricyanide. For example, when the purified protein was treated with 300 μM ferricyanide in the pre-oxidation step (instead of the standard 5 μM level of oxidant), only 50% of the cytochrome was reduced by 15 mM ascorbate. This is markedly lower than the 83% reduction observed for the same level of ascorbate with Dcytb oxidized with 5 μM ferricyanide (Fig. 2). It thus appears that higher levels of ferricyanide can decrease the redox potential of one or both heme centers in Dcytb, and that oxidant levels need to be carefully limited during Dcytb preparation.
EPR spectrum of purified Dcytb
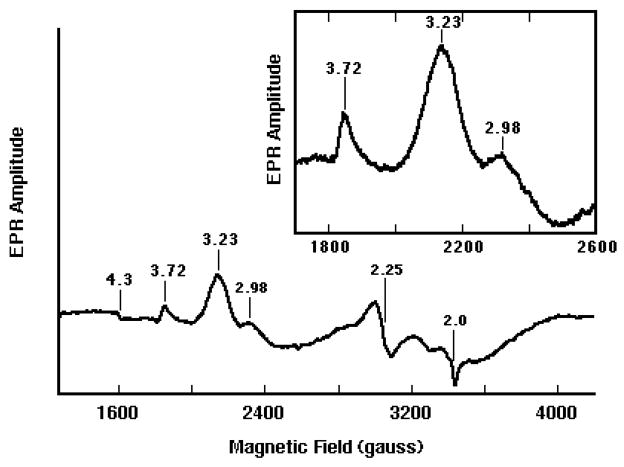
Pre-oxidized Dcytb showed prominent low spin ferric heme signals at gz=3.72 [HALS (highly axial low spin)-type signal arising from the low-potential heme center (bL)] and at gz=3.23 and gy=2.25, from the high-potential heme center (bH) (Fig. 3), consistent with the presence of two hemes in the cytochrome. The gz=3.72 and 3.23 components are typical for low-spin bis-His-coordinated heme centers with HALS structure, and are similar to those observed in adrenal cyt b561 [23,24] and Dcytb expressed in insect cells [4]. In addition to the signals at g=3.72 and g=3.23, purified Dcytb also displayed a small signal at g=2.98. Whereas the signals at g=3.72 and 3.23 were markedly decreased by addition of ascorbate (0.1–2 mM), the g=2.98 signal was essentially unchanged (data not shown). This indicates that the g=2.98 species is unreactive with ascorbate, perhaps because it has a much lower redox potential than the bH and bL heme centers (g=3.72 and 3.23). The EPR spectrum of purified Dcytb also exhibits very small signals at g=4.3 and 2.0 that are characteristics of “adventitious” ferric iron (Fig. 3). Interestingly, the EPR spectrum of purified recombinant Dcytb which was pre-oxidized with 300 μM ferricyanide had much smaller signals at g=3.72 and 3.23 and dramatically increased intensity at g=2.98 (data not shown). This indicates that substantial portions of the bH and bL heme centers were disrupted by the higher level of ferricyanide and is quite consistent with the decreased reducibility by ascorbate described above.
Fig. 3.
EPR spectrum of purified recombinant Dcytb (100 μM heme), pre-oxidized with 5 μM ferricyanide. The g-values are indicated for major signals. Inset: expanded view of the low spin heme signals.
Titration of Dcytb with ascorbate
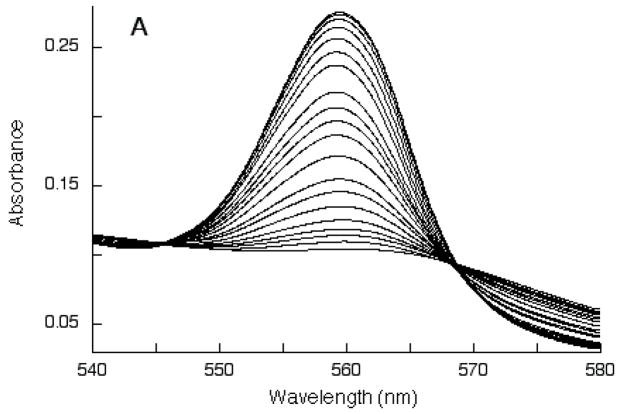
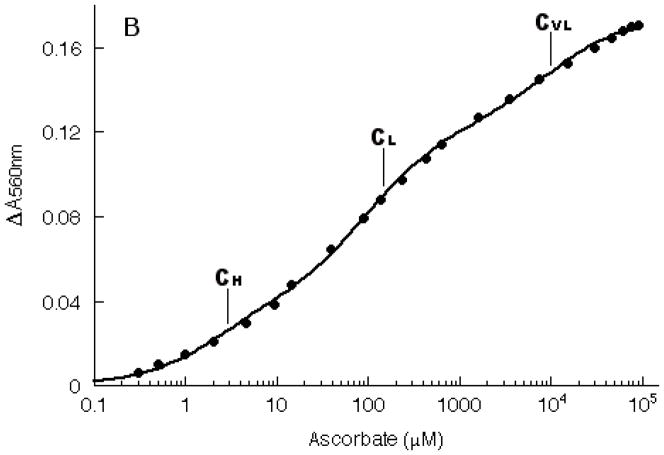
The reaction of ascorbate with Dcytb was examined in more detail by following the increases in alpha band intensity during titration with ascorbate (Fig. 4A). The progress of the titration was monitored by plotting ΔA560 as a function of added ascorbate concentration (Fig. 4B). The increase in A560 appeared to go through three transitions and accordingly was fitted to Eq. 1. The first transition (~30% of overall ΔA560) reflects reduction of the high-potential heme center (bH); the midpoint ascorbate concentration for this transition, CH, was 3.0 μM. The second transition (~45% of overall ΔA560) reflects reduction of the low-potential heme center (bL); this midpoint ascorbate concentration for this transition, CL, was 123 μM. The third transition (~25% of overall ΔA560) was at very high ascorbate levels, reflecting reduction of a very low-potential heme center, termed bVL; this midpoint ascorbate concentration for this transition, CVL, was 11 mM. The purified Dcyt b thus contained substantial portions of cytochrome with midpoint ascorbate concentrations comparable to those of the native bH and bL heme centers, in addition to a non-native bVL population that was reduced only at high ascorbate levels. Given the heme stoichiometry of 1.93 measured for purified Dcytb (see above), it is very likely that bVL represents recombinant protein in which bH and/or bL centers are somehow perturbed, rather than a third heme center.
Fig. 4.
Alpha band intensity changes during titration of purified recombinant Dcytb (10 μM heme) with ascorbate. Panel A: optical spectra. Panel B: increases in A560 are plotted as a function of the ascorbate concentration. The line is the non-linear regression fit to Eq. 1.
Ascorbate reaction kinetics of recombinant Dcytb
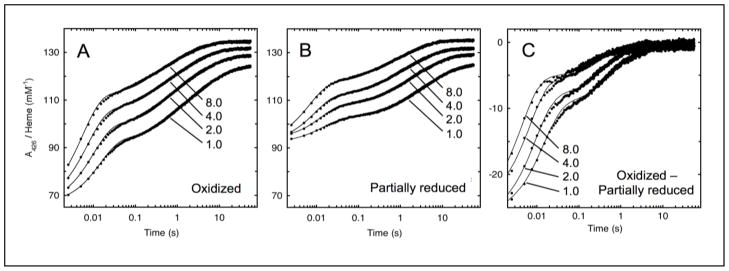
Upon mixing of 1.0, 2.0, 4.0 or 8.0 mM ascorbate with ferric Dcytb at pH 7.2, the absorbance at 426 nm (the Soret band peak of the fully reduced cytochrome) showed a rapid increase (Fig. 5A). The time course data at each ascorbate concentration were found to fit well with a linear combination of three exponential phases (Eq. 2); the fitted amplitude and rate parameters are shown in Table 3. At 1.0 mM ascorbate the ratio of the amplitudes of the fast, middle, and slow phases was approximately 1.7:1:1. The amplitude of the fast phase increased with the ascorbate concentration, and at 8.0 mM ascorbate the ratio of the phase amplitudes was approximately 4:1:1 (Table 3). Although data in Fig. 4 show that ascorbate titration of Dcytb proceeds through three distinct transitions (characterized by CH, CL, and CVL), the ratio of the amplitudes of these transitions (1.2:1.8:1.0) did not resemble the ratio of the kinetic phase amplitudes at any ascorbate level tested.
Fig. 5.
Kinetics of Dcytb reduction by ascorbate. A426 was monitored in stopped-flow experiments during reaction of 1.0, 2.0, 4.0 or 8.0 mM ascorbate with ferric Dcytb (2.0 μM heme) (Panel A) or with Dcytb partially pre-reduced with 10 μM ascorbate (Panel B). Data from three reactions were averaged to obtain each time course shown. The difference time courses in Panel C were obtained by subtracting the time course for partially reduced Dcytb at a given ascorbate concentration (Panel B) from the corresponding time course for oxidized cytochrome (Panel A). Each time course was fitted by regression to a three-exponential equation (Eq. 2) as described in Experimental Procedures.
For an initial examination of the relationship between the kinetic phases and the titration transitions, a set of stopped flow experiments was conducted with Dcytb that had been partially reduced by pre-treatment with 10 μM ascorbate. From Eq. 1 and the observed values of CH, CL, and CVL (3.0, 123, and 11000 μM ascorbate, respectively), this low level of ascorbate produces 77% reduction of bH, 8% reduction of bL, and 0.1% reduction of bVL. Partial reduction thus selectively depletes the ferric bH center, so that subsequent reaction with ascorbate reflects primarily reduction of ferric bL or bVL.
The time courses for reaction of partially reduced Dcytb with 1, 2, 4, or 8 mM ascorbate are shown in Fig. 5B. The initial absorbance levels were higher than that observed with fully ferric Dcytb (Fig. 5A), reflecting the portion of cytochrome reduced during pretreatment. The ascorbate reaction kinetics of the partially-reduced Dcytb proceeded in three distinct phases (Fig. 5B and Table 3), with the amplitudes of the two fastest phases markedly smaller than those observed in reactions with ferric Dcytb. Fig. 5C shows the difference time courses at each ascorbate level, obtained by subtraction of the time course for the partially reduced Dcytb reaction (Fig. 5B) from the corresponding time course for oxidized Dcytb (Fig. 5A). These difference time courses in Fig. 5C, which reflect mainly the kinetics of reduction of ferric bH with ascorbate, are clearly dominated by the two fastest phases, with little contribution from the slowest phase. This point is confirmed by examination of the fitted parameters in Table 3, where the ΔA3 values for the difference time courses are negligible compared to the corresponding ΔA1 and ΔA2 values. Further, the fitted values of k1 for the difference time courses (69, 110, 147, and 234 s−1 for reactions with 1, 2, 4, and 8 mM ascorbate, respectively) agree quite well with the corresponding rate constants found with oxidized Dcyt (69, 101, 137, and 181 s−1); the two sets of fitted values for k2 are also in reasonable agreement with one another. Thus, it is evident that pretreatment of Dcytb with 10 μM ascorbate, which selectively reduces the bH center, preferentially decreases the first and second kinetic phases of subsequent reaction with millimolar levels of ascorbate.
Overall, the results above strongly indicate that the two fastest kinetic phases in reaction of Dcytb with 1–8 mM levels of ascorbate involve preferential reduction of the bH center relative to the bL center. In the ascorbate titrations, ~90% reduction of bL was achieved at 1 mM ascorbate (CL = 123 μM), so there is no thermodynamic barrier to bL reduction at the ascorbate levels used in the kinetic experiments. This leads to the conclusion that ascorbate reacts more quickly at bH than bL. It is interesting to note that other members of the cyt b561 family also show multi-phase ascorbate reaction kinetics [23,25,26]. Further study will be needed to determine if the kinetic selectivity between the bH and bL heme centers observed here for Dcytb is a general feature of cyt b561 family members.
Conclusion
This is the first report of high-yield expression and purification of functional Dcytb from a bacterial system. The purified recombinant Dcytb contains two hemes, with 93% of the heme reduced by 75 mM ascorbate, supporting the assignment of ascorbate as the physiological electron donor. Ascorbate was found to have a kinetic selectivity for the high-potential heme center (bH). Along with the many practical advantages of a bacterial system, the sevenfold improvement in yield of purified Dcyt b, represents a substantial improvement over earlier eukaryotic expression systems [4] for biophysical and biochemical studies of the cytochrome. This should greatly expedite characterization of the mechanism of this important cytochrome, and provide a valuable guide for expression of other cytochrome b561 family members.
Acknowledgments
We are grateful for helpful discussions with Drs. Graham Palmer, Yury Kamensky, and Giordano da Silva at Rice University. This work was supported by grant NIH GM080575.
Footnotes
Publisher's Disclaimer: This is a PDF file of an unedited manuscript that has been accepted for publication. As a service to our customers we are providing this early version of the manuscript. The manuscript will undergo copyediting, typesetting, and review of the resulting proof before it is published in its final citable form. Please note that during the production process errors may be discovered which could affect the content, and all legal disclaimers that apply to the journal pertain.
References
- 1.McKie AT, Barrow D, Latunde-Dada GO, Rolfs A, Sager G, Mudaly E, Mudaly M, Richardson C, Barlow D, Bomford A, Peters TJ, Raja KB, Shirali S, Hediger MA, Farzaneh F, Simpson RJ. An iron-regulated ferric reductase associated with the absorption of dietary iron. Science. 2001;291:1755–1759. doi: 10.1126/science.1057206. [DOI] [PubMed] [Google Scholar]
- 2.Su D, May JM, Koury MJ, Asard H. Human erythrocyte membranes contain a cytochrome b561 that may be involved in extracellular ascorbate recycling. J Biol Chem. 2006;281:39852–39859. doi: 10.1074/jbc.M606543200. [DOI] [PubMed] [Google Scholar]
- 3.Su D, Asard H. Three mammalian cytochromes b561 are ascorbate-dependent ferrireductases. FEBS J. 2006;273:3722–3734. doi: 10.1111/j.1742-4658.2006.05381.x. [DOI] [PubMed] [Google Scholar]
- 4.Oakhill JS, Marritt SJ, Gareta EG, Cammack R, McKie AT. Functional characterization of human duodenal cytochrome b (Cybrd1): redox properties in relation to iron and ascorbate metabolism. Biochim Biophys Acta. 2008;1777:260–268. doi: 10.1016/j.bbabio.2007.12.001. [DOI] [PubMed] [Google Scholar]
- 5.Latunde-Dada GO, Van derWesthuizen J, Vulpe CD, Anderson GJ, Simpson RJ, McKie AT. Molecular and functional roles of duodenal cytochrome b (Dcytb) in iron metabolism. Blood Cells Mol Dis. 2002;29:356–360. doi: 10.1006/bcmd.2002.0574. [DOI] [PubMed] [Google Scholar]
- 6.Vargas JD, Herpers B, McKie AT, Gledhill S, McDonnell J, van den Heuvel M, Davies KE, Ponting CP. Stromal cell-derived receptor 2 and cytochrome b561 are functional ferric reductases. Biochim Biophys Acta. 2003;1651:116–23. doi: 10.1016/s1570-9639(03)00242-5. [DOI] [PubMed] [Google Scholar]
- 7.Tsubaki M, Takeuchi F, Nakanishi N. Cytochrome b561 protein family: expanding roles and versatile transmembrane electron transfer abilities as predicted by a new classification system and protein sequence motif analyses. Biochim Biophys Acta. 2005;1753:174–190. doi: 10.1016/j.bbapap.2005.08.015. [DOI] [PubMed] [Google Scholar]
- 8.Iliadi KG, Avivi A, Iliadi NN, Knight D, Korol AB, Nevo E, Taylor P, Moran MF, Kamyshev NG, Boulianne GL. Nemy encodes a cytochrome b561 that is required for Drosophila learning and memory. Proc Natl Acad Sci USA. 2008;105:19986–19991. doi: 10.1073/pnas.0810698105. [DOI] [PMC free article] [PubMed] [Google Scholar]
- 9.Zhang DL, Su D, Bérczi A, Vargas A, Asard H. An ascorbate-reducible cytochrome b561 is localized in macrophage lysosomes. Biochim Biophys Acta. 2006;1760:1903–1913. doi: 10.1016/j.bbagen.2006.07.019. [DOI] [PubMed] [Google Scholar]
- 10.Opiyo SO, Moriyama EN. Mining Cytochrome b561 proteins from plant genomes. Int J Bioinform Res Appl. 2010;6:209–221. doi: 10.1504/IJBRA.2010.032122. [DOI] [PMC free article] [PubMed] [Google Scholar]
- 11.Njus D, Kelley PM, Harnadek GJ, Pacquing YV. Mechanism of ascorbic acid regeneration mediated by cytochrome b561. Ann N Y Acad Sci. 1987;493:108–119. doi: 10.1111/j.1749-6632.1987.tb27188.x. [DOI] [PubMed] [Google Scholar]
- 12.Ji L, Nishizaki M, Gao B, Burbee D, Kondo M, Kamibayashi C, Xu K, Yen N, Atkinson EN, Fang B, Lerman MI, Roth JA, Minna JD. Expression of several genes in the human chromosome 3p21.3 homozygous deletion region by an adenovirus vector results in tumor suppressor activities in vitro and in vivo. Cancer Res. 2002;62:2715–2720. [PMC free article] [PubMed] [Google Scholar]
- 13.Vargas JD, Herpers B, McKie AT, Gledhill S, McDonnell J, van den Heuvel M, Davies KE, Ponting CP. Stromal cell-derived receptor 2 and cytochrome b561 are functional ferric reductases. Biochim Biophys Acta. 2003;1651:116–123. doi: 10.1016/s1570-9639(03)00242-5. [DOI] [PubMed] [Google Scholar]
- 14.Ludwiczek S, Rosell FI, Ludwiczek ML, Mauk AG. Recombinant expression and initial characterization of the putative human enteric ferric reductase Dcytb. Biochemistry. 2008;47:753–761. doi: 10.1021/bi701793a. [DOI] [PubMed] [Google Scholar]
- 15.Berry EA, Trumpower BL. Simultaneous determination of hemes a, b, and c from pyridine hemochrome spectra. Anal Biochem. 1987;161:1–15. doi: 10.1016/0003-2697(87)90643-9. [DOI] [PubMed] [Google Scholar]
- 16.Kulmacz RJ, Tsai AL, Palmer G. Heme spin states and peroxide induced radical species in prostaglandin H synthase. J Biol Chem. 1987;262:10524–10531. [PubMed] [Google Scholar]
- 17.Laemmli UK. Cleavage of structural proteins during the assembly of the head of bacteriophage T4. Nature. 1970;227:680–685. doi: 10.1038/227680a0. [DOI] [PubMed] [Google Scholar]
- 18.Liu W, Rogge CE, da Silva GF, Shinkarev VP, Tsai AL, Kamensky Y, Palmer G, Kulmacz RJ. His92 and His110 selectively affect different heme centers of adrenal cytochrome b561. Biochim Biophys Acta. 2008;1777:1218–1228. doi: 10.1016/j.bbabio.2008.04.039. [DOI] [PMC free article] [PubMed] [Google Scholar]
- 19.Liu W, Rogge CE, Kamensky Y, Tsai AL, Kulmacz RJ. Development of a bacterial system for high yield expression of fully functional adrenal cytochrome b561. Protein Expr Purif. 2007;56:145–152. doi: 10.1016/j.pep.2007.04.010. [DOI] [PubMed] [Google Scholar]
- 20.Bérczi A, Su D, Lakshminarasimhan M, Vargas A, Asard H. Heterologous expression and site-directed mutagenesis of an ascorbate-reducible cytochrome b561. Arch Biochem Biophys. 2005;443:82–92. doi: 10.1016/j.abb.2005.09.006. [DOI] [PubMed] [Google Scholar]
- 21.Bérczi A, Desmet F, Van Doorslaer S, Asard H. Spectral characterization of the recombinant mouse tumor suppressor 101F6 protein. Eur Biophys J. 2010;39:1129–1142. doi: 10.1007/s00249-009-0564-4. [DOI] [PubMed] [Google Scholar]
- 22.Tsai AL, Palmer G. Purification and characterization of highly purified cytochrome b from Complex III of baker’s yeast. Biochim Biophys Acta. 1982;681:484–495. doi: 10.1016/0005-2728(82)90191-8. [DOI] [PubMed] [Google Scholar]
- 23.Liu W, Kamensky Y, Kakkar R, Foley E, Kulmacz RJ, Palmer G. Purification and characterization of bovine adrenal cytochrome b561 expressed in insect and yeast cell systems. Protein Expr Purif. 2005;40:429–439. doi: 10.1016/j.pep.2004.12.027. [DOI] [PubMed] [Google Scholar]
- 24.Kamensky Y, Liu W, Tsai AL, Kulmacz RJ, Palmer G. Axial ligation and stoichiometry of heme centers in adrenal cytochrome b561. Biochemistry. 2007;46:8647–8658. doi: 10.1021/bi700054g. [DOI] [PMC free article] [PubMed] [Google Scholar]
- 25.Takigami T, Takeuchi F, Nakagawa M, Hase T, Tsubaki M. Stopped-flow analyses on the reaction of ascorbate with cytochrome b561 purified from bovine chromaffin vesicle membranes. Biochemistry. 2003;42:8110–8118. doi: 10.1021/bi0267588. [DOI] [PubMed] [Google Scholar]
- 26.Nakanishi N, Rahman MM, Sakamoto Y, Miura M, Takeuchi F, Park SY, Tsubaki M. Inhibition of electron acceptance from ascorbate by the specific N-carbethoxylations of maize cytochrome b561. J Biochem. 2009;146:857–866. doi: 10.1093/jb/mvp146. [DOI] [PubMed] [Google Scholar]


