

Abstract
Nonsteroidal anti-inflammatory drug-activated gene, NAG-1, a transforming growth factor-β member, is involved in tumor progression and development. The association between NAG-1 expression and development and progression of glioma has not been well defined. Glioblastoma cell lines have lower basal expression of NAG-1 than other gliomas and normal astrocytes. Most primary human gliomas have very low levels of NAG-1 expression. NAG-1 basal expression appeared to inversely correlate with tumor grade in glioma. Aberrant promoter hypermethylation is a common mechanism for silencing of tumor suppressor genes in cancer cells. In glioblastoma cell lines, NAG-1 expression was increased by the demethylating agent, 5-aza-2’-deoxycytidine. To investigate whether the NAG-1 gene was silenced by hypermethylation in glioblastoma, we examined DNA methylation status using genomic bisulfite sequencing. The NAG-1 promoter was densely methylated in several glioblastoma cell lines as well as in primary oligodendroglioma tumor samples, which have low basal expression of NAG-1. DNA methylation at two specific sites (−53 and +55 CpG sites) in the NAG-1 promoter was strongly associated with low NAG-1 expression. The methylation of the NAG-1 promoter at the −53 site blocks Egr-1 binding and thereby suppresses Nag-1 induction. Treatment of cells with low basal NAG-1 expression with NAG-1 inducer also did not increase NAG-1. Incubation with a demethylation chemical increased Nag-1 basal expression and subsequent incubation with a NAG-1 inducer increased NAG-1 expression. We concluded from these data that methylation of specific promoter sequences causes transcriptional silencing of the NAG-1 locus in glioma and may ultimately contribute to tumor progression.
Keywords: NAG-1, GDF15, glioblastoma, DNA methylation
INTRODUCTION
Gliomas are the most prevalent central nervous system tumor of adults. Approximately 25 % of total brain tumors are thought to arise from a glial progenitor cell 1. Glioblastoma (World Health Organization (WHO) grade IV) has the poorest differentiation of glioma and is the most malignant human brain tumor. The median survival time is 12 months and 5-year survival rate is <3% despite advances in antitumor therapy 2.
Genetic alterations in glioma have been extensively studied, including TP53 3–5, PTEN 6, and p16 (CDKN2A)/CDK4/Rb alterations 7, 8, loss of heterozygosity of chromosome 19q 3, 9, and EGFR amplification 3, 10. Mutations in the TP53 tumor suppressor gene occur in about one-half of all human cancers. TP53 mutations are the first detectable genetic alteration in two-third of precursor low-grade diffuse astrocytomas, anaplastic astrocytomas, and glioblastomas 3–5. Transforming growth factor-β (TGF-β) also plays a key role in malignant glioma progression. Exogenous expression of TGF-β receptors has been proposed as a therapeutic avenue in glioma 11, 12. Epigenetic changes, such as DNA methylation and histone modification favoring transcriptional silencing, have also emerged as important contributors to tumorigenesis. DNA hypermethylation of promoter DNA at the p16, sFRP1, GATA4, GATA5, O6-MGMT, p73, and TMS1 loci has been reported in multiple cancer types 13. Hypermethylation of TIMP3, EMP3, CST6, BIK, and TSPYL5 have been detected in glioblastoma multiforme 14, 15.
The nonsteroidal anti-inflammatory drug-activated gene (NAG-1), a divergent member of the TGF-β superfamily, is involved in tumor progression and development 16. NAG-1 was mapped to 19p12.1–13.1 and subsequently given various names, including GDF15, MIC-1, PTGF-β, PLAB, PDF, and PL74. Previous investigations on the regulation of NAG-1 expression revealed complex mechanisms that can be modulated by multiple cellular stressors, such as acute injury, inflammation, cancer and drugs known to have anti-tumorigenic, pro-apoptotic or anti-inflammatory activities 17–20. Many studies showed that the over-expression of NAG-1 in cancer cells results in growth arrest and increases in apoptosis 21. NAG-1 transgenic mice expressing human NAG-1 ubiquitously appear to be less susceptible to genetically or chemically induced intestinal cancer 22. The NAG-1 transgenic mice have significantly suppressed polyp transformation in the small intestine after treatment with azoxymethane or after introduction of mutant APC 23. These findings suggest that NAG-1 may act as a tumor suppressor, but the detailed mechanisms of action of NAG-1 in tumorigenesis have not been elucidated to date.
NAG-1 protein has been detected in the epithelium in the central nervous system and is reported to function as both a neurotrophic and a neuroprotective factor 19, 24. NAG-1 expression is markedly increased in many solid cancers, including prostate, colon, breast, melanoma, pancreatic, and thyroid cancer 25, 26. In contrast, our previous study demonstrated that NAG-1 expression in glioblastoma cell lines was significantly lower than in benign glioma cells and normal human astrocytes 27. Strelau also reported that primary glioblastoma have less NAG-1 expression compared to other gliomas 28. This observed decrease in the expression of NAG-1 in glioblastomas suggests modulation of expression – potentially through epigenetic mechanisms such as DNA methylation. Methylated CpG islands have been identified in distinct subgroups of glioma but analysis of methylated CpG islands was not informative for NAG-129. In this report, we asked whether the NAG-1 locus might be regulated by epigenetic mechanisms in glioblastoma. Our data implicate DNA methylation and accompanying transcriptional silencing as a mechanism coupling NAG-1 expression to tumor growth characteristics in glioma.
Material and Methods
Cell culture and reagents
The glioblastoma multiforme cell lines T98G, U118MG, U138MG, U373, U87MG, and A172, the glioma cell line Hs683, and the low grade astrocytoma cell line SW1088 were purchased from the American Type Culture Collection (Manassas, VA). The NHA cell line was obtained from Clonetics (San Diego, CA). All glioblastoma cells and Hs683 cells were maintained in Dulbecco’s modified Eagle Medium, containing 4.5g/L D-Glucose and L-glutamine from Gibco (Grand Island, NY) and supplemented with 1 mM MEM Sodium Pyruvate Solution (Gibco), 10 µg/ml gentamicin (Gibco), and 10% heat-inactivated fetal bovine serum (FBS). The SW1088 and NHA cells were maintained in AGM Bullet Kit from Lonza (Walkersville, MD). 5-aza-2’-deoxycytidine (5-AZA-dC) and trichostatin A (TSA) were purchased from Sigma-Aldrich (St. Louis, MO) and were dissolved in 0.1% Me2SO (DMSO). Sulindac sulfide (SS) was purchased from Sigma and was dissolved in ethanol. Antibodies were from the following sources: Anti-β-Actin (1:2000 dilution) was from Cell Signaling Technology (Beverly, MA). NAG-1 polyclonal rabbit antibody (1:1500 dilution) was generated in this laboratory 21. Anti-Egr-1 (sc-110X) and normal rabbit IgG (sc-2027) were from Santa Cruz Biotechnology (Santa Cruz, CA).
Primary glioma tumor samples
All primary tumor samples used for this study were derived from snap frozen surgical tissue samples from the Midwestern division of the cooperative human tissue network, USA.
Western blot analysis
Total cell lysates from cultured cells and primary tumor samples were isolated in RIPA buffer with Complete Mini protease inhibitor cocktail tablets from Roche (Indianapolis, IN), sonicated briefly, and quantitated by BCA assay from Pierce (Rockfold, IL). Thirty micrograms of total protein per lane were separated by SDS-PAGE 4–12% Bis–Tris gel from Invitrogen (Carlsbad, CA) and transferred onto a nitrocellulose membrane (Invitrogen). The blots were blocked for 1 h in 5% skim milk in Tris-buffered saline containing 0.05% Tween-20 (TBS-T; Sigma-Aldrich) and probed overnight at 4 °C in 5% skim milk in TBS-T with each primary antibody. After washing with TBS-T, the blots were incubated with the appropriate horseradish peroxidase-conjugated secondary antibody for 1 h at room temperature in 3% skim milk in TBS-T, washed several times in TBS-T, and detected by the Amersham ECL plus Western blot detection system from GE Healthcare (UK)
ELISA analysis
To examine Nag-1 levels in the cell culture media, we used the human GDF-15 Duo Set ELISA Development kit from R&D systems, Inc. (Minneapolis, MN) following the manufacturer’s protocol. Briefly, an ELISA plate was coated with 2.0 µg/ml of monoclonal anti-human GDF-15 capture antibody. Then, various concentrations of standard recombinant GDF-15 and samples added to each well, and the plate was incubated for 2 h at room temperature. After the plate was washed, 50ng/ml of biotinylated goat GDF-15 antibody was incubated for 2h at room temperature. Finally streptavidin conjugated horseradish peroxidase was added and the optical density of each well was determined using a microplate reader set to 450 nm.
Isolation and Reverse Transcription
Total RNAs from cultured cells and primary tumor samples were isolated with QIAshredder and RNeasy MINI kit from Qiagen (Valencia, CA) according to the manufacturer’s protocol. 1µg of RNA was treated with 1 unit of DNase I Amplification Grade (Invitrogen) at room temperature for 15min to remove genomic DNA and followed by inactivation with 2.5mM EDTA (Invitrogen) at 65 degree C for 5min. Reverse transcription (RT) was performed with Super Script II Reverse Transcriptase (Invitrogen) according to the manufacturer’s protocol. The cDNA was stored at −20 degree C until use.
Real-time RT-PCR
Real-time-PCR assays were performed using the iQ5 and MyiQ Real PCR detection system (Bio-Rad, Hercules, CA). Real time RT-PCR fluorescence detection was performed in 96-well plates with iQ SYBR Green Supermix (Bio-Rad). Amplification primers were 5′-TGCCCGCCAGCTACAATC-3′ (forward) and 5′-TCTTTGGCTAACAAGTCATCATAGGT-3′ (reverse) for NAG-1 gene; and 5′-CCTGGCACCCAGCACAAT-3′ (forward) and 5′-GCGGATCCACACGGAGTACT-3′ (reverse) for β-Actin. The threshold cycle number (CT) for same amount of cDNA of each sample was determined in triplicate. The copy number for NAG-1 was calculated from the CT value. All the results represent means ± SD of 3 independent experiments.
DNA extraction and bisulfite genomic sequencing PCR
Total genomic DNA from cultured cells and primary tumor samples were isolated with DNeasy Blood and Tissue Kit (Qiagen) according to the manufacturer’s protocol. Bisulfite modification was done using the EZ DNA methylation Gold Kit (Zymo Research) following the manufacturer’s instructions. Bisulfite sequencing PCR primers were designed with the Web software program EpiDesigner (http://www.epidesigner.com/). The sequences of the bisulfite sequencing PCR primers were 5’-AAGAGGATATTGAGGTTTAGAAATGTG-3’ (forward) and 5’-AATCTTCCCAACTCTAATTAACCC- 3’ (reverse). This primer set was used to amplify the CpG island around the transcription start site of the NAG-1 gene (−217 to +258) in the promoter region with an expected 465–bp product. PCR reactions were done with Platinum Taq DNA polymerase (Invitrogen). The PCR products were resolved on a 2% agarose gel, purified with a QIAquick Gel Extraction Kit (Qiagen), cloned with TOPO XL PCR Cloning kits (Invitrogen), and sequenced with an ABI 3100 automated sequencer (Applied Biosystems, Inc.).
Chromatin Immunoprecipitation (Chip) Assay
Chip assay was performed using the Chip assay kit from Upstate Biotechnology (Lake Placid, NY) according to the manufacturer’s protocol. Briefly, T98G and U118MG cells (3×10⁶) in the 10-cm dish were treated with 30µM Sulindac sulfide or control (0.1% Me2SO) for 4h and then fixed by the additional of 1% formaldehyde to media for 5min at 37°C. The fixed cells were scraped into conical tubes, pelleted, and lysed in SDS lysis buffer containing protease inhibitor (Roche and Sigma). DNA was sheared to fragments of 200–800 bp by sonication 10 times for 30 s. The sonicated cell supernatant was diluted 10-fold in the Chip dilution buffer. The chromatin was precleared with salmon sperm DNA/protein A-agarose slurry for 1 h at 4 °C. The precleared supernatant was incubated with antibodies against Egr-1 (sc-110) or normal rabbit IgG over night at 4°C. The immunocomplexes were eluted with elution buffer (1% SDS and 0.1 M NaHCO3). 5 M NaCl was added into eluted samples to reverse histon-DNA cross-links and the samples were heated overnight at 65 °C. Then DNAs were purified and analyzed by quantitative PCR, using primers specific to sequences at the NAG-1 promoter, i.e., 5′-CAGCTGTGGTCATTGGAGTG-3′ and 5′-GAGCTGGGACTGACCAGATG-3′ for Sp-1 binding site BC.
Plasmid transfection
The NAG-1 expression vector (pcDNA3-NAG-1) was described previously 21U87MG cells were seeded in 6-well plates at 30 × 104 cells/well in DMEM and grown to 60% confluence. 1 µg of pcDNA3-NAG-1 or pcDNA3.1 (empty vector for expression control) were transfected using FuGENE 6 Transfection Reagent (Roche) according to the manufacturer’s protocol. After 24 h transfection, the efficiency of transfection was confirmed by Western blot and ELISA.
Flow cytometry
After transfection of pcDNA3.1 or pcDNA3-NAG-1, the cells were incubated with serum free media for 5 days. Cells were trypsinized and harvested by centrifugation. Pellets were washed with PBS, resuspended in PBS containing 10mg/ml propidium iodide (Roche) and 0.5mg/ml RNase (Roche) and stored overnight at 4°C. Stained cells were analyzed using a Becton Dickinson FACSort (Franklin Lakes, NJ) as per manufacturer’s instructions. The fraction of sub G1 cells in the population was determined using CellQuest 3.1 software (Becton Dickinson Flowcytometry System).
Colony Formation in Soft agar assay
After transfection of pcDNA3.1 or pcDNA3-NAG-1, the U87 cells were trypsinized and re-suspended at 2 × 10³ cells in 1 ml of 0.35% agar solution in growth media, then layered on top of a 0.7% agar layer in 6-well plates. Plates were incubated for 2 weeks at 37 °C in a 5% CO2 humidified atmosphere. Cell colonies were visualized following an overnight stain with 0.5 ml of 0.025% crystal violet (Sigma-Aldrich) and examined microscopically. These were represented as mean colony number examined in 5 randomly chosen microscope fields.
Statistical analysis
All statistical differences between experimental groups were evaluated by the two-tailed unpaired Student’s t test.
RESULTS
NAG-1 basal expression in glioma cells and primary tumors
The basal expression of Nag-1 in several glioma cell lines, normal human astrocytes, and several primary glioma samples were determined at both the mRNA and protein levels. The basal expression of NAG-1 pro-protein was very low in all glioblastoma cell lines except in A172. In contrast, low grade glioma cell lines, such as Hs683 and SW1088, and normal human astrocytes exhibited higher levels of NAG-1 pro-protein (Fig1A). NAG-1 pro-peptide is cleaved and secreted into the media as a mature dimer. Thus the secreted form was measured n cell media to further analyze total NAG-1 formation. The basal expression of secreted NAG-1 protein in media was also very low in high grade glioblastoma cell lines (U118, U138, and U373, Fig 1B). A higher secreted NAG-1 was observed in T98G and A172 cells. In the low grade cell lines and in the normal human astrocytes high levels of the secreted protein were observed. Thus, in cultured cell lines, the high grade glioblastomas express NAG-1 poorly.
FIGURE 1. NAG-1 basal expression in glioma cells, NHA cells, and primary tumor samples.
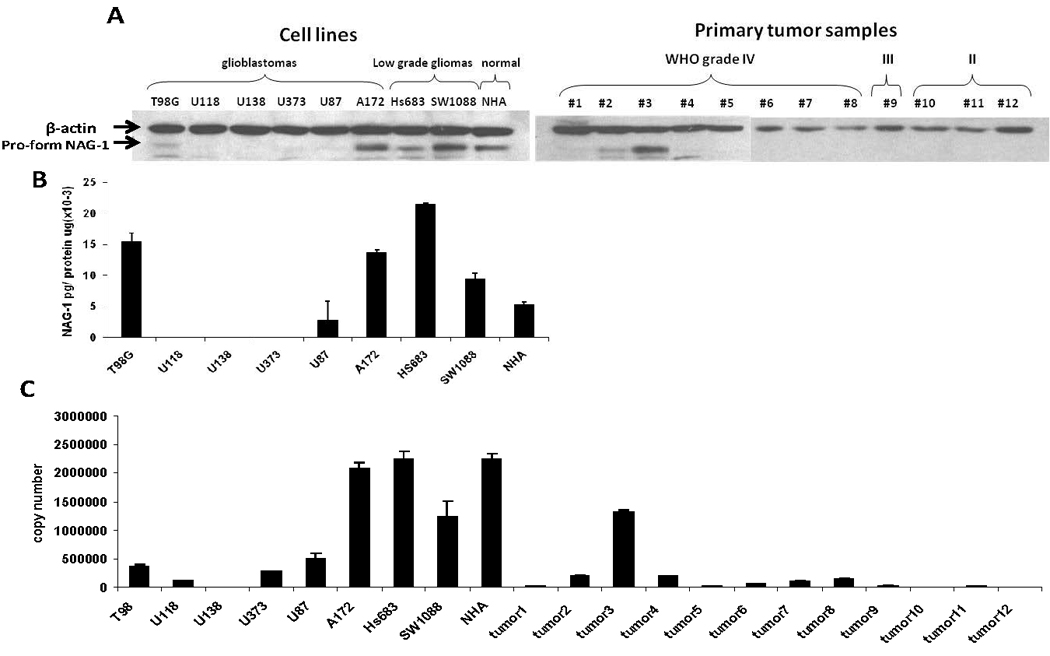
A, Western blot analysis depicts the expression of β-actin and NAG-1 protein basal levels. B, ELISA analysis depicts secret NAG-1 protein concentration in growth media of cell culture. Secret NAG-1 concentration was normalized by total protein concentration. C, quantitative real-time RT-PCR analysis shows the basal level of NAG-1 mRNA reported as copy number. The values shown in the graph are the mean±S.D. of three independent experiments. The values shown in the graph are the mean±S.D. of three independent experiments.
We next measured NAG-1 protein levels in primary tumor samples. The basal expression of NAG-1 pro-peptide in all glioma samples was very low with a single exception (tumor 3, Fig.1A). Further, NAG-1 expression was remarkably low in oligodendrogliomas (WHO grade II) (tumor 10 to tumor 12, Fig.1A). To confirm the low expression of NAG-1 in high grade glioma we measured the mRNA copy number. The expression was the lowest in the high grade glioblastoma cell lines and glioma while higher basal expression was observed in the low grade or normal cell lines. This data suggests the basal expression of NAG-1 is suppressed in higher grade glioma.
Methylation status NAG-1 in glioma cell lines and primary tumors
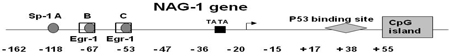
The methylation status of CpG sites of the NAG-1 promoter (−162 to +55) (Table.1) and the intragenic CpG island (+97 to +234) (supplemental table 1) were determined by bisulfite sequencing of genomic DNA isolated from the cell lines and primary tumors. In U118 and U138, the CpG sites of NAG-1 promoter were uniformly methylated. CpG dinucleotides at two sites (−53 and +55) of the NAG-1 promoter were more frequently methylated in the cells with low NAG-1 expression (U118, U138, U373, and U87) than in cells with moderate to high expression of NAG-1. The CpG site at position −53 of the NAG-1 promoter is Sp-1 binding site C, one of the pivotal sites regulating basal expression and is also critical to activated expression of the locus mediated by Egr-1 30. The CpG site at position +55 is very close to a putative p53 binding site that may also regulate NAG-1 expression 30. No correlation of DNA methylation status in the intragenic CpG island with expression was observed. (Supplemental Table). These results indicate hypermethylation correlates with the low expression of NAG-1 in glioblastoma cell lines.
Table 1. Methylation stasus of NAG-1 promoter in glioma cells, NHA cells and primary tumor samples.
Bisulfite sequencing PCR was used to determine the methylation status of all 11 of the CpG sites in NAG-1 promoter region (−162 to +55) in glioma cells and NHA cells. Eight clones of each cell lines were analyzed. The values are the percent methylated.
 | |||||||||||||
|---|---|---|---|---|---|---|---|---|---|---|---|---|---|
| −162 | −118 | −67 | −53 | −47 | −36 | −20 | −15 | +17 | +38 | +55 | |||
| Cell Lines | glioblastoma | T98 | 0 | 0 | 0 | 0 | 0 | 0 | 0 | 0 | 12.5 | 0 | 12.5 |
| U118 | 62.5 | 25 | 37.5 | 75 | 75 | 25 | 50 | 37.5 | 50 | 37.5 | 62.5 | ||
| U138 | 100 | 87.5 | 50 | 100 | 100 | 50 | 100 | 87.5 | 100 | 87.5 | 100 | ||
| U373 | 75 | 50 | 37.5 | 25 | 12.5 | 0 | 0 | 0 | 50 | 12.5 | 50 | ||
| U87 | 62.5 | 50 | 0 | 62.5 | 12.5 | 12.5 | 12.5 | 12.5 | 50 | 25 | 87.5 | ||
| A172 | 12.5 | 25 | 0 | 0 | 0 | 0 | 0 | 0 | 0 | 12.5 | 12.5 | ||
| Low grade glioma | HS683 | 12.5 | 50 | 25 | 25 | 0 | 0 | 25 | 0 | 37.5 | 25 | 12.5 | |
| SW1088 | 0 | 25 | 0 | 0 | 0 | 0 | 12.5 | 12.5 | 37.5 | 12.5 | 12.5 | ||
| NHA | 100 | 50 | 12.5 | 25 | 12.5 | 0 | 0 | 0 | 25 | 25 | 25 | ||
| Primary Glioma | GBM | Tumor1 | 0 | 25 | 12.5 | 0 | 0 | 0 | 0 | 0 | 12.5 | 12.5 | 12.5 |
| Tumor2 | 62.5 | 75 | 12.5 | 12.5 | 0 | 0 | 12.5 | 0 | 37.5 | 12.5 | 12.5 | ||
| Tumor3 | 50 | 25 | 37.5 | 12.5 | 12.5 | 0 | 0 | 12.5 | 12.5 | 12.5 | 12.5 | ||
| Tumor4 | 50 | 37.5 | 25 | 25 | 0 | 25 | 25 | 25 | 37.5 | 0 | 12.5 | ||
| Tumor5 | 12.5 | 25 | 12.5 | 0 | 0 | 12.5 | 0 | 12.5 | 12.5 | 12.5 | 12.5 | ||
| Tumor6 | 75 | 37.5 | 25 | 12.5 | 12.5 | 0 | 12.5 | 12.5 | 25 | 25 | 37.5 | ||
| Tumor7 | 50 | 62.5 | 25 | 12.5 | 0 | 0 | 0 | 0 | 12.5 | 12.5 | 12.5 | ||
| Gliosarcoma | Tumor8 | 37.5 | 75 | 25 | 12.5 | 0 | 12.5 | 12.5 | 0 | 37.5 | 12.5 | 0 | |
| Anaplastic oligodendro glioma WHO III | Tumor9 | 50 | 50 | 25 | 37.5 | 37.5 | 12.5 | 12.5 | 0 | 62.5 | 87.5 | 62.5 | |
| Oligodendro glioma WHO II | Tumor10 | 62.5 | 100 | 37.5 | 62.5 | 37.5 | 25 | 25 | 37.5 | 75 | 37.5 | 37.5 | |
| Oligodendro glioma WHO II | Tumor11 | 87.5 | 100 | 75 | 87.5 | 62.5 | 12.5 | 0 | 0 | 100 | 75 | 37.5 | |
| Oligodendro glioma WHO II | Tumor12 | 100 | 100 | 12.5 | 37.5 | 12.5 | 12.5 | 0 | 25 | 100 | 0 | 100 | |
Hypermethylation status was then measured in human glioblastoma samples. In primary glioblastoma (tumor 1 to tumor 8), these sites were less methylated than the corresponding site in glioblastoma cell lines, as expected. In anaplastic oligodendroglioma (WHO grade III) (tumor 9) and oligodendroglioma (tumor 10 to tumor 12), CpG site −118, −53, +17, and +55 of NAG-1 promoter were frequently methylated. The CpG site at position −118 of the NAG-1 promoter is Sp-1 binding site A, also a pivotal Sp-1 binding site. TSA induction of NAG-1 expression is dependent on Sp-1binding site A and Sp-1 binding site C 27.
In cell lines and primary tumor samples, the CpG island of the NAG-1 gene was evenly methylated. This methylation was limited to the +176 to +234 positions in normal human astrocytes. We concluded from these experiments that the suppression of NAG-1 expression is associated with DNA methylation of specific sites in the NAG-1 promoter.
Treatment with DNA demethylation agent induces NAG-1 expression
Epigenetic repression of tumor suppressor genes by DNA methylation and histone modification often disrupts differentiation of epithelial and hematopoietic cells and can promote cancer progression 31. Previously we investigated the effect of the histone deacetylase inhibitor, Trichostatin A (TSA) on NAG-1 regulation in glioma cells. TSA induced NAG-1 expression at the transcriptional and post transcriptional levels in T98G glioblastoma cells. However we did not observed the induction of NAG-1 by TSA in U87, U118, U138, and U373 glioblastoma cells, whose basal expression of NAG-1 was low 27 and promoter hypermethylated. To investigate if the low response was due to hypermethylated promoter U87, U118, U138, and U373 cells were treated with the DNA demethylation agent, 5-AZA-dC, then basal NAG-1 expression was measured. The protein (Fig.2A) expression of NAG-1 were significantly induced by 5-AZA-dC in three of four cell lines examined (U87, U118, and U373,). Note the exposure time on Figure 2A was longer than Figure 1A. We next measured the mRNA expression after incubation with 5AZA-dC or vehicle. Treatment with the demethylation drug increased the expression of NAG-1 mRNA in all cells tested except U138 with expression too low to accurately measure (Fig.2B).
FIGURE 2. DNA demethylation agent, 5-AZA-dC induces NAG-1 expression in glioblastoma cells.
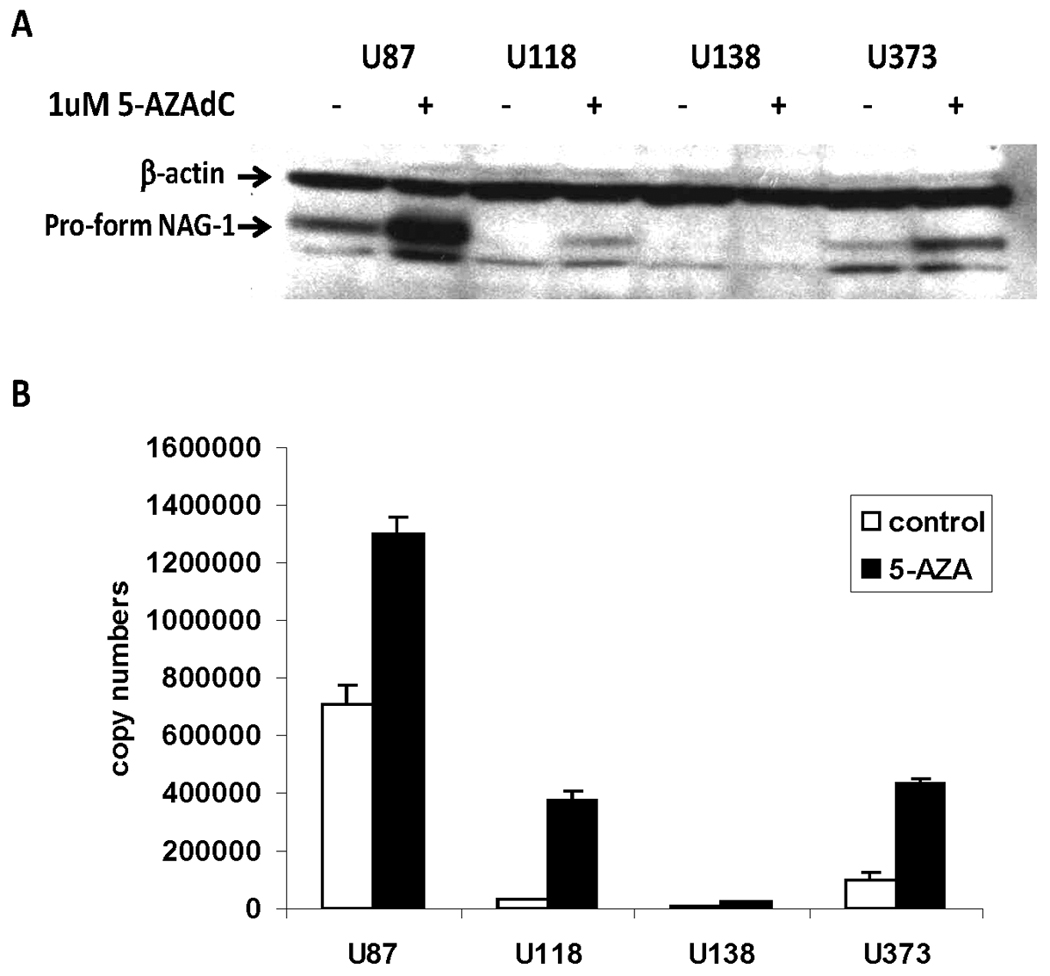
A, NAG-1 protein levels as determined by Western blot analysis. B, NAG-1 mRNA levels as determined by quantitative real-time RT-PCR. U87, U118, U138, U373 cells were treated with vehicle (white bar) or 1µM 5-AZA-dC (black bar) in serum containing media for 48 h. β-actin is a control for the amount of protein loaded. The values shown in the graph are the mean±S.D. of three independent experiments.
Sulindac Sulfide (SS) treatment in different methylation status cell lines
The cyclooxygenase inhibitor is a potent inducer of NAG-1 mediated by the induction of Egr-1 that binds to Sp/Egr1 site in the NAG promoter. Methylation of this region may block the induction of NAG-1 by sulindac sulfide. To test this hypothesis T98G (lower methylation status ) and U118 cells that has high methylation level were incubated with sulindac sulfide. The T98G cells which have a hypomethylated promoter showed good induction of NAG-1 protein by sulindac sulfide (Fig.3A). In contrast, U118 cells which have a hypermethylated promoter showed poor induction of NAG-1 protein. We also measured secreted NAG-1 protein in medium at different time points after treatment. (Fig.3B). The T98G cells also showed significant induction of NAG-1, but the U118 cells showed very low expression.
FIGURE 3. Hypermethylation prevents Nag-1 expression in glioblastoma cells.
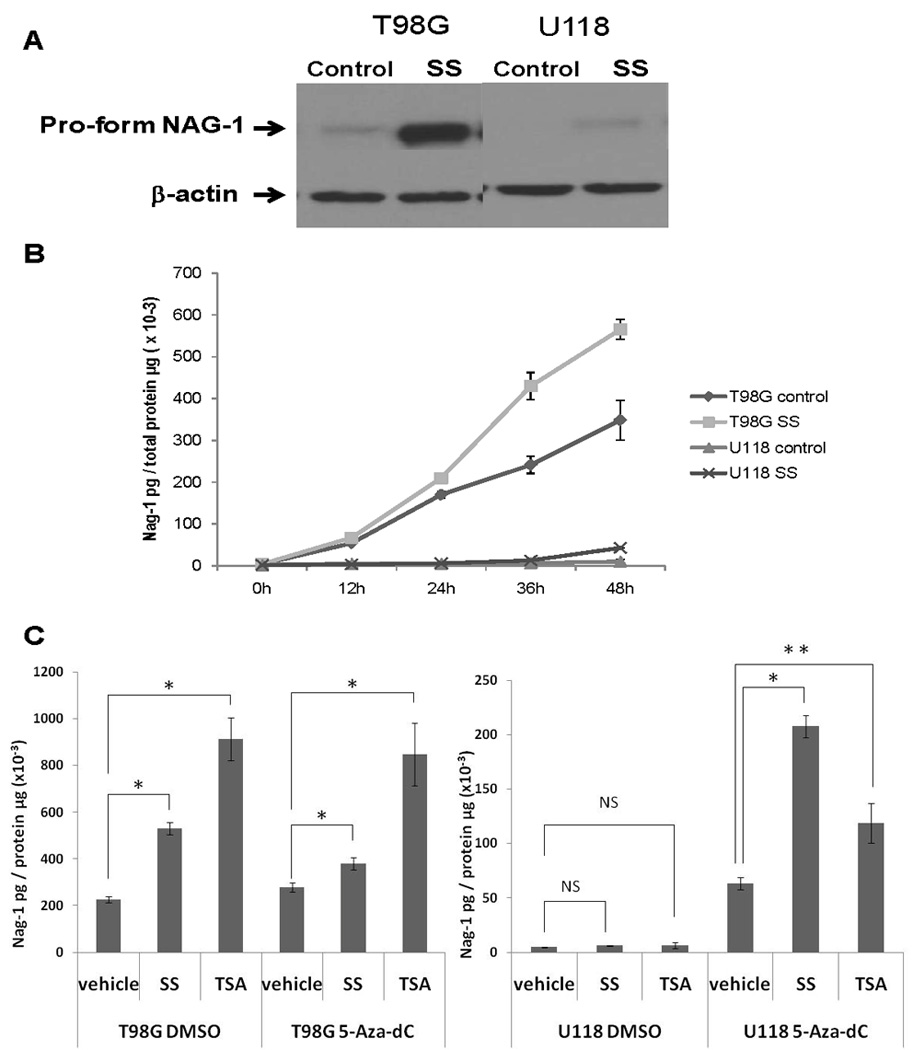
A, Western blot analysis depicts the expression of β-Actin and NAG-1 protein. β-Actin is a control for the amount of protein loaded. B, ELISA analysis depicts secret NAG-1 protein concentration in growth media of cell culture at different time points as indicated. Secret NAG-1 concentration was normalized by total protein concentration. T98G and U118 cells were treated with vehicle or 30µM SS in serum-free media. C.ELISA analysis depicts secret NAG-1 protein concentration in growth media of cell culture. Secret NAG-1 concentration was normalized by total protein concentration. T98G and U118 cells were pretreated with or without 5-Aza-dC in serum contain media for 5 days, then treated with vehicle, 30µM SS or 500ng/ml TSA in serum-free media for 24 h. The values shown in the graph are the mean±S.E. of three independent experiments. p values derived from Student’s t test is (*) p < 0.01, (**) p < 0.05.
Effects of combination treatment of 5-aza-dC with SS or TSA
Following pretreatment for 5 days with 5-Aza-dC, T98G and U118 cells were passaged, starved over night with serum-free medium, and subsequently treated with vehicle, SS or TSA in serum free medium for 24 h and the mature Nag-1 dimer measured in the media. In T98G cells, pretreatment with 5-Aza-dC did not alter the respond to either NSAIDS (sulindac sulfide) or TSA. In contrast in U118 cells, pretreatment with 5-Aza-dC significantly increased basal Nag-1 protein expression and increased the respond to both drugs (Fig.3C). These results suggest that methylation of the NAG-1 promoter in glioblastoma cell lines prevents the NSAID-induced increases in Nag-1 protein observed in cells lacking promoter methylation.
Hypermethylation blocks Egr-1 binding to Nag-1 promoter
Sulindac sulfide mediates increases in NAG-1 expression by an increase in Egr-1 expression. Egr-1 then binds to the Sp1/Egr-1 sites in the NAG-1 promoter, stimulating gene expression. Sulindac sulfide induced Egr-1 mRNA expression in T98G and U118 cells (Fig.4A) with the peak mRNA expression observed at 2 h after treatment in both cell lines. We suspected that hypermethylation in the Sp-1/Egr-1 site would block Egr-1 binding to Nag-1 promoter. To test this hypothesis chromatin immunoprecipitation assay was used to determine whether Egr-1 protein is bound to the NAG-1 promoter. T98G and U118 cells were treated with SS or vehicle for 4 h. Subsequently the Egr-1 protein and DNA complex were measured. SS treatment induced an approximately 2-fold increase in bound Egr-1 in T98G cells, but there was no increase in U118 cells (Fig.4B). To confirm whether demethylation increase Egr-1 binding to NAG-1 promoter, following pretreatment for 5 days with 5-Aza-dC, T98G and U118 cells were passaged, starved over night with serum-free medium, and subsequently treated with SS or vehicle in serum free medium for 4 h, and then Egr-1 and DNA complex were measured. T98G showed about 2.5-fold increase and U118 showed about 2-fold increase by SS (Fig.4C). Following treatment for 5 days with 5-aza-dC CpG site −67, −53 and +55 of Nag-1 promoter were surely demethylated in U118 cell which was confirmed by bisulfate sequencing of genomic DNA. (Supplemantal Table 2). Taken together, these findings indicate that hypermethylation blocks Egr-1 binding to Nag-1 promoter, therefore, suppress the Nag-1 induction.
FIGURE 4. Hypermethylation blocks Egr-1 binding to Nag-1 promoter.
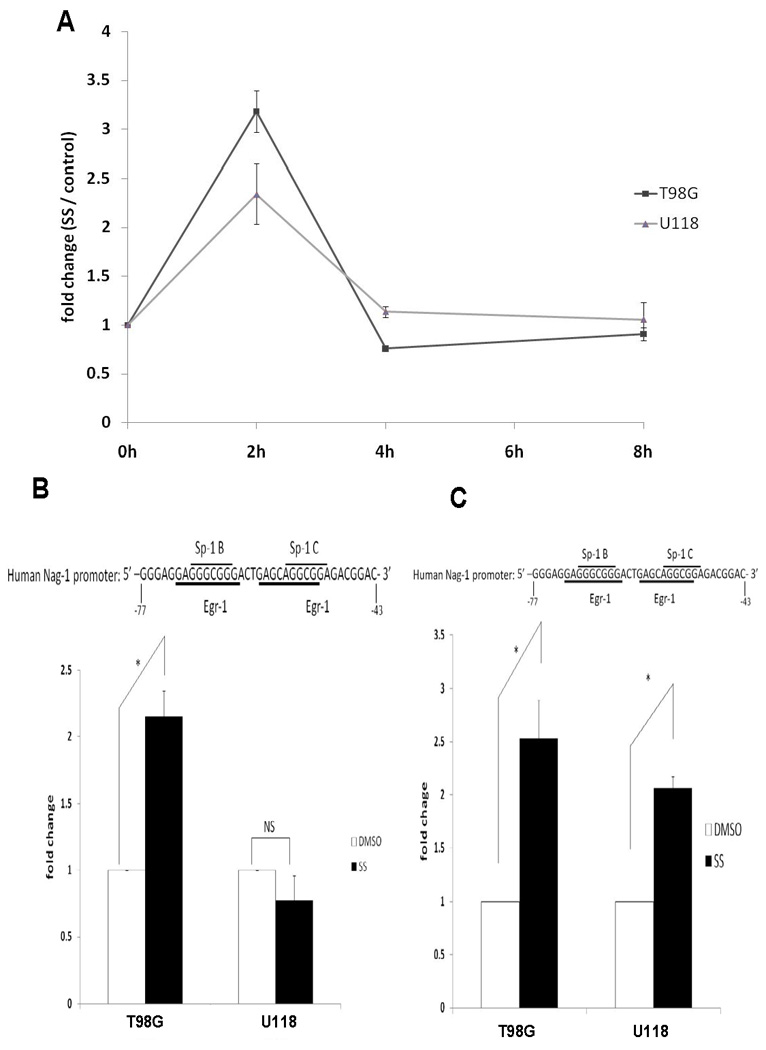
A, Egr-1 mRNA levels as determined by quantitative real-time RT-PCR analysis. T98G and U118 cells were treated with vehicle or 30µM SS at different time points as indicated. The values shown in the graph are the mean±S.E. of three independent experiments. B, The Egr-1 binding region amplified by the specific PCR primers in Chip assays is indicated. T98G and U118 cells were treated with vehicle or 30µM SS for 4 h and the Egr-1 protein and target DNA complex was examined by Chip and quantitative real-time PCR. C, Cells were pre-treated with 5-Aza for 5 days, passaged, starved overnight, treated with 30µM SS for 4 h and then examined by the Chip assay. The values shown in the graph are the mean±S.E. of three independent experiments. p values derived from Student’s t test is (*) p < 0.01.
NAG-1 expression and apoptosis in glioma cells
NAG-1 expression is associated with cell cycle arrest and increased apoptosis in a number of cells but this has not been studied in glioblastomas. Furthermore we wondered if the expression of NAG-1 in glioma having a hypermethylated promoter would response to NAG-1 expression. The effect of NAG-1 over-expression was examined in several glioblastoma cell lines which have highly methylated promoters and hence low basal expression of NAG-1, (U87, U118, U138, and U373 cells). Each cell line was transfected with NAG-1 expression plasmid and the NAG-1 expression confirmed by western blot for the pro-form (Fig.5A) and ELISA assay for the secreted NAG-1 (Fig.5B). NAG-1 proteins in both cell lysates and growth media in all cells were highly expressed in the transfected cells.
FIGURE 5. NAG-1 over-expression increased apoptosis in glioblastoma cells.
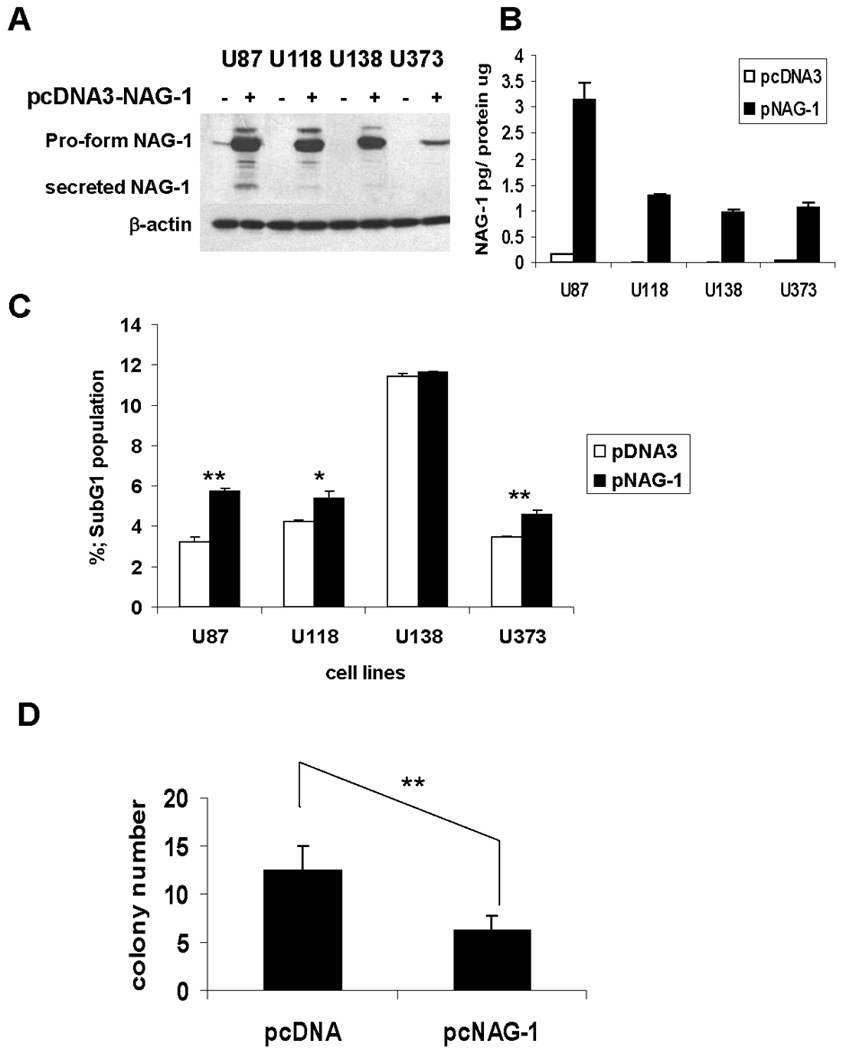
A, NAG-1 protein levels in cell lysates (A) and secret NAG-1 protein levels in growth media (B) after transfection as determined by Western blot analysis and ELISA. U87, U118, U138, U373 cells were transfected with pcDNA3 (white bar) or pcDNA3-NAG-1 (black bar) for 24 hr, then measured. β-Actin is a control for the amount of protein loaded. Secret NAG-1 concentration was normalized by total protein concentration. The values shown in the graph are the mean±S.D. of three independent transfections. C. the population of apoptotic cells by flow cytometry. After transfection for 24 hr, cells were incubated with serum free media for 5 days. The values shown in the graph are the mean±S.D. of three independent transfections. p values derived from Student’s t test is (**) p < 0.01, 0.01 < (*) p < 0.05. D, Alteration of NAG-1 expression with NAG-1 overexpression plasmid affects soft agar growth. U87 cells were transiently transfected with pcDNA3.1 or pcDNA3-NAG-1 for 24 h, then re-suspended and grown for 2 weeks in soft agar. The bar graphs represent mean ± S.D. of colony number in 5 randomly chosen microscope fields. **p < 0.01, significant differences.
Subsequently, cells were incubated with serum free medium for 5 days, and then cell cycle measured by flow cytometry. NAG-1 over-expression significantly increased the proportion of apoptotic cells as measured by the sub-G1 population in U87, U118, and U373 (Fig.5C). Thus NAG-1 expression has a pro-apoptotic effect in glioblastoma cells which have low basal expression of NAG-1. Because NAG-1 acts as a tumor suppressor, we next examined whether NAG-1 expression would inhibit the growth of glioblastomas on soft agar. U87 cells transfected with vector control or NAG-1 expression construct were grown in soft agar and colony formation measured. The expression of NAG-1 inhibited cell growth by approximately 50% (Fig.5D). These finding support the hypothesis that NAG-1 appear to act as a tumor suppressor gene in glioblastomas but is epigenetically silenced in high grade tumors tumors.
DISCUSSION
Gliomas are the most common central nervous system tumor in both adults and children. Although in vivo and in vitro studies have shed new light on the mechanism of tumorigenesis of neuroepithelial tumors, current treatments do not result in an improvement in the very poor prognosis of this disease. However, epigenetic studies have indicated possible strategies for tumor specific and customized therapy 32–35. The restoration of silenced tumor suppressor genes is an attractive therapeutic approach that could result in improvements in prognosis.
In a previous study 27, we have investigated epigenetic modifications, including histone deacetylation and DNA methylation, ultimately identifying the NAG-1 gene as being epigenetically regulated and possibly silenced in gliomas. The histone deacetylase inhibitor, trichostatin A induces NAG-1 expression in several glioma cell lines including T98G cells. Trichostatin A induces apoptosis in T98G cells and the increase in expression of NAG-1 plays an important role in trichostatin A-mediated apoptosis, suggesting histone acetylation regulates the expression of NAG-1. However, 5-AZA-dC did not induce NAG-1 expression in T98G cells suggesting methylation was not important in regulation of NAG-1 expression in these cells. In this report we examined in more detail the methylation status of the NAG-1 promoter in glioblastoma cells and in human glimoma tumors. The promoter region of NAG-1 was poorly methylated in cells that have high basal expression of NAG-1and hypermethylated in cells that have low basal expression of NAG-1. In glioblastoma cell lines, an inverse relationship between the basal expression and promoter hyper-methylation is clearly apparent with hypermethylation observed in the high grade cells. The study of methylation status and basal NAG-1 expression was continued by examination of the basal NAG-1expression and promoter methylation in human glioma samples. In general, we observed a very low basal NAG-1 expression in the tumors and a high level of promoter methylation. 5-AZA-dC induced NAG-1 expression in glioblastoma cell lines with low basal expression of NAG-1 and a highly methylated promoter but was not effective in cells like T98G that have high basal expression and a poorly methylated NAG-1 promoter. Thus we conclude that NAG-1 is epigenetically regulated and silenced in glioblastomas by methylation.
In the human tumors samples the relationship between hypermethylation and basal NAG-1 expression is not as clear. In cell lines where the NAG-1 promoter is extensively methylated, clusters of DNA methylation were identified that correlate with known transcription factor binding sites responsible for the regulation of basal expression. NAG-1 expression is down-regulated in greater than 90% of the tumors. However, hypermethylation at the sites identified in cell lines (the −118 to −53 regions) was not observed in all human glioblastoma samples. Our observation is similar to results reported for methylation of other genes in glioblastoma 36. As previously suggested 36, the decreased levels of methylation observed in tumors versus cell lines may reflect differences in cellularity (tumors have multiple cell types), differences in the signaling environment in vivo versus in culture, or that DNA methylation in cell lines may reflect a growth advantage in culture not evident in tumors.
NAG-1 expression is regulated by several transcriptional factors and by posttranscriptional mechanisms, indicating a diverse regulation by anti-tumorigenic compounds. From our studies on the regulation of NAG-1 expression by tumor prevention drugs reveals NAG-1 as an important downstream target of three tumor suppressor pathways, p53 30, Egr-1 37, and AKT/GSK-3β38. These pathways involve specific sites located in the −133 to +55 region of NAG-1 promoter, which we analyzed for the methylation status. The Egr-1/Sp-1 binding sites (−67 and −53 respectively) regions, are pivotal regulation sites for increasing NAG-1 expression by COX inhibitors, Troglitazone, and TSA. In addition, these sites are critical in the regulation of the basal expression of NAG-1 23. Our current study indicated that Egr-1/Sp-1 binding site was highly methylated in glioblastoma cell lines and primary oligodendroglioma samples which have low basal expression of NAG-1. In addition, our methylation status assay showed that +55 region located close to p53 binding site, was also highly methylated. The p53 sites play an important role in the regulation of NAG-1 expression and are pivotal in induction of NAG-1 expression by dietary compounds, for example DADS and resveratrol 30, 39. Thus, the −128 to −53 region and +55 region of NAG-1 promoter are likely involved in silencing of the tumor suppressor gene in tumorigenesis of glioma.
Methylation of the Egr-1/SP-1 site decreases the basal expression of NAG-1 but also prevents an increase in expression after treatment with sulindac sulfide or TSA. Sulindac sulfide increased NAG-1 expression in T98G cells with a poorly methylated NAG-1 promoter while treatment of U-118 cells that have a highly methylated promoter did not increase NAG-1 expression. After removal of the methyl group by 5-AZA-dC treatment, sulindac sulfide increased NAG-1 expression in the U-118 cells. Although sulindac sulfide increased in both the T98G and U-118 cells the expression of Egr-1, a transcription factor required for the increase in transcriptional activity by sulindac sulfide, the binding of Egr-1 to the promoter site was blocked on the methylated promoter in U-118 cells as determined by the CHIP assay. Thus in glioma hypermethylation of NAG-1 promoter silenced basal expression and blocked drug induced expression, a finding that may provide insight into why gliomas are resistant to many drug therapies.
The role for NAG-1 in development of tumors is highly complex. Studies in a number of tumor cells, colorectal 21, breast 18 and now glioblastoma all indicate the expression of NAG-1 induced apoptosis, inhibited the growth on soft agar and altered the cell cycle. Other studies in nude mice show the expression of NAG-1 inhibits the growth of tumors in xenographs 21. Studies with NAG-1 transgenic mouse expressing the human NAG-1 are resistant to both chemical and genetically induced intestinal tumors 22. Our current studies support the hypothesis that NAG-1 is a potential tumor suppressor gene and results in this investigation confirm that its expression can be regulated by gene hypermethylation in glioblastoma. Further studies are needed to determine whether NAG-1 transgenic mice are resistant to development of glioblastoma and if hypermethylation silences NAG-1 expression in other cancers.
Supplementary Material
Acknowledgment
This research was supported, in part, by the NIH, NIEHS Intramural Research Program.
References
- 1.Mischel PS, Cloughesy TF, Nelson SF. DNA-microarray analysis of brain cancer: molecular classification for therapy. Nature reviews. 2004;5:782–792. doi: 10.1038/nrn1518. [DOI] [PubMed] [Google Scholar]
- 2.Ohgaki H, Kleihues P. Epidemiology and etiology of gliomas. Acta neuropathologica. 2005;109:93–108. doi: 10.1007/s00401-005-0991-y. [DOI] [PubMed] [Google Scholar]
- 3.Ohgaki H, Dessen P, Jourde B, Horstmann S, Nishikawa T, Di Patre PL, Burkhard C, Schuler D, Probst-Hensch NM, Maiorka PC, Baeza N, Pisani P, et al. Genetic pathways to glioblastoma: a population-based study. Cancer research. 2004;64:6892–6899. doi: 10.1158/0008-5472.CAN-04-1337. [DOI] [PubMed] [Google Scholar]
- 4.Watanabe K, Sato K, Biernat W, Tachibana O, von Ammon K, Ogata N, Yonekawa Y, Kleihues P, Ohgaki H. Incidence and timing of p53 mutations during astrocytoma progression in patients with multiple biopsies. Clin Cancer Res. 1997;3:523–530. [PubMed] [Google Scholar]
- 5.Watanabe K, Tachibana O, Sata K, Yonekawa Y, Kleihues P, Ohgaki H. Overexpression of the EGF receptor and p53 mutations are mutually exclusive in the evolution of primary and secondary glioblastomas. Brain pathology (Zurich, Switzerland) 1996;6:217–223. doi: 10.1111/j.1750-3639.1996.tb00848.x. discussion 23–4. [DOI] [PubMed] [Google Scholar]
- 6.Dahia PL. PTEN, a unique tumor suppressor gene. Endocrine-related cancer. 2000;7:115–129. doi: 10.1677/erc.0.0070115. [DOI] [PubMed] [Google Scholar]
- 7.Nakamura M, Sakaki T, Hashimoto H, Nakase H, Ishida E, Shimada K, Konishi N. Frequent alterations of the p14(ARF) and p16(INK4a) genes in primary central nervous system lymphomas. Cancer research. 2001;61:6335–6339. [PubMed] [Google Scholar]
- 8.Nakamura M, Yonekawa Y, Kleihues P, Ohgaki H. Promoter hypermethylation of the RB1 gene in glioblastomas. Laboratory investigation; a journal of technical methods and pathology. 2001;81:77–82. doi: 10.1038/labinvest.3780213. [DOI] [PubMed] [Google Scholar]
- 9.Ohgaki H, Schauble B, zur Hausen A, von Ammon K, Kleihues P. Genetic alterations associated with the evolution and progression of astrocytic brain tumours. Virchows Arch. 1995;427:113–118. doi: 10.1007/BF00196514. [DOI] [PubMed] [Google Scholar]
- 10.Comprehensive genomic characterization defines human glioblastoma genes and core pathways. Nature. 2008;455:1061–1068. doi: 10.1038/nature07385. [DOI] [PMC free article] [PubMed] [Google Scholar]
- 11.Jennings MT, Pietenpol JA. The role of transforming growth factor beta in glioma progression. Journal of neuro-oncology. 1998;36:123–140. doi: 10.1023/a:1005863419880. [DOI] [PubMed] [Google Scholar]
- 12.Naumann U, Maass P, Gleske AK, Aulwurm S, Weller M, Eisele G. Glioma gene therapy with soluble transforming growth factor-beta receptors II and III. International journal of oncology. 2008;33:759–765. [PubMed] [Google Scholar]
- 13.Kondo Y, Issa JP. Epigenetic changes in colorectal cancer. Cancer metastasis reviews. 2004;23:29–39. doi: 10.1023/a:1025806911782. [DOI] [PubMed] [Google Scholar]
- 14.Kim TY, Zhong S, Fields CR, Kim JH, Robertson KD. Epigenomic profiling reveals novel and frequent targets of aberrant DNA methylation-mediated silencing in malignant glioma. Cancer research. 2006;66:7490–7501. doi: 10.1158/0008-5472.CAN-05-4552. [DOI] [PubMed] [Google Scholar]
- 15.Yi JM, Tsai HC, Glockner SC, Lin S, Ohm JE, Easwaran H, James CD, Costello JF, Riggins G, Eberhart CG, Laterra J, Vescovi AL, et al. Abnormal DNA methylation of CD133 in colorectal and glioblastoma tumors. Cancer research. 2008;68:8094–8103. doi: 10.1158/0008-5472.CAN-07-6208. [DOI] [PMC free article] [PubMed] [Google Scholar]
- 16.Tso CL, Freije WA, Day A, Chen Z, Merriman B, Perlina A, Lee Y, Dia EQ, Yoshimoto K, Mischel PS, Liau LM, Cloughesy TF, et al. Distinct transcription profiles of primary and secondary glioblastoma subgroups. Cancer research. 2006;66:159–167. doi: 10.1158/0008-5472.CAN-05-0077. [DOI] [PubMed] [Google Scholar]
- 17.Fairlie WD, Moore AG, Bauskin AR, Russell PK, Zhang HP, Breit SN. MIC-1 is a novel TGF-beta superfamily cytokine associated with macrophage activation. Journal of leukocyte biology. 1999;65:2–5. doi: 10.1002/jlb.65.1.2. [DOI] [PubMed] [Google Scholar]
- 18.Martinez JM, Sali T, Okazaki R, Anna C, Hollingshead M, Hose C, Monks A, Walker NJ, Baek SJ, Eling TE. Drug-induced expression of nonsteroidal anti-inflammatory drug-activated gene/macrophage inhibitory cytokine-1/prostate-derived factor, a putative tumor suppressor, inhibits tumor growth. The Journal of pharmacology and experimental therapeutics. 2006;318:899–906. doi: 10.1124/jpet.105.100081. [DOI] [PubMed] [Google Scholar]
- 19.Schober A, Bottner M, Strelau J, Kinscherf R, Bonaterra GA, Barth M, Schilling L, Fairlie WD, Breit SN, Unsicker K. Expression of growth differentiation factor-15/macrophage inhibitory cytokine-1 (GDF-15/MIC-1) in the perinatal, adult, and injured rat brain. The Journal of comparative neurology. 2001;439:32–45. doi: 10.1002/cne.1333. [DOI] [PubMed] [Google Scholar]
- 20.Welsh JB, Sapinoso LM, Kern SG, Brown DA, Liu T, Bauskin AR, Ward RL, Hawkins NJ, Quinn DI, Russell PJ, Sutherland RL, Breit SN, et al. Large-scale delineation of secreted protein biomarkers overexpressed in cancer tissue and serum. Proceedings of the National Academy of Sciences of the United States of America. 2003;100:3410–3415. doi: 10.1073/pnas.0530278100. [DOI] [PMC free article] [PubMed] [Google Scholar]
- 21.Baek SJ, Kim KS, Nixon JB, Wilson LC, Eling TE. Cyclooxygenase inhibitors regulate the expression of a TGF-beta superfamily member that has proapoptotic and antitumorigenic activities. Molecular pharmacology. 2001;59:901–908. [PubMed] [Google Scholar]
- 22.Baek SJ, Okazaki R, Lee SH, Martinez J, Kim JS, Yamaguchi K, Mishina Y, Martin DW, Shoieb A, McEntee MF, Eling TE. Nonsteroidal anti-inflammatory drug-activated gene-1 over expression in transgenic mice suppresses intestinal neoplasia. Gastroenterology. 2006;131:1553–1560. doi: 10.1053/j.gastro.2006.09.015. [DOI] [PubMed] [Google Scholar]
- 23.Baek SJ, Eling TE. Changes in gene expression contribute to cancer prevention by COX inhibitors. Progress in lipid research. 2006;45:1–16. doi: 10.1016/j.plipres.2005.10.001. [DOI] [PubMed] [Google Scholar]
- 24.Strelau J, Sullivan A, Bottner M, Lingor P, Falkenstein E, Suter-Crazzolara C, Galter D, Jaszai J, Krieglstein K, Unsicker K. Growth/differentiation factor-15/macrophage inhibitory cytokine-1 is a novel trophic factor for midbrain dopaminergic neurons in vivo. J Neurosci. 2000;20:8597–8603. doi: 10.1523/JNEUROSCI.20-23-08597.2000. [DOI] [PMC free article] [PubMed] [Google Scholar]
- 25.Koopmann J, Buckhaults P, Brown DA, Zahurak ML, Sato N, Fukushima N, Sokoll LJ, Chan DW, Yeo CJ, Hruban RH, Breit SN, Kinzler KW, et al. Serum macrophage inhibitory cytokine 1 as a marker of pancreatic and other periampullary cancers. Clin Cancer Res. 2004;10:2386–2392. doi: 10.1158/1078-0432.ccr-03-0165. [DOI] [PubMed] [Google Scholar]
- 26.Liu T, Bauskin AR, Zaunders J, Brown DA, Pankhurst S, Russell PJ, Breit SN. Macrophage inhibitory cytokine 1 reduces cell adhesion and induces apoptosis in prostate cancer cells. Cancer research. 2003;63:5034–5040. [PubMed] [Google Scholar]
- 27.Yoshioka H, Kamitani H, Watanabe T, Eling TE. Nonsteroidal anti-inflammatory drug-activated gene (NAG-1/GDF15) expression is increased by the histone deacetylase inhibitor trichostatin A. The Journal of biological chemistry. 2008;283:33129–33137. doi: 10.1074/jbc.M805248200. [DOI] [PMC free article] [PubMed] [Google Scholar]
- 28.Strelau J, Schmeer C, Peterziel H, Sackmann T, Herold-Mende C, Steiner H, Weller M, Unsicker K. Expression and putative functions of GDF-15, a member of the TGF-beta superfamily, in human glioma and glioblastoma cell lines. Cancer letters. 2008;270:30–39. doi: 10.1016/j.canlet.2008.04.042. [DOI] [PubMed] [Google Scholar]
- 29.Noushmehr H, Weisenberger DJ, Diefes K, Phillips HS, Pujara K, Berman BP, Pan F, Pelloski CE, Sulman EP, Bhat KP, Verhaak RG, Hoadley KA, et al. Identification of a CpG island methylator phenotype that defines a distinct subgroup of glioma. Cancer Cell. 2010;17:510–522. doi: 10.1016/j.ccr.2010.03.017. [DOI] [PMC free article] [PubMed] [Google Scholar]
- 30.Baek SJ, Wilson LC, Eling TE. Resveratrol enhances the expression of non-steroidal anti-inflammatory drug-activated gene (NAG-1) by increasing the expression of p53. Carcinogenesis. 2002;23:425–434. doi: 10.1093/carcin/23.3.425. [DOI] [PubMed] [Google Scholar]
- 31.Jones PA, Baylin SB. The fundamental role of epigenetic events in cancer. Nat Rev Genet. 2002;3:415–428. doi: 10.1038/nrg816. [DOI] [PubMed] [Google Scholar]
- 32.Grothey A, Ellis LM. Targeting angiogenesis driven by vascular endothelial growth factors using antibody-based therapies. Cancer journal (Sudbury, Mass. 2008;14:170–177. doi: 10.1097/PPO.0b013e318178d9de. [DOI] [PubMed] [Google Scholar]
- 33.Maity A, Bernhard EJ. Modulating tumor vasculature through signaling inhibition to improve cytotoxic therapy. Cancer research. 2010;70:2141–2415. doi: 10.1158/0008-5472.CAN-09-3615. [DOI] [PMC free article] [PubMed] [Google Scholar]
- 34.Rath P, Shi H, Maruniak JA, Litofsky NS, Maria BL, Kirk MD. Stem cells as vectors to deliver HSV/tk gene therapy for malignant gliomas. Current stem cell research & therapy. 2009;4:44–49. doi: 10.2174/157488809787169138. [DOI] [PMC free article] [PubMed] [Google Scholar]
- 35.Witt O, Schweigerer L, Driever PH, Wolff J, Pekrun A. Valproic acid treatment of glioblastoma multiforme in a child. Pediatric blood & cancer. 2004;43:181. doi: 10.1002/pbc.20083. [DOI] [PubMed] [Google Scholar]
- 36.Stone AR, Bobo W, Brat DJ, Devi NS, Van Meir EG, Vertino PM. Aberrant methylation and down-regulation of TMS1/ASC in human glioblastoma. The American journal of pathology. 2004;165:1151–1161. doi: 10.1016/S0002-9440(10)63376-7. [DOI] [PMC free article] [PubMed] [Google Scholar]
- 37.Baek SJ, Kim JS, Nixon JB, DiAugustine RP, Eling TE. Expression of NAG-1, a transforming growth factor-beta superfamily member, by troglitazone requires the early growth response gene EGR-1. The Journal of biological chemistry. 2004;279:6883–6892. doi: 10.1074/jbc.M305295200. [DOI] [PubMed] [Google Scholar]
- 38.Yamaguchi K, Lee SH, Eling TE, Baek SJ. Identification of nonsteroidal anti-inflammatory drug-activated gene (NAG-1) as a novel downstream target of phosphatidylinositol 3-kinase/AKT/GSK-3beta pathway. The Journal of biological chemistry. 2004;279:49617–49623. doi: 10.1074/jbc.M408796200. [DOI] [PubMed] [Google Scholar]
- 39.Bottone FG, Jr, Baek SJ, Nixon JB, Eling TE. Diallyl disulfide (DADS) induces the antitumorigenic NSAID-activated gene (NAG-1) by a p53-dependent mechanism in human colorectal HCT 116 cells. The Journal of nutrition. 2002;132:773–778. doi: 10.1093/jn/132.4.773. [DOI] [PubMed] [Google Scholar]
Associated Data
This section collects any data citations, data availability statements, or supplementary materials included in this article.