Abstract
This article provides an introduction to Fourier transform-based mass spectrometry. The key performance characteristics of Fourier transform-based mass spectrometry, mass accuracy and resolution, are presented in the view of how they impact the interpretation of measurements in proteomic applications. The theory and principles of operation of two types of mass analyzer, Fourier transform ion cyclotron resonance and Orbitrap, are described. Major benefits as well as limitations of Fourier transform-based mass spectrometry technology are discussed in the context of practical sample analysis, and illustrated with examples included as figures in this text and in the accompanying slide set. Comparisons highlighting the performance differences between the two mass analyzers are made where deemed useful in assisting the user with choosing the most appropriate technology for an application. Recent developments of these high-performing mass spectrometers are mentioned to provide a future outlook.
Mass spectrometers have been used for a long time in a variety of biological applications. Recent years, however, have witnessed a significant increase in the employment of mass spectrometers such as of time-of-flight, Fourier transform ion cyclotron resonance (FTICR)1, and Orbitrap, which provide accurate mass of analytes over wide mass range. The FTICR and Orbitrap analyzers outperform any other commonly used mass spectrometer with respect to the maximum mass resolution and accuracy routinely achievable even for small numbers of ions. Both these mass spectrometers share certain features, such as an image current detection system and the application of Fourier transform mathematical operations for generating mass spectra from time domain transients produced by the image current. Consequently, they are often referred to as Fourier transform-based mass spectrometers (FTMS).
The combination of FTMS with ion preselection and fragmentation devices and their coupling to reversed-phase liquid chromatography (LC) represents a ubiquitous approach to both small molecule and proteomic analyses. Multidimensional LC separations have an important role to play in proteomics applications for reducing sample complexity, and complement well the high dynamic range of detection in an acquisition offered by FTMS instruments.
The current article does not intend to be an exhaustive review paper on FTMS techniques; it is intended as teaching material for scientists without a physics background to assist them with understanding the mass spectrometry tools they are called to use in their everyday laboratory work. Thus, only the fundamental aspects of FTMS which are useful to a nonphysicist are introduced. The discussion then focuses on examples of where this technology can be applied and what are the benefits as well as limitations of this technology for practical proteomic applications.
Need for High Resolution and Mass Accuracy
The mass accuracy is the ratio of the m/z measurement error to the true m/z, usually quoted in parts per million (ppm). The mass resolving power (resolution) is the measure of the ability to distinguish two peaks of slightly different m/z, herein understood as full width at half maximum (FWHM). Linearity of detection and very high fidelity in the determination of frequency are inherent to FTMS and allow very high resolving power, mass accuracy, and dynamic range to be achieved. But why would one need high mass accuracy and high resolution?
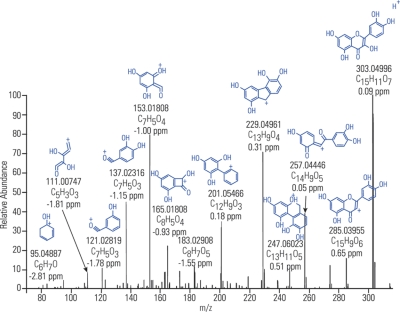
The benefit of measuring a compound's mass with adequately high accuracy can directly determine its elemental composition. Accurate mass thus acts as a powerful “filter” useful for confirming the identity of a compound or even identification of an unknown. This is illustrated in Fig. 1 showing the fragmentation (tandem mass spectrometry (MS/MS)) spectrum of flavonoid quercetin (m/z 303). Mass deviation of less than 3 ppm for any detected fragment together with the richness of the fragmentation spectra itself enable confirming the elemental composition of the starting compound as well as providing useful hints to its structure.
Fig. 1.
Fragmentation (MS/MS) spectrum of flavonoid quercetin (m/z 303). Mass deviation of less than 3 ppm for any detected fragment together with the richness of the fragmentation spectra itself enable confirming the elemental composition of the starting compound as well as providing useful hints to its structure. Assignment of the peaks performed using software package Mass FrontierTM.
In many cases, however, additional information other than just the accurate mass measurement will be needed to obtain correct elemental composition. This includes, among others, restrictions for the number of elements considered, Lewis and Senior chemical rules, or isotopic patterns (1–3). Other aspects of the usefulness of mass accuracy for small molecule analysis include the application of mass defect (4).
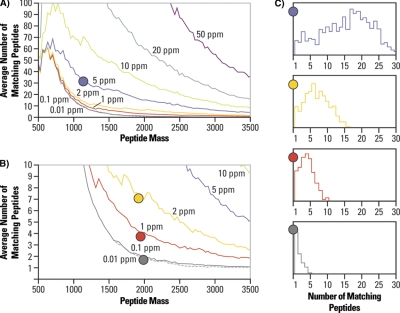
In the context of proteomics the precursor masses are used as constraints for database searches. Fig. 2 illustrates this on the example of human protein database (provided by D. Fenyo). It shows how many peptides would match a database search based on the accurate mass of the peptide alone, considering mass deviations of 50, 20, 10, 5, 1, 0.1, and 0.01 ppm, respectively. From the inspection of Figs. 2A and 2B it is clear that with an improved mass accuracy (lower mass deviation) the number of possible peptide candidates drops significantly. The accurate mass acts as a “filter” that is reflected in later statistical evaluations of the results through a significant reduction in the number of potential false positive identifications, thus resulting in a higher confidence for peptide identification.
Fig. 2.
Effect of mass accuracy on peptide identification, an example of tryptic peptides from a human protein database. A, Graph shows how many peptides would match a search criterion based on the accurate mass of the peptide alone, considering mass deviation of 50, 20, 10, 5, 1, 0.1, and 0.01 ppm, respectively. B, Detail of graph A. Slicing the analyzed mass range into bins with a width corresponding to the respective mass deviation and counting number of peptide hits in each such bin reveals that even with a really low mass deviation one would still encounter many bins with more than 1 peptide in it. C, Histograms for mass bin width of 5, 2, 1 and 0.1 ppm, respectively, where number of peptide matches in a bin is on the x axis and the frequency of an occurrence on the y axis. Courtesy of David Fenyo, Rockefeller University.
The other observation that can be made from Fig. 2 is that even with a very low mass deviation of 0.1 or 0.01 ppm (at present not attainable on any routinely used mass spectrometer) one will still encounter many cases in the human database in which more than one peptide will fit into the bin of a selected peptide mass plus or minus its respective mass deviation. This is summarized in the histograms in Fig. 2C wherein the x axis shows the number of peptide matches in a bin whereas the y axis denotes the frequency of occurrence. Thus, for a tolerance of ±5 ppm one can observe that a majority of peptide mass bins will have more than one peptide in it, whereas for a tolerance of ± 0.1 ppm a large proportion of peptide mass bins contain only one peptide. (Note: this calculation does not consider peptide modifications that would add a large number of candidates.) A significant proportion of peptide mass bins, however, still have more than one peptide. Thus, other information is needed to support peptide identification than just its accurately measured mass.
The mass accuracy is therefore a very important parameter in proteomics experiments; incorrect determination of mass can lead either to identification statistics that are worse than they need to be if the mass accuracy window for a database search is set too wide, or to missed identification (false negatives) if the window is set too narrow (5).
It is perhaps less obvious what the role of resolution is, and how resolution and accurate mass “play together.” High resolution is needed because one can not perform mass measurement or quantitation of a peak accurately if the constituent components remain insufficiently resolved. In this context, the resolution settings used in the analysis define a confidence interval (mass tolerance) within which we can trust our mass measurements. Table I illustrates this point considering an example of a pesticide Pirimicarb (m/z 239). Analysis performed at resolution 15,000 (FWHM) defines a confidence interval for mass measurement as ±9 mmu, while using 80,000 resolution narrows this interval to ±1.7 mmu.
Table I. Effect of mass resolution on the confidence interval of mass accuracy (mass tolerance). Example of pesticide Pirimicarb (C11H18N4O2; [M+H]+ = 239.15025) illustrating how the mass tolerance can limit the number of elemental composition suggestions, and hence greatly assist a compound identification. Resolution 15,000 and 80,000 (FWHM) and CHNO elements considered in this example.
| Resolution | Mass tolerance (mmu) | Number of elemental composition suggestions |
|---|---|---|
| 15,000 | +/− 9 | 14 |
| 80,000 | +/− 1.7 | 1 |
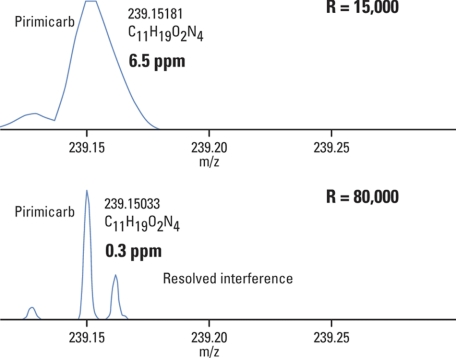
The reasoning behind this is that in a complex mixture many matrix components and other analytes could co-elute with the compound of interest, and some of them could have a very similar mass. The overlap of such co-eluting peaks of a very similar mass will skew the peak shape of our compound of interest, and the peak centroid will no longer correspond to its accurate mass. This is shown with the example of Pirimicarb mixed with 115 other pesticides and toxins into a horse feed matrix (Fig. 3). The top panel shows a mass spectrum taken at the time of the elution of Pirimicarb acquired at resolving power 15,000 (FWHM). In this particular case, the unresolved interferences are causing the measured mass of Pirimicarb to be skewed toward a slightly higher value resulting in a mass deviation of 6.5 ppm. Acquiring data at higher resolution, a much improved accuracy of mass measurement (0.3 ppm mass deviation) is achieved.
Fig. 3.
High resolution results in better mass accuracy. Pesticide Pirimicarb was measured in a mixture of other 115 pesticides and food toxins in a horse feed matrix. Top panel shows a mass spectrum taken at the time of the elution of Pirimicarb acquired at resolving power 15,000 FWHM. The unresolved interferences caused the measured mass of Pirimicarb to be skewed toward a slightly higher value resulting in a mass deviation of 6.5 ppm. The same sample was then acquired at resolution 80,000 FWHM (bottom panel). This resulted in improved accuracy of both mass measurement (0.3 ppm mass deviation) and quantitation. Courtesy of Markus Kellmann, Thermo Fisher Scientific.
The above mentioned effect of resolution limiting the achievable mass accuracy has very important consequences for screening and quantitation experiments. If, for instance, the extraction window is set too wide, compensating for possible matrix interferences and/or inadequate resolving power, then 1) mass accuracy will be compromised, and 2) hidden interferences will contribute to the integrated peak area detected for the compound of interest. In effect, there is a serious risk of having a case of overquantitation or even of a false positive. If, on the other hand, the user sets an extraction window that is too narrow, the compound showing a higher mass deviation than expected because of the presence of an unresolved interference could go completely undetected. There is a risk of a false negative.
In summary, for a given sample analyzed, the resolving power is a key parameter affecting the correct assignment of masses for analytes. The accurate mass measurement can only be relied on when measured at sufficiently high resolution. In the analysis of complex mixtures the resolution impacts the reliability of a compound's detection and quantitation. In biomarker discovery studies, better mass accuracy translates into improved alignment and quantitation across spectra (6).
Fourier Transform Mass Spectrometry
Fourier Transform
The roots of the Fourier transform (FT) are found in a Fourier series in which complicated periodic functions are written as the sum of simple waves mathematically represented by sines and cosines. Because of the properties of sine and cosine it is possible to recover the contribution of each wave in the sum by an integral.
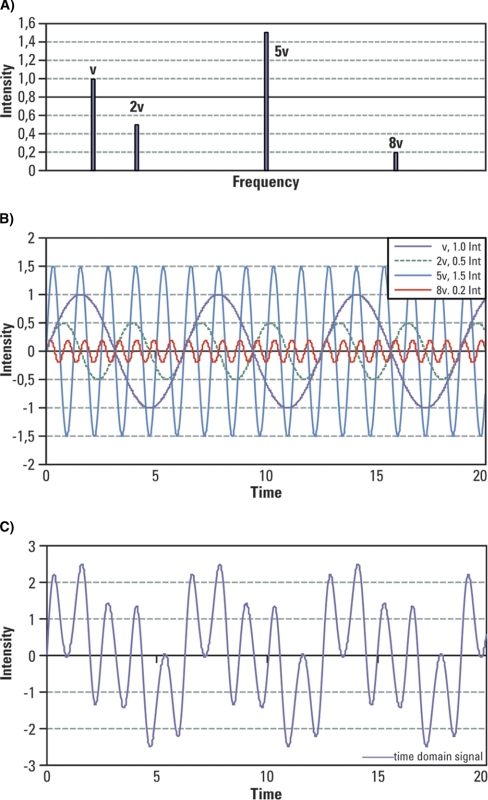
In FTMS, masses are represented by frequencies, and because frequencies can be measured very accurately, FTMS can offer potentially very high mass measurement accuracy. To illustrate the signal complexity that one encounters in FTMS, consider an example of four frequencies representing four different masses: frequency “v” of an intensity 1, frequency “2v” of an intensity 0.5, frequency “5v” of an intensity 1.5, and frequency “8v” of an intensity 0.2 (Fig. 4A). Their respective waveforms are displayed all together in Fig. 4B. An FTMS detector will see all these four waveforms combined into a signal looking similar to that in Fig. 4C.
Fig. 4.
Illustration of signal complexity encountered in FTMS. A, Four frequencies representing four different masses are considered here: frequency “v” of an intensity 1, frequency “2v” of an intensity 0.5, frequency “5v” of an intensity 1.5, and frequency “8v” of an intensity 0.2. B, Displayed waveforms for the considered intensities and frequencies. C, All four waveforms combined into a signal emulating the time domain signal detected by an FTMS.
Real sample analysis is, however, a far more complicated affair; it is not unusual in a proteomic experiment to have hundreds or even thousands of molecular species present in a single mass spectrum. In addition, each molecular species has also its isotopomers. The complexity of the resulting signal being detected thus is considerable.
Time Domain Signal
In FTMS the ions are observed (image current is induced on detection electrodes, digitized, and recorded into a file) over a period of time potentially extending up to several seconds. This time domain signal containing all the characteristic frequencies of the measured ions at intensities corresponding to the amount of the molecular species in the sample is treated with the mathematical tool of the Fourier transform.
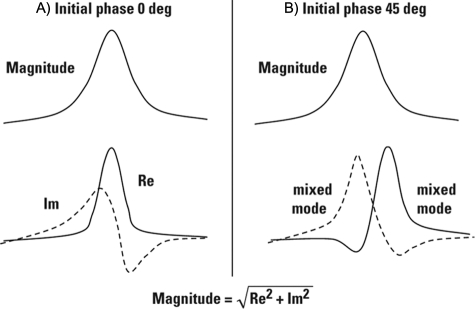
The Fourier transform operation converts the time domain signal into a complex (in the mathematical sense, i.e. containing a real and an imaginary part) spectrum. When the phase is zero the real part of the frequency domain spectrum shows what we call an absorption mode line, and in the case of the exponentially decaying signal it is known as absorption mode Lorentzian. The imaginary part of the spectrum gives a line shape known as the dispersion mode Lorentzian, which is broader than the absorption mode and also has positive and negative parts. This occurs only when the phase shift of the time domain signal is zero. Fig. 5 illustrates the real and imaginary parts of the solution with their position and height being phase dependent.
Fig. 5.
Phase dependence of the real and imaginary part of Fourier transform solution. A, At initial time phase equal to zero, the real and imaginary part of the complex (real and imaginary) frequency spectrum represents the pure absorption and dispersion mode spectrum, respectively. B, For any other initial time domain phase, the complex (real and imaginary) components represent a linear combination of absorption and dispersion modes, and the resulting peak shapes are asymmetric. Employing a ”magnitude spectrum” removes the initial time domain phase dependence with a penalty of obtaining a spectrum with only half the resolution achievable for that particular data.
To eliminate this phase dependence, a square root of the sum of the square of the real and imaginary parts is used, known as the “magnitude spectrum”
The drawback is that the magnitude spectrum has only about half the resolution obtainable from that particular data (Fig. 5).
Attempts have been made to control or determine the phase of the ion motion, and the topic is further developed in the Section Improving the Performance Characteristics of FTMS.
Further Signal Processing
In most proteomics applications, where dynamic range within the spectrum is of importance, further signal processing needs to be carried out, namely apodization and zero-filling.
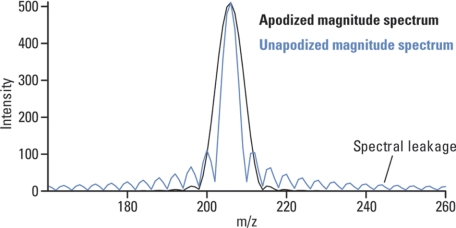
Apodization, literally meaning “removing the foot,” is a transformation of transient to smooth the discontinuities at its beginning and end. It is used to remove artifact peaks adjacent to real peaks at the base of the spectrum (Fig. 6).
Fig. 6.
Example of apodized and nonapodized simulated spectral peak. Whereas apodization improves dynamic range and appearance of FTMS spectra, it impacts negatively on its resolution. Courtesy of R. Malek, Thermo Fisher Scientific.
To transform the time domain signal (detected by FTMS and digitized) accurately into its constituent frequencies, long periods of observation (long transients) are required. In practice, however, transients can not be very long (limited to a maximum of several seconds) because of time restrictions (e.g. eluting chromatographic peaks) or, more importantly, because of the loss of signal caused by collisions of the ions under observation with residual gas. Such finite observation intervals cause the appearance of artifact peaks (spectral leakage) after the Fourier transform. Weighing functions, referred to as windows, are thus applied to the data to reduce these artifact peaks. The most commonly used window in FTMS is the “raised cosine” from Hann apodization, which has the advantage of low aliasing.
By removing the small artifact peaks from the spectrum the apodized spectra allow for a higher dynamic range. This comes for a price; the resolution of an apodized spectrum is about half the resolution of a nonapodized one. Please note that the performance characteristics of FTICR quoted in the literature are often given for a nonapodized spectrum whereas quotations of the Orbitrap performance always refer to an apodized one.
Zero-filling is another treatment of the spectrum, which corresponds to adding zero-filled interval to the transient. It enables easier interpolation between points in the frequency domain, and therefore results in an improved peak shape.
Fourier Transform Ion Cyclotron Resonance
Principle of Operation
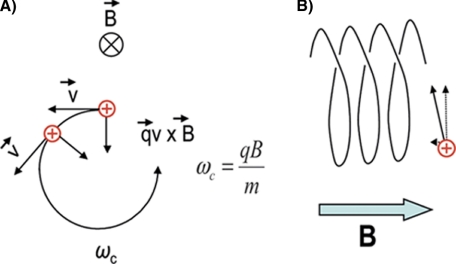
A charged particle in a magnetic field with a velocity vector perpendicular to the magnetic field experiences a force perpendicular to the plane defined by the velocity and the magnetic field. This force, which is known as the “Lorentz force,” induces a change in the direction of the velocity vector but not in its magnitude (Fig. 7A). This force is always perpendicular to the direction of the velocity vector. Following the vector of velocity we see that it describes a circle and as a result the charged particle (an ion) is trapped by the magnetic field on a circular trajectory. The frequency of this rotation is characteristic for each mass and magnetic field, and in a uniform magnetic field it is not dependent on initial coordinates and velocities of ions.
Fig. 7.
Ion motion within an ICR cell. A, Force affecting a charged particle moving in the homogeneous magnetic field causes the particle to assume circular trajectory. B, As the magnetic field can confine the ions only in the radial direction, no confinement exists in the axial direction along the magnetic field.
An instrument in which ions are excited to a larger trajectory in the presence of the magnetic field is called an “ion cyclotron resonance” (ICR) mass spectrometer. The theory of cyclotron resonance was developed by Lawrence in the 1930s and awarded the Nobel prize in 1939. Other designs followed producing instruments that were used principally to study ion-molecule reactions (7). The Fourier transform, introduced by Comisarow and Marshall in 1974, offers the crucial advantage of detecting all frequencies simultaneously rather than detecting one frequency at a time (8).
Ion Motion Inside the ICR Cell
The angular cyclotron frequency on an FTICR that consists of two infinite parallel electrodes and contains only a magnetic field is described by
 |
and one revolution is equal to 2π radian
wherein “ν“ is the frequency of revolutions measured in Hz, “ωc” is the angular frequency in radian/second, “q” is the ion charge, “m” the mass, and “B” the strength of the magnetic field. This formula shows that there is an inversely proportional dependence between m/q and the observed orbital frequency.
The magnetic field alone can confine the ions only in the radial direction and no confinement exists in the axial direction along the magnetic field (Fig. 7B). Static electric fields with potential wells on the order of a few volts are used to confine the ions in the axial direction, and the ions start executing a harmonic trapping oscillation between the two electrodes at a trapping frequency
 |
wherein “Vtrap” is the trapping potential in the axial direction, “α” is a value characteristic of the trap geometry (2.77 for a cubic (9), 2.84 for a cylindrical (10, 11), and 3.87 for an open trap (12)) and “a” is the trapping electrode separation. The interference of this field with the cyclotron motion of the ions produces deviations from the unperturbed cyclotron motion and as a result lowers the frequency to
 |
As the deviation from the unperturbed cyclotron frequency depends strongly on the trapping potential, trapping voltages as low as possible are used.
Finally, there is also a low frequency precession motion known as “magnetron” described by
 |
The magnetron and trapping frequencies are usually much lower than the cyclotron frequency. They are generally not detected unless there is a small misalignment of the instrument axis with the magnetic field, or the ion motion amplitude is so large that it becomes comparable with the dimension of the ICR cell. Then they demonstrate themselves as small sidebands of the peaks in the spectrum.
In conclusion, ions should enter the ICR cell at low kinetic energies so that they can be confined by relatively low trapping potentials, and they should be located preferably in the center of the cell to take full advantage of the excitation conditions and the cell dimensions.
Excitation of Ions in the ICR Cell
Because of the kinetic energy of the thermal motion, ions will have some very small cyclotron motion even at room temperature and without any excitation. Such conditions, however, do not generate a detectable image current on the detection plates. Ions need to be coherently excited to a larger radius for a signal to be detected. The ions will remain at this radius after the excitation signal has been stopped until their energy is dissipated by collisions with residual gas. This together with dephasing of ion coherence, in which ions of the same cyclotron frequency become distributed out of phase at the same cyclotron radius, limits the extent of detection time. The larger the size of the molecule and the higher the residual gas pressure inside the ICR cell, the shorter is the time available for detection.
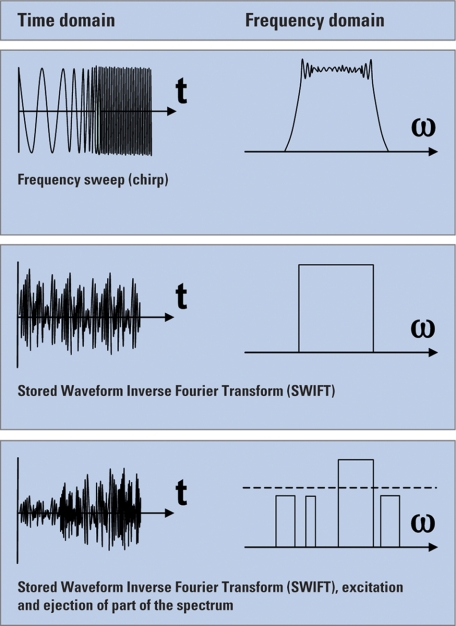
All masses should receive a similar excitation to avoid mass dependent detection conditions. A radiofrequency (RF) potential is normally applied to a pair of excitation plates on opposite sides of the ICR cell. In FTICR, instead of exciting and detecting one mass (frequency) at a time, a whole range of m/z is excited simultaneously by usually applying one of the following techniques (Fig. 8).
Fig. 8.
Techniques applied in FTICR to excite a whole range of m/z simultaneously.
Frequency sweep (chirp) excitation rapidly scans the frequency range corresponding to the masses that need to be excited (13, 14). A wide m/z range can be excited and a reasonably flat response can be achieved. However, shoulders remain at each end of the excitation range.
Because Fourier transforms work also in reverse, another way to produce an excitation waveform is to consider the masses or ranges of masses that need to be excited, and carry out an inverse Fourier transform from the frequency domain to the time domain. The corresponding transformation can be recorded and played back for excitation. This is known as stored waveform inverse Fourier transform (SWIFT) (15). This method offers a good excitation response. In addition, unwanted masses can be completely ejected from the cell during this step. SWIFT waveforms can also be used for ion isolation before MS/MS analysis in the ICR cell, as demonstrated for a single isotopomer of ubiquitin (8.6 kDa) and carbonic anhydrase (29 kDa) (16). Another example was an analysis of intact bovine histone H4 in which a mass selectivity of 0.1 m/z unit for isolation of the 18+ charge state was achieved (17).
Mass Calibration
As mentioned earlier, the trapping potentials change the ICR's intrinsically simple mass to frequency relationship (equation (2)) to a more complicated form (18)
 |
wherein “A” and “B” are constants that can be obtained by fitting a set of experimental frequencies to m/z values. Addition of more parameters into the equation does not improve significantly the outcome (19).
The limiting condition for which the above equation is valid is that the space charge should be negligible, i.e. a very small number of ions should be present. Nevertheless, the field perturbations affect both the calibrant and the ions, and this equation can be extended also for large numbers of ions as long as their number in the FTICR cell is always kept the same. For this reason, FTICR mass spectrometers that have automatic control of the number of ions being injected into the ICR cell have a clear advantage (20). This is especially important in proteomic experiments, in which the FTICR instrument is often coupled to an LC, and the number of ions can fluctuate dramatically from spectrum to spectrum.
Issues Due to Electrical Field
Both the electrostatic fields (i.e. the trapping voltage) as well as RF fields used for excitation can create problems for mass analysis, and uniformity of both these types of field is called for. Various solutions have been proposed to deal with the axial trapping field (21, 22). In the late 1980s, Wang and Marshall used a grounded mesh just in front of the axial trapping electrodes (23). In this case, the trapping field penetrating through the grid can have an effect only when the ions get very close to the trapping electrodes.
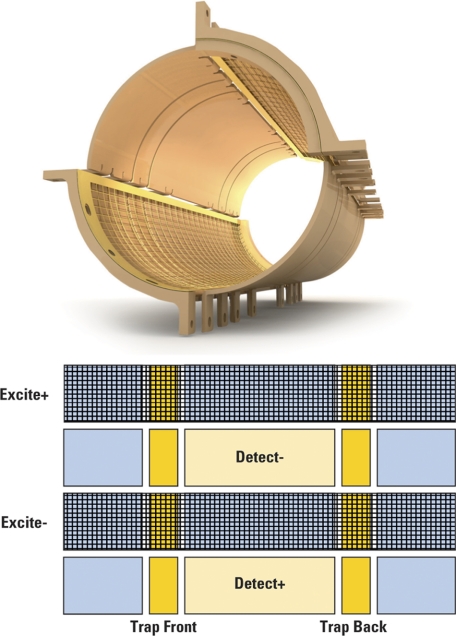
The simple approach of using a grid on an open-ended ICR resolves the problem with homogeneity of the excitation field as well. The grids are placed inside the cylindrical electrodes over the entire length of the ICR cell. The excitation waveforms are supplied to these grids so that the excitation field extends well past the trapping region. The trapping rings are segmented into four sections because the potentials applied to the segment behind the grids has to be 4.6-fold higher than those applied to the grid-free segments to establish the same trapping potential (Fig. 9).
Fig. 9.
Grid cell used to minimize the excitation field perturbations. Graphical rendering of the ICR cell of the LTQ FT Ultra instrument depicting the grids placed inside the cylindrical electrodes over the entire length of the ICR cell. The excitation waveforms are supplied to these grids so that the excitation field extends well past the trapping region. The trapping rings are segmented because the potentials applied to the segment behind the grids have to be 4.6-fold higher than those applied to the grid-free segments in order to establish the same trapping potential.
The introduction of the “grid cell” is an interesting proposition also from the perspective of mass accuracy achievable on the instrument. Going back to the mass calibration formula (equation (7) in Section Mass Calibration) and taking into account that the parameter B therein relates to the electric field errors, it can be seen that the electric field causes an error ΔB of the calibration electric field-dependent parameter B resulting in a mass assignment error Δm. To improve mass accuracy, one either has to reduce ΔB or increase the cyclotron frequency by means of a higher magnetic field. The grid cell reduces ΔB and, consequently, Δm approximately by a factor of 4. If one then realizes that the same effect on Δm could be achieved by exchanging the 7 T magnet for a 14 T one (increasing the cyclotron frequency by a factor of 2), the design employing the grid cell is an elegant solution. There are, nevertheless, also other methods that can be implemented to achieve homogeneity of the excitation field (24–26).
Effect of Magnetic Field on Resolution (High Field Magnets)
The resolution at low pressure is given by (27, 28)
 |
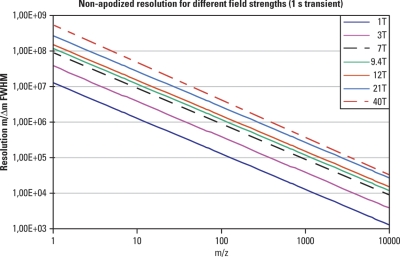
wherein m/z is given in μ per elementary charge. Fig. 10 shows the resolution achievable within a 1 s transient for magnetic field strengths of 1 to 40 T and for different masses. The values in this graph are for a nonapodized spectrum, which means that resolution of an apodized spectrum would drop to about a half (in most cases it is not possible to infer exact values for an apodized spectrum as each manufacturer uses a different apodization algorithm). A detailed discussion of the characteristics and advantages of high field magnets can be found in Marshall et al. (29). Here, we will summarize some of the main points:
Fig. 10.
Effect of magnetic field strength on resolution. Resolution (FWHM) achievable for a range of masses for a 1 s transient employing magnetic field strengths of 1 to 40 T is presented. The resolution shown for FTICR is nonapodized. Please note that both axes are logarithmic.
a) Mass resolving power and mass accuracy
The formula (8) above shows clearly that resolving power (m/Δm) will increase linearly with increasing magnetic field (Fig. 10). Higher mass accuracy can be achieved as a consequence of increased resolving power.
b) Data acquisition speed
The same formula also shows that the time needed to acquire a time domain signal of a given mass resolving power varies as 1/B. This can represent a considerable gain in time. On some instrument designs this benefit might not make a practical difference, however, as some fragmentation techniques performed in the ICR cell require introduction of gas (for fragmentation or axialization). This translates into an added time overhead of extra pumping in order for the instrument to drop back to good vacuum levels before ion excitation and detection.
c) Kinetic energy
Higher maximum ion kinetic energy for a given excitation radius can be achieved with higher magnetic fields. High kinetic energy would be useful for collision-induced dissociation (CID). For example, in a 3 T magnet using argon as a collision gas, an ion of 1000 Da at 1 cm excitation radius has center of mass kinetic energy of 1.67 eV, whereas in a 9.4 T magnet it would have 16.4 eV. This would translate to a more effective fragmentation. But as mentioned already, to carry out CID in the ICR cell, gas has to be admitted and the pressure has to be raised. To resume analysis afterward, enough time needs to be allowed for the gas to be dissipated and the ICR cell to return to the low pressure required for excitation and detection. It is much more practical to carry out CID outside of the ultra-high vacuum region in an external analyzer or collision cell.
d) Ion trapping duration
In the presence of collisions with residual gas in the ICR cell the ions lose kinetic energy. This means that the cyclotron radius decreases rapidly with time, and simultaneously, the magnetron radius slowly increases. The motion of ions becomes unstable when magnetron radius happens to be significant in comparison to the cell radius. The longer it takes for this to happen, the longer the time domain transient that can be achieved, and the higher the subsequent resolution. Employing higher magnetic field strength is advantageous as the time required for the ion magnetron radius to expand to the radius of the ICR cell increases in a quadratic dependence with B.
Another mechanism for ion loss in ICR is dephasing. Ions within the cloud of the same m/z value lose their coherence and over time become distributed at different cyclotron phase angles at the same radius. Ion cloud density, columbic interactions with other ion packets, and magnetic field strength are all parameters that can affect dephasing.
e) Charge-related phenomena
In an ICR cell the existence of concentrated charge can be responsible for shifting and broadening mass spectral peaks, sometimes to the extent of merging peaks of similar mass into one. Such an artifact is known as peak coalescence. The tendency of two ion packets to coalesce drops with increasing magnetic field strength. In practice, this (and not just a mere increase in resolution and mass accuracy, which could be achieved by other means as well, for instance by an improved ICR cell design as mentioned in Section Problems with Potential Field) tends to be the main reason one would consider using a bigger magnet having in mind all the negative aspects this brings with it (e.g. considerable increase in cost and handling difficulties).
A different manifestation of charge-related effect can be observed at low numbers of ions (<1000). Ions “evaporate” from the ion packet and a “comet tail” is formed (30). After some time, depending on a particular ICR cell geometry and magnetic field strength, ions of the ion packet spread into a ring with no ability to induce image current on the detection plates. A limit on resolution is thus reached because of a shortened transient duration. The “comet tail” extension rate will diminish at higher magnetic fields due to the decrease in the magnetron frequency which is responsible for this effect.
Effect of Transient Time Duration on Resolution
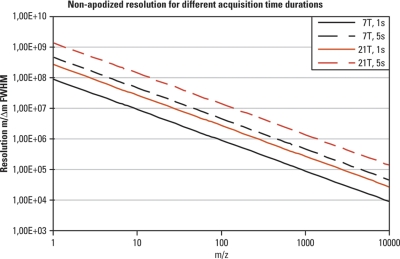
Another way to increase the resolution without using a bigger magnet is to allow for a longer transient acquisition. Fig. 11 compares the resolution achievable with magnets of 7 and 21 T for durations of transients of 1 and 5 s. Of course, there are limits because:
Fig. 11.
Effect of transient duration on resolution. Resolution (FWHM) achievable for a range of masses with magnets of 7 and 21 T and for durations of transients of 1 and 5 s is provided for comparison. The resolution shown for FTICR is nonapodized. Please note that both axes are logarithmic.
a) long acquisition times might not be always practical, particularly in the case of coupling to LC.
b) there is only a limited amount of time the transient can be recorded before it dies out because of collisions with residual gas. Although all mass spectrometers require vacuum for the analysis and detection of ions, the performance of FTMS is more sensitive to pressure than other mass analyzers. Vacuum of 10−9 to 10−10 Torr (1 Torr = 133.3 Pa) is required to achieve high resolution, vacuum requirements being more stringent for higher-field magnets.
Fragmentation in the ICR Cell
The ICR cell is able to confine different masses, excite them to higher kinetic energies, carry out fragmentation experiments, and re-analyze the products. Alternatively, the ions can be allowed to interact at low kinetic energies, preferably thermal, with electrons or photons. This makes the ICR cell a reaction vessel, which, with some added time overhead, can be a tandem mass spectrometer in its own right. Here we mention the three main fragmentation techniques used in the ICR cell, and discuss the advantages and disadvantages of implementing them.
Collisional-induced Dissociation
A technique traditionally used in FTICR is the collision induced dissociation. Ions have to enter the ICR cell at low kinetic energies to be trapped effectively by the trapping potentials being as low as possible. These conditions, however, do not promote any fragmentation. Ions need to be excited to larger radii to gain higher kinetic energy. This excitation can be done resonantly for each mass employing one of the following techniques: multiple excitation collisional activation (MECA) (31) where ions are resonantly excited and then allowed to relax by collisions; very low-energy CID (32), which uses 180° phase shifts in the excitation wave form; or the simplest to implement and at the same time the most robust technique known as sustained off-resonance irradiation (SORI) (33). In SORI, ions of a specific mass are excited by an RF field that is slightly off-resonance with the cyclotron frequency. As a result, ions are alternatively accelerated and decelerated with a period that is reciprocal to the frequency mismatch.
All these methods activate the ions not in a single event but by using multiple collisions. Because collision gas is used in the form of a pulsed valve opening on a millisecond time scale, a delay of several seconds is normally used to allow the gas pressure to drop before resuming FTICR mass analysis. Using activation by gas collisions the ions absorb energy in multiple steps, and because there is enough time for redistribution of this energy in the molecule (a process defined as “ergodic”) the weakest bonds tend to break first. As many post-translational modifications are labile, including phosphorylation, such moieties tend to break first. The fragmentation of a peptide would not proceed any further because the rest of the peptide can not be anymore excited by the original applied excitation frequency (the mass of the peptide has changed by losing the modification moiety and its cyclotron frequency is now different).
Infra-red Multiphoton Dissociation
Another method to deposit energy into the molecules is by photon absorption. Ions have been activated in the ICR cell by using both infrared (34, 35) and ultraviolet (36) photons. Although infrared multiphoton dissociation (IRMPD) was used initially for small molecules, it soon found an application in sequencing biomolecules (37). The fragmentation spectra produced are similar to collision induced dissociation but with the added benefit of not requiring pulses of gas that spoil the vacuum conditions. Another benefit is that the ions start the mass analysis from the center of the ICR cell (thus simplifying excitation and maximizing signal) because they have to be there for a successful interaction with the laser beam. Nevertheless, a few hundred millisecond up to a few second interaction time is required.
Electron Capture Dissociation
Electron capture dissociation (ECD) has recently evolved as an alternate activation method, especially for peptide and protein sequencing. With ECD, multiply charged (usually but not exclusively) cations are irradiated with low energy electrons produced by an emitter cathode placed behind the ICR cell. Electron capture produces a radical cation [M+nH](n−1)+. which can dissociate via a rapid, facile fragmentation of the N-C bond of the peptide chain, producing mainly c and z type fragment ions (38).
ECD has some remarkable advantages as the fragmentation is not directed by peptide bond protonation and shows a nonergodic nature (“nonergodic” means that the process adds internal energy to the precursor faster than is the rate of energy randomization). As a consequence, the fragmentation does not have to happen on the weakest bond within the compound as would be the case with CID or IRMPD techniques. Thus, fragile post-translational modifications within the peptide and protein sequence are preserved.
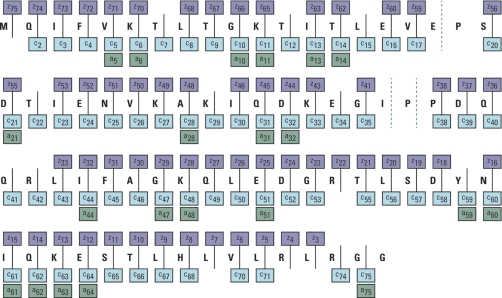
ECD allows site specific analysis of phosphorylation (39, 40), O- and N-linked glycosylation (41), or sulfation (42). ECD holds much promise as a supplementary dissociation technique to CID for unambiguous protein identification, de novo sequencing (43) and detailed protein characterization (44). The method has been shown to distinguish leucine and isoleucine residues (45) and even differentiate between peptides containing a d- or l-amino acid within its sequence (46). ECD had also been applied to intact protein analysis (47) delivering a good level of fragmentation. Fig. 12 depicts sequence coverage of ubiquitin (charge state 12+) obtained with ECD. From the 72 theoretically cleavable peptide bonds (ubiquitin has 75 peptide bonds in total, but the presence of three proline residues means that even after these three peptide bonds had fragmented the opened ring structure of proline holds the respective fragments together) 71 were cleaved obtaining a total of 147 identifiable fragment ions.
Fig. 12.
ECD fragmentation of an intact protein. Charge state 12+ of ubiquitin was fragmented using ECD. From the 72 theoretically cleavable peptide bonds within ubiquitin sequence 71 have been cleaved obtaining 147 fragment ions in total. Courtesy of M. Zeller, Thermo Fisher Scientific.
Summarizing the above, CID and IRMPD induce dissociation by vibrational excitation of the precursor resulting usually in the cleavage of the weakest bond. Within peptides, the backbone amide bond has the lowest energy barrier to dissociation resulting in predominantly b- and y-type fragment ions being formed. Unfortunately, substituents such as many co- and post-translational modifications often have lower energy barriers than those of backbone cleavage. This can result in more complex tandem mass spectra and, potentially, the loss of information on the attachment site of these substituents. In contrast, co- and post-translational modifications are preserved when using ECD fragmentation technique.
Orbitrap Mass Spectrometer
The Orbitrap mass spectrometer was first described in 2000 and has now reached the status of a mainstream mass spectrometry technique. The combination of the Orbitrap mass spectrometer with an external accumulation device such as a linear ion trap enables multiple levels of fragmentation (MSn) for the elucidation of analyte structure and allows coupling with continuous ionization sources such as atmospheric pressure chemical ionization sources, electrospray (ESI) or nanoelectrospray. The analytical performance (mass accuracy and resolution) of the Orbitrap combined with the ease of use and small footprint (benchtop versions are available) can support a wide range of applications from routine compound identification and sequencing, to the analysis of trace-level components in complex mixtures, be it in proteomics, drug metabolism, doping control or detection of food and feed contaminants (48, 49, 50, 51).
Motion of Trapped Ions
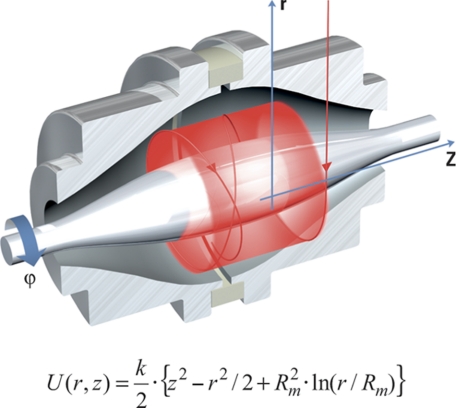
The Orbitrap mass spectrometer consists of a spindle-like central electrode elongated along an axis, kept at high voltage when the ions are being trapped, surrounded by an outer barrel-like electrode kept at ground potential. The outer electrode is split in two halves to form pick-up electrodes for image current detection (Fig. 13). The electrodes are shaped in such a way that the quadro-logarithmic potential distribution is formed with very high accuracy. When ions start their motion at the correct energy and radius, stable trajectories are formed that combine rotation around the central electrode with oscillations along the axis and have a shape of a complicated spiral. It is important to note that axial motion is completely independent of rotational motion.
Fig. 13.
Orbitrap mass analyzer. Ions are captured in a quadro-logarithmic electrostatic field (see the equation insert). An outer electrode enclosing a central spindle electrode consists of two halves separated by a dielectric material. The image current of ions moving as concentric rings along the central electrode (oscillations in axial direction denoted as z in the drawing) is picked up by the outer electrode sections.
The electrodes of the Orbitrap mass spectrometer create an electric field that is inhomogeneous in two directions, radial and axial. First, the radial field Er attracts ions toward the central electrode, this field being stronger near the central electrode. To provide a circular trajectory, the tangential velocity of ions needs to be adjusted to such a value that the centrifugal force compensates the force created by Er Second, the axial field strength Ez is at zero in the equator plane of the Orbitrap analyzer but increases uniformly in opposing directions along the z axis as the two coaxial electrodes become progressively closer. This means that the axial electric field directs the ions toward the equator of the trap with the force proportional to the distance from the equator. It accelerates ions toward the equator and then the ions continue to migrate through the equator (point of zero force) along the z axis, but decelerate as they continue toward the opposite end of the Orbitrap expending the axial velocity previously gained in traversing the electric field gradient from the starting point to the equator. Having “spent” their axial velocity, the ions are accelerated back toward the equator of the trap by the symmetric electric field along the z axis. In this way, the ions oscillate naturally along the z axis in a manner analogous to pulling back a pendulum bob and then releasing it to oscillate. It is this property of the electric field that causes the mass-dependent harmonic oscillation of the ions along the z axis. This oscillation is then combined with a more complicated rotational motion.
Rotational and radial frequencies are strongly dependent on initial energy, position or angle of ions, while the frequency of axial oscillations is completely independent of initial velocities and coordinates of the ions. Therefore, only the frequency of axial oscillations can be used for determination of mass-to-charge ratios m/z:
 |
wherein constant “k” is proportional to the potential difference between the central and the outer electrodes.
Image Current Detection
Axial oscillation frequencies can be directly detected by measuring the image current from the outer Orbitrap electrodes after it has been amplified. A broadband detection is followed by a Fourier transform to convert the recorded time-domain signal into a mass-to-charge spectrum (51, 52).
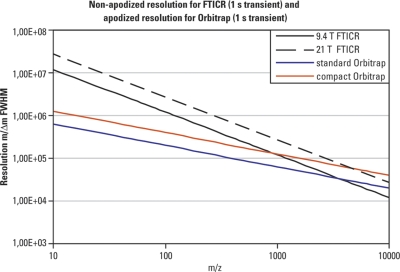
The image current is amplified and processed in a similar way as for FTICR, resulting in comparable sensitivity and signal-to-noise ratio. There is, however, an important distinction between the two FTMS systems; the square-root dependence originating from the electrostatic nature of the field in the Orbitrap analyzer causes a much slower drop in resolving power observed for ions of increased m/z. As a result, the Orbitrap analyzer may theoretically outperform FTICR in this respect for ions above a particular m/z (typically, above m/z 1000–2000) for the same length of time of acquisition. Fig. 14 contrasts the rate of the theoretical resolution drop in the two types of FTMS as the mass of the ions under investigation increases. For that comparison a 1 s acquisition time was used. Please note that the resolution quoted for the FTICR in this figure is nonapodized while the resolution of the Orbitrap is apodized (which means that the apodized resolution for the FTICR would drop to about half of that displayed in this graph).
Fig. 14.
Resolution achievable with FTICR and Orbitrap analyzers. A transient duration of 1 s is considered for FTICR with field strength 9.4 and 21 T, and for two different designs of the Orbitrap analyzer. The resolution shown for FTICR is nonapodized whereas the resolution shown for Orbitrap is apodized. In both types of FTMS the resolution drops with increasing the mass of an analyte. Within experimental settings used in chromatographic applications in proteomics (1 s transient) the Orbitrap system can outperform the FTICR with even very strong magnets for analytes with large m/z.
Sensitivity of image current detection is determined by the internal thermal noise of electronic components of the image current preamplifier. For the best present-day solutions it corresponds experimentally to a limit of detection equal to 5–10 elementary charges for a 1 s acquisition.
It is important to note that for ensembles of ions a nonzero image current can be detected only if ions are moving in-phase with each other. This means that ions of each m/z inside the Orbitrap analyzer should be concentrated in packets that have an axial length shorter than the amplitude of oscillations, i.e. ions should oscillate coherently. Radial and rotational frequencies do not appear in the frequency spectrum precisely because of the fast loss of coherence caused by dependence of these frequencies on the initial parameters of the ions.
Getting the Ions Inside
A very short packet of ions ejected from an RF-only gas filled multipole (known as the C-trap in the current instrument implementations because it is shaped like a letter “C”) enters the Orbitrap analyzer off its plane of symmetry through a tiny hole in one of the outer electrodes. As ions enter they experience an attractive field of the central electrode, which increases very fast with time. This field bends their trajectories into circular arcs. The radii of the arcs become progressively smaller with every microsecond so that ions cannot return to the entrance radius to hit the outer electrode and thus be lost for detection.
The axial component of the electric field is proportional to the distance from the plane of symmetry and so reaches substantial values at the point of entry. It starts to pull all ions toward the plane of symmetry as soon as they enter the field. This initiates axial oscillations without any additional excitation.
Because of the pulsed extraction from the RF multipole, which sends the ions into the Orbitrap, ions of each m/z (ion packet) enter the field practically simultaneously. The axial size of the ion packet remains almost unchanged and good coherence is provided automatically thus fulfilling this important prerequisite for successful image current detection.
After all ion packets across the mass range of interest have entered the field, ramping of the electric field stops, and the potential of the central electrode is stabilized so that no frequency drift can take place during the subsequent image current detection.
Because of the strong dependence of rotational frequencies on ion energies, angles, and initial positions, each ion packet quickly spreads over the angular coordinate and forms a thin rotating ring. The whole ring then oscillates along the central electrode harmonically with frequency dependent only on the m/z of the ions.
The very short time ions stay concentrated before forming the rotating ring means that space charge effects do not have time to develop. Moreover, the existence of the central electrode in the middle of the ring effectively shields one part of the ring from the other. A high space charge capacity can be attained (millions of ions) before unwanted effects on the mass spectrum (i.e. coalescence effects, loss of resolution, and mass accuracy) are observed. In FTICR for comparison, all ions of the same mass remain in one line, and higher field magnets need to be employed to mitigate the space charge effects.
Factors Limiting the Mass Resolving Power
For a commercial Orbitrap analyzer, nominal resolving power (apodized) of 100,000 FWHM at m/z 400 requires 1.07 s detection time. Under ideal conditions, the ions could remain in the analyzer indefinitely, and there would be no limit to the resolution achievable. Unfortunately, collisions with residual gas, as well as minuscule imperfections of the electrode manufacturing limit the time a signal can be detected, and thus the maximum resolving power of the analyzer.
Collisions with residual gas cause a loss of coherence by scattering the ions. First, the loss of ion momentum in collisions causes the coherent ion packet to “diffuse,” thus increasing aberrations and accelerating further “diffusion” due to other factors like field imperfections. Second, collisions can lead to prompt or metastable ion fragmentation, which could also lead to a direct loss of ions if the latter hit an electrode. Both processes are random in time and, therefore, produce noncoherent clouds of ions that cannot be detected by image current detection, even if ions are still stable within the trap. The time between collisions is inversely proportional to the residual pressure inside the trap and to the cross-section of an ion. For a pressure of 10−10 mbar (1 bar = 100 kPa), the time interval between ion and gas collisions ranges from several seconds for small molecules to <1 s for small- and medium-size proteins. One needs to remember that although the time between collisions decreases for larger molecules (i.e. higher collisional cross section) the percentage energy loss per collision is smaller and multiple collisions need to take place for the kinetic energy to be dissipated. By improving the Orbitrap vacuum below this level, isotopic resolution of protein ions up to several tens kDa has been demonstrated (53).
In practice, resolving power achievable over a limited time frame characteristic for LC separations (typically 0.5 or 1 s) rather than the best achievable resolution over an unlimited time frame becomes an important parameter. Resolving power is then limited only by the number of ion oscillations over this time frame, which is proportional to an axial frequency of oscillations. As the axial frequency is inversely proportional to square root of m/z, resolving power over a limited time-frame also diminishes as (m/z)−1/2.
Because of a weak dependence of sensitivity on detection time, Orbitrap analyzers have an important advantage for chromatography: the dynamic range goes down much slower with an increase of repetition rate in comparison to other accurate-mass analyzers (e.g. TOF) (54). In this context it is worth mentioning that the Orbitrap analyzer shows an insignificant trade-off in sensitivity versus resolving power.
Linking the FTMS to Other Mass Spectrometers - Hybrid Systems
Although FTICR is an MS/MS instrument in its own right and can achieve high resolution precursor ion selection—albeit with a time penalty for the isolation-fragmentation-axialization-remeasurement process, and ion intensity penalty for high resolution precursor ion selection—there is a significant advantage when a precursor ion selection device such as a transmitting quadrupole and collision cell or a linear trap quadrupole with MSn capability is used. In the case of the linear trap quadrupole (LTQ) which carries its own detector, MSn experiments at lower resolution can be carried out while the high resolution measurement in the FTICR takes place.
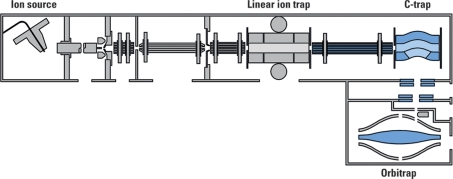
The situation is different for the Orbitrap analyzer. When an ion decays inside the Orbitrap analyzer its fragments will retain the same velocity as the parent ion had. As their energy remains proportional to their individual m/z, their trajectories will become highly elliptical. Most of the fragments (except for those that have m/z similar to that of the parent ion) will hit one of the electrodes and thus be lost for detection. Although there are technological answers to achieving MS/MS capability within the Orbitrap field (51), the first commercial system introduced in 2005 was made by coupling the Orbitrap analyzer to a linear ion trap (LTQ) (Fig. 15). The resulting hybrid MS system has an MSn capability and can use multiple fragmentation methods (CID, higher energy collisional dissociation (HCD), ETD). Another reason the linear ion trap was chosen was because of its high sensitivity, accurate control of the ion population, short cycle time, and high charge capacity (55). A detailed description of the hybrid linear ion trap-Orbitrap instrument (LTQ Orbitrap) performance can be found in Makarov et al. (56).
Fig. 15.
Schematic representation of a hybrid ion trap-Orbitrap mass spectrometer. The main parts of a commercially available hybrid FTMS instrument, the LTQ Orbitrap, are highlighted on the diagram.
Depending on the analysis requirements, the two mass analyzers (the FTMS part and the linear ion trap part of a hybrid instrument) can be used independently or in concert. The MSn spectra recorded by either of the analyzers are very similar, the only major difference being the resolution and mass accuracy of the observed peaks. A true parallel operation is achieved by using the initial part of the transient still being measured in the FTICR/Orbitrap analyzer to define the parent ion masses for the linear ion trap to fragment while the detection of the image current in the FTICR/Orbitrap analyzer continues till the specified final resolution is reached. This parallel mode of operation offers the ability for acquiring multiple MS/MS unit resolution spectra in the linear trap for every high resolution spectrum acquired in the FTICR/Orbitrap, which makes these systems so powerful for analyses of complex mixtures.
Performance Characteristics of FTMS
Mass Accuracy
One of the most coveted attributes of a mass analyzer is undoubtedly its mass accuracy. FTMS can reliably deliver mass accuracy below 1 ppm (54, 57–60). This accomplishment can be aided by exploiting the use of certain ubiquitously present background ions. Precision in peptide mass measurement typically within 100 parts per billion (ppb) have been achieved for many peptides in the LC/MS run without requiring an internal standard. Often, such a result limits the peptide to a single elemental composition and, therefore, represents the highest useful accuracy.
Acquiring tandem mass spectra with a high mass accuracy is an interesting alternative to classical data acquisition schemes where fragment ions are detected at much lower mass accuracy and resolution in the linear ion trap or triple quadrupole. A higher mass accuracy of the detected fragments adds to the specificity of identifications. This makes up for a lower number of MS/MS spectra acquired at high resolution compared with the acquisition on a faster but mere unit resolution instrument such as an ion trap. A much greater degree of confidence is, however, a decisive advantage in the case of peptides with unexpected modifications (61).
Resolving Power
Very high resolution, indeed, can be achieved when long transients are recorded. On a 9.4 T FTICR mass spectrometer, for example, a 5 s transient could yield resolution of 6,000,000 at m/z 100, 600,000 at m/z 1000, or 120,000 at m/z 5000. One has to note that multiply charged intact proteins would mainly appear in the 1000–5000 m/z window; this makes the technique well suited for the study of large protein molecules spurring recent interest in drug discovery (biologicals). The problem is that achieving transients longer than 5 s for large proteins with corresponding large collision cross sections is by no means routine even at the very low pressures required for FTICR.
It might be useful to compare resolution achieved by an FTICR and Orbitrap for various m/z values. Considering a 1 s acquisition time which is fairly typical in proteomics experiments as it matches the chromatographic scale of peptide/protein separations, Table II contrasts the performance of 9.4 T FTICR with that of a standard (56) and a newer compact (62) Orbitrap design. The performance of the Orbitrap analyzer for a species with m/z 1000 matches that of the nonapodized 9.4 T FTICR, and for a species with m/z 5000 it even outperforms it.
Table II. Resolution achievable by FTICR and Orbitrap mass spectrometers for various m/z values considering a 1 second acquisition time. 9.4 T field strength and two different Orbitrap analyzer designs (56, 62) are considered in these calculations. Please note that the values for FTICR are non-apodized while the values for Orbitrap are apodized.
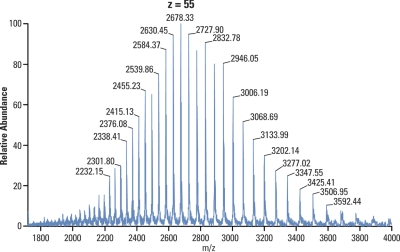
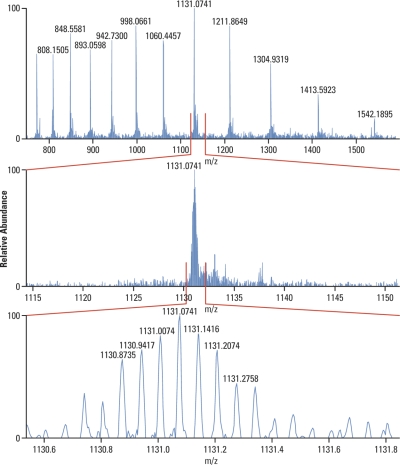
Another challenge related to mass spectrometric detection of large molecules is that each molecular species appears in multiple charge states. Fig. 16 shows a spectrum of a monoclonal antibody (approximate mass 147 kDa) acquired during LC/MS analysis with Orbitrap detection (63). Each peak in the spectrum corresponds to a specific charge state with the one in the middle being charge state +55, with increasing charge states to the left and decreasing to the right thereof. Each charge state consists then of multiple peaks representing adducts, many of them being various cations from salts and buffers, and each of these has in turn a large isotopic distribution (a sort of a Russian doll effect, as illustrated with myoglobin spectrum example in Fig. 17).
Fig. 16.
Spectrum of a monoclonal antibody acquired during an LC/MS analysis with Orbitrap detection. Molecules of immunoglobulin G (approx. 147 kDa) accept a range of different charges during electrospray ionization process, which are then represented as different charge states in the spectrum. The most intense species here carries 55 charges while increasing charge states appear to the left and decreasing to the right thereof. Courtesy of Zhongqi Zhang and Pavel Bondarenko, Amgen.
Fig. 17.
Intact protein analysis with high resolution mass spectrometry. Top panel shows the charge state envelope of myoglobin. A section of the spectrum with a species carrying 15 charges is presented on middle panel, and it is further enlarged to show the individual isotopomers on bottom panel.
All this effectively means that our initial sample signal has split over a very large number of peaks, with subsequent negative impact on apparent sensitivity of detection. This feature is intrinsic to all mass spectrometers using electrospray ionization producing multiple charged ions. It might be pertinent to note that using a matrix assisted laser desorption ionization (MALDI) would not simplify the matter; an FTMS detection of a species with m/z 150,000 (singly charged ions are produced by MALDI) would require an extremely long transient to reach any usable resolution. Employing a time-of-flight (TOF) detector with MALDI source would fare no better because ions would have to be accelerated to many tens of keV for such a massive analyte to produce a measurable signal on the detector (64).
Improving Performance Characteristics of FTMS
Development is focused on obtaining higher resolving power (and hence better mass accuracy) over a fixed acquisition time. One way to achieve this is to increase the frequency of ion oscillations in the analyzer so that more oscillations are sampled for each frequency or mass in the given time transient. For the Orbitrap analyzer, this can be achieved via decreasing the gap between the inner and outer electrodes. This provides higher field strength for a given voltage leading to increased frequency of oscillations. Resolving power in excess of 600,000 at m/z 195 and isotopic resolution of medium-size (approx. 40 kDa) proteins has been reported (65). For FTICR, the impact of larger field strength (a bigger magnet), improved homogeneity of electric fields (both RF and DC) in the ICR cell, effect of the ICR cell design, and a requirement for a far more precise control of the ion population within the ICR cell than for the Orbitrap analyzer (see end of Section Image Current Detection) have been discussed in the Sections Mass Calibration, Problems with Potential Field, Effect of Magnetic Field on Resolution (High Field Magnets), and Effect of Transient Time Duration on Resolution above.
An improvement in resolution almost by a factor of two can result from the implementation of phase correction for FTMS data. Fourier deconvolution-based phase correction consists of a complex division of the time domain ICR signal by the spectrum of the time domain excitation waveform to yield a phased broadband response. The critical requirement for implementing this process is that the detection event must incorporate the excitation interval, and the excitation and detection spectra must be temporarily synchronized.
In practice, this simultaneous excitation and detection is very difficult because of detector saturation. Work in Marshall's lab showed how phase correction in FTICR could be achieved, and magnitude and absorption spectra of electrospray-ionized ubiquitin, [M+10H]10+ (at 9.4 T) derived from the same time-domain data were shown (66). Their approach used a variable capacitor added between each excitation and detection electrode pair, and the resulting bridge was manually tuned so that the coupling of the two opposite-phase components of the differential excitation largely canceled at the preamplifier input. Such “nulling” is increasingly difficult for larger high-field instruments because of greater coupling capacitance of a large cell assembly and the required use of a higher amplitude excitation waveform.
Recently, another approach has been implemented (67). During the frequency sweep when the frequency which corresponds to a particular m/z is reached, these ions become excited. As a result the time between excitation and detection is different for each m/z. The phase of every m/z needs to be calculated:
where ϕi and ωi are the phase angle and excitation frequency, respectively, for a particular m/z, ϕ0 is the initial phase angle, ωe is the frequency at the end of the frequency sweep, and tdelay is the time between the end of the frequency sweep and the detection.
It should be noted that the accumulated cyclotron phase is the sum of the phase accumulation during the frequency sweep plus a temporally increase between the instant of excitation and detection. The final frequency of the frequency sweep, the rate of sweep and the delay between the end of the sweep and the detection can be approximated, and the ϕ0 remains to be estimated by varying it from 0 to 2π in 1 degree increments for each spectrum. The ϕ0 that optimizes the whole spectrum should be chosen rather than the one that optimizes only one peak.
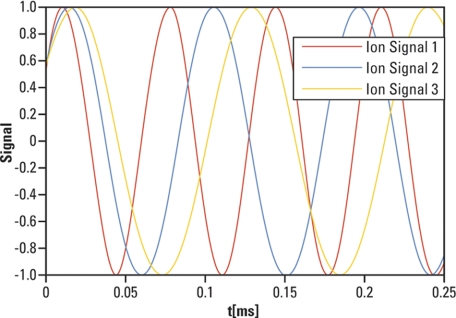
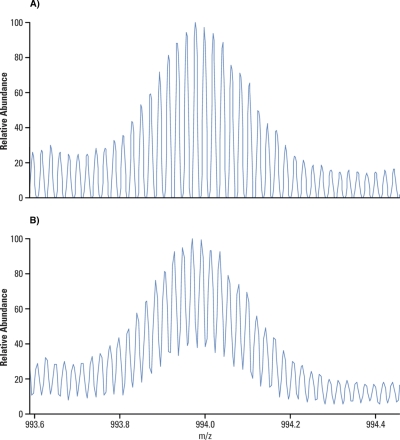
Phase correction is much simpler in the Orbitrap (62) because there is no excitation step and the t = 0 is the time of ejection from the C-trap. The entire injection path is thus equivalent to an extension of axial oscillations “back in time,” as shown in Fig. 18. An improvement in resolution of 1.6–1.7 fold was observed when analyzing charge state 47 of intact yeast enolase (46.64 kDa) using the standard Orbitrap instrument (Fig. 19).
Fig. 18.
Phase correction in the Orbitrap analyzer. Diagram showing three different ion signals (frequencies) that can be traced back to the point in time when they have an identical phase. This “time = 0” corresponds to the time the ions leave the C-trap to enter the Orbitrap field.
Fig. 19.
Resolution improvement using phase correction in the Orbitrap analyzer. Charge state 47+ of intact yeast enolase (46.64 kDa) was detected in the standard Orbitrap analyzer (760 ms transients). A, The phase corrected spectrum shows baseline isotopic separation. B, The same experiment without the phase correction achieves isotopic separation at FWHM. The phase correction results in 1.6- to 1.7-fold improvement in resolution. Both spectra have been through different apodization.
9. Summary
FTMS has become the workhorse of proteomics applications. Introduction of the Orbitrap analyzer and its incorporation into hybrid systems, notable for their ease of use and robustness, has brought the FTMS into the majority of proteomics facilities and independent laboratories. Currently, resolution in the order of millions can be achieved by FT mass spectrometers, namely FTICR, where users tend to utilize long transients. In the proteomic arena, resolving power of 100,000 offered by both types of FTMS instruments within 1 s acquisition time seems to solve the majority of analytical problems. High dynamic range of detection within a spectrum together with the ability to measure accurately the frequencies (and hence masses) even at levels of a few ions makes FTMS instruments very useful for chromatographic applications. Recent developments in Orbitrap commercial instrumentation have yielded benchtop mass spectrometers which can measure wide mass range spectra at high resolution and with minimum supervision.
Increasing frequency of oscillations will enhance performance of both FTMS instruments. Progress is thus expected in the direction of higher field magnets for FTICR, and similarly, stronger electrical fields and/or smaller geometrical size for the Orbitrap analyzer. Considering that the Orbitrap technology is still in its “infancy,” much more is expected from its development. For example, portable high resolution instrumentation or novel geometry hybrid systems are just a few lines of thought to mention.
Acknowledgments
We would like to thank scientists from Thermo Fisher Scientific who provided data, spectra and graphics used in many figures within this article and accompanying slide set, namely Eugen Damoc, Robert Malek, Martin Zeller, and Marcus Kellmann. Many thanks also to David Fenyo, Rockefeller University, USA, Etienne Waelkens, University of Leuven, Belgium, and Pavel Bondarenko and Zhongqi Zhang from Amgen for allowing the use of their material in some of the figures.
Footnotes
1 The abbreviations used are:
- FTMS
- Fourier transform-based mass spectrometry
- FTICR
- Fourier transform ion cyclotron resonance
- FWHM
- full width at half maximum
- MS/MS
- tandem mass spectrometry
- mmu
- millimass unit
- RF
- radiofrequency
- SWIFT
- stored waveform inverse Fourier transform
- MECA
- multiple excitation collisional activation
- SORI
- sustained off-resonance irradiation
- IR
- infra red
- IRMPD
- infra red multiphoton dissociation
- ECD
- electron capture dissociation
- MSn
- multiple levels of fragmentation
- LTQ
- linear trap quadrupole.
REFERENCES
- 1. Kind T., Fiehn O. (2006) Metabolomic database annotations via query of elemental compositions: Mass accuracy is insufficient even at less than 1 ppm. Bioinformatics 7, 234–244 [DOI] [PMC free article] [PubMed] [Google Scholar]
- 2. Kind T., Fiehn O. (2007) Seven Golden Rules for heuristic filtering of molecular formulas obtained by accurate mass spectrometry. Bioinformatics 8, 105–125 [DOI] [PMC free article] [PubMed] [Google Scholar]
- 3. Böcker S., Letzel M. C., Lipták Z., Pervukhin A. (2009) SIRIUS: decomposing isotope patterns for metabolite identification. Bioinformatics 25, 218–224 [DOI] [PMC free article] [PubMed] [Google Scholar]
- 4. Zhu M., Ma L., Zhang H., Humphreys W. G. (2007) Detection and structural characterization of glutathione-trapped reactive metabolites using liquid chromatography-high-resolution mass spectrometry and mass defect filtering. Anal. Chem. 79, 8333–8341 [DOI] [PubMed] [Google Scholar]
- 5. Cox J., Mann M. (2009) Computational principles of determining and improving mass precision and accuracy for proteome measurements in an orbitrap. J. Am. Soc. Mass Spectrom. 20, 1477–1485 [DOI] [PubMed] [Google Scholar]
- 6. Scheltema R. A., Kamleh A., Wildridge D., Ebikeme C., Watson D. G., Barrett M. P., Jansen R. C., Breitling R. (2008) Increasing the mass accuracy of high-resolution LC-MS data using background ions – a case study on the LTQ-Orbitrap. Proteomics 8, 4647–4656 [DOI] [PubMed] [Google Scholar]
- 7. Wobschall D. (1965) Ion cyclotron resonance spectrometer. Rev. Sci. Instrum. 36, 466–476 [Google Scholar]
- 8. Comisarow M. B., Marshall A. G. (1974) Fourier transform ion cyclotron resonance spectroscopy. Chem. Phys. Lett. 25, 282–283 [Google Scholar]
- 9. Rempel D. L., Huang S. K., Gross M. L. (1986) Relation of signal sensitivity and ion z-motion in cubic cells. Theory and implication for ion kinetic studies. Int. J. Mass Spectrom. Ion Proc. 70, 163–184 [Google Scholar]
- 10. Kofel P., Allemann M., Kellerhals H. P., Wanczyk K. P. (1986) Coupling of axial and radial motions in ICR cells during excitation. Int. J. Mass Spectrom. Ion Proc. 74, 1–12 [Google Scholar]
- 11. Mitchell D. W., Rockwood A. L., Chen R., Sherman M. G., Smith R. D. (1994) Theoretical investigations of frequency shifts caused by electrostatic trapping field inhomogeneities in ion cyclotron resonance mass spectrometry. Proc. 42nd Amer. Soc. Mass Spectrom. Conf. on Mass Spectrom. & Allied Topics, pp 729, Amer. Soc. Mass Spectrom., Chicago, IL [Google Scholar]
- 12. Marshall A. G., Hendrickson C. L., Jackson G. S. (1998) Fourier transform ion cyclotron resonance mass spectrometry: a primer. Mass Spectrom. Rev. 17, 1–35 [DOI] [PubMed] [Google Scholar]
- 13. Comisarow M. B., Marshall A. G. (1974) Frequency-sweep Fourier transform ion cyclotron resonance spectroscopy. Chem. Phys. Lett. 26, 489–490 [Google Scholar]
- 14. Marshall A. G., Roe D. C. (1980) Theory of Fourier transform ion cyclotron resonance mass spectroscopy: Response to frequency-sweep excitation. J. Chem. Phys. 73, 1581–1590 [Google Scholar]
- 15. Guan S., Marshall A. G. (1996) Stored waveform inverse Fourier transform (SWIFT) ion excitation in trapped-ion mass spectrometry: Theory and applications. Int. J. Mass Spectrom. Ion Proc. 157–158, 5–37 [Google Scholar]
- 16. O'Connor P. B., McLafferty F. W. (1995) High-resolution ion isolation with the ion cyclotron resonance capacitively coupled open cell. J. Am. Soc. Mass Spectrom. 6, 533–535 [DOI] [PubMed] [Google Scholar]
- 17. Guan S., Burlingame A. L. (2010) High mass selectivity for top-down proteomics by application of SWIFT technology. J. Am. Soc. Mass Spectrom. 21, 455–459 [DOI] [PMC free article] [PubMed] [Google Scholar]
- 18. Ledford E. B., Jr., Rempel D. L., Gross M. L. (1984) Space-charge effects in Fourier-transform mass-spectrometry - mass calibration. Anal. Chem. 56, 2744–2748 [DOI] [PubMed] [Google Scholar]
- 19. Wang M., Marshall A. G. (1988) Mass shifts induced by negative frequency peaks in linearly polarized Fourier transform ion cyclotron resonance signals. Int. J. Mass Spectrom. Ion Proc. 86, 31–51 [Google Scholar]
- 20. Syka J. E., Marto J. A., Bai D. L., Horning S., Senko M. W., Schwartz J. C., Ueberheide B., Garcia B., Busby S., Muratore T., Shabanowitz J., Hunt D. F. (2004) Novel linear quadrupole ion trap/FT mass spectrometer: performance characterization and use in the comparative analysis of histone H3 post-translational modifications. J. Proteome Res. 3, 621–626 [DOI] [PubMed] [Google Scholar]
- 21. Hanson C. D., Castro M. E., Kerley E. L., Russel D. H. (1990) Field-corrected ion cell for ion cyclotron resonance. Anal. Chem. 62, 520–526 [Google Scholar]
- 22. Caravatti P., Allemann M. (1991) The infinity cell: a new trapped-ion cell with radiofrequency covered trapping electrodes for Fourier transform ion cyclotron resonance mass spectrometry. Org. Mass Spectrom. 26, 514–518 [Google Scholar]
- 23. Wang M., Marshall A. G. (1989) A ”screened“ electrostatic ion trap for enhanced mass resolution, mass accuracy, reproducibility, and upper mass limit in Fourier-transform ion cyclotron resonance mass spectrometry. Anal. Chem. 61, 1288–1293 [DOI] [PubMed] [Google Scholar]
- 24. Wang M. D., Marshall A. G. (1990) Elimination of z-ejection in Fourier transform ion cyclotron resonance mass spectrometry by radio frequency electric field shimming. Anal. Chem. 62, 515–520 [DOI] [PubMed] [Google Scholar]
- 25. Beu S. C., Laude D. A., Jr. (1992) Elimination of axial ejection during excitation with a capacitively coupled open trapped-ion cell for Fourier transform ion cyclotron resonance mass spectrometry. Anal. Chem. 64, 177–180 [Google Scholar]
- 26. Bruce J. E., Anderson G. A., Lin C. Y., Gorshkov M., Rockwood A. L., Smith R. D. (2000) A novel high-performance Fourier transform ion cyclotron resonance cell for improved biopolymer characterization. J. Mass Spectrom. 35, 85–94 [DOI] [PubMed] [Google Scholar]
- 27. Marshall A. G. (1979) Theoretical signal-to-noise ratio and mass resolution in Fourier transform ion cyclotron resonance mass spectrometry. Anal. Chem. 51, 1710–1714 [Google Scholar]
- 28. Marshall A. G., Comisarow M. B., Parisod G. (1979) Relaxation and spectral line shape in Fourier transform ion resonance spectroscopy. J. Chem. Phys. 71, 4434–4444 [Google Scholar]
- 29. Marshall A. G., Guan S. (1996) Advantages of high magnetic field for Fourier transform ion cyclotron mass spectrometry. Rapid Commun. Mass Spectrom. 10, 1819–1823 [Google Scholar]
- 30. Nikolaev E. N., Heeren R. M., Popov A. M., Pozdneev A. V., Chingin K. S. (2007) Realistic modeling of ion cloud motion in a Fourier transform ion cyclotron resonance cell by use of a particle-in-cell approach. Rapid Commun. Mass Spectrom. 21, 3527–3546 [DOI] [PubMed] [Google Scholar]
- 31. Lee S. A., Jiao C. Q., Huang Y., Freiser B. S. (1993) Multiple excitation collisional activation in fourier-transform mass spectrometry. Rapid Commun. Mass Spectrom. 7, 819–821 [Google Scholar]
- 32. Boering K. A., Rolfe J., Brauman J. I. (1992) Control of ion kinetic energy in ion cyclotron resonance spectrometry: Very-low-energy collision-induced dissociation. Rapid Commun. Mass Spectrom. 6, 303–305 [Google Scholar]
- 33. Gauthier J. W., Trautman T. R., Jacobson D. B. (1991) Sustained off-resonance irradiation for collision-activated dissociation involving Fourier transform mass spectrometry. Collision-activated dissociation technique that emulates infrared multiphoton dissociation. Anal. Chim. Acta 246, 211–225 [Google Scholar]
- 34. Woodin R. L., Bomse D. S., Beauchamp J. L. (1978) Multiphoton dissociation of molecules with low power continuous wave infrared laser radiation. J. Am. Chem. Soc. 100, 3248–3250 [Google Scholar]
- 35. Peiris D. M., Cheeseman M. A., Ramanathan R., Eyler J. R. (1993) Infrared multiple photon dissociation spectra of gaseous ions. J. Phys. Chem. 97, 7839–7843 [Google Scholar]
- 36. Williams E. R., Furlong J. J. P., McLafferty F. W. (1990) Efficiency of Collisionally-activated dissociation and 193-nm photodissociation of peptide ions in fourier transform mass spectrometry. J. Am. Soc. Mass Spectrom. 1, 288–294 [DOI] [PubMed] [Google Scholar]
- 37. Little D. P., Speir J. P., Senko M. W., O'Connor P. B., McLafferty F. W. (1994) Infrared multiphoton dissociation of large multiply charged ions for biomolecule sequencing. Anal. Chem. 66, 2809–2815 [DOI] [PubMed] [Google Scholar]
- 38. Zubarev R. A., Kelleher N. L., McLafferty F. W. (1998) Electron capture dissociation of multiply charged protein cations. A nonergodic process. J. Am. Chem. Soc. 120, 3265–3266 [Google Scholar]
- 39. Stensballe A., Jensen O. N., Olsen J. V., Haselmann K. F., Zubarev R. A. (2000) Electron capture dissociation of singly and multiply phosphorylated peptides. Rapid Commun. Mass Spectrom. 14, 1793–1800 [DOI] [PubMed] [Google Scholar]
- 40. Shi S. D., Hemling M. E., Carr S. A., Horn D. M., Lindh I., McLafferty F. W. (2001) Phosphopeptide/ phosphoprotein mapping by electron capture dissociation mass spectrometry. Anal. Chem. 73, 19–22 [DOI] [PubMed] [Google Scholar]
- 41. Mirgorodskaya E., Roepstorff P., Zubarev R. A. (1999) Localization of O-glycosylation sites in peptides by electron capture dissociation in a Fourier transform mass spectrometer. Anal. Chem. 71, 4431–4436 [DOI] [PubMed] [Google Scholar]
- 42. Kelleher N. L., Zubarev R. A., Bush K., Furie B., Furie B. C., McLafferty F. W., Walsh C. T. (1999) Localization of labile posttranslational modifications by electron capture dissociation: the case of gamma-carboxyglutamic acid. Anal. Chem. 71, 4250–4253 [DOI] [PubMed] [Google Scholar]
- 43. Budnik B. A., Olsen J. V., Egorov T. A., Anisimova V. E., Galkina T. G., Musolyamov A. K., Grishin E. V., Zubarev R. A. (2004) De novo sequencing of antimicrobial peptides isolated from the venom glands of the wolf spider. Lycosa singoriensis. J. Mass Spectrom. 39, 193–201 [DOI] [PubMed] [Google Scholar]
- 44. Kjeldsen F., Haselmann K. F., Budnik B. A., Sørensen E. S., Zubarev R. A. (2003) Complete characterization of posttranslational modification sites in the bovine milk protein PP3 by tandem mass spectrometry with electron capture dissociation as the last stage. Anal. Chem. 75, 2355–2361 [DOI] [PubMed] [Google Scholar]
- 45. Kjeldsen F., Haselmann K. F., Budnik B. A., Jensen F., Zubarev R. A. (2002) Dissociative capture of hot (3–13 eV) electrons by polypeptide polycations: an efficient process accompanied by secondary fragmentation. Chem. Phys. Lett. 356, 201–206 [Google Scholar]
- 46. Adams C. M., Zubarev R. A. (2005) Distinguishing and quantifying peptides and proteins containing D-amino acids by tandem mass spectrometry. Anal. Chem. 77, 4571–4580 [DOI] [PubMed] [Google Scholar]
- 47. Ge Y., Lawhorn B. G., ElNaggar M., Strauss E., Park J. H., Begley T. P., McLafferty F. W. (2002) Top down characterization of larger proteins (45 kDa) by electron capture dissociation mass spectrometry. J. Am. Chem. Soc. 124, 672–678 [DOI] [PubMed] [Google Scholar]
- 48. Han X., Aslanian A., Yates J. R., 3rd (2008) Mass spectrometry for proteomics. Curr. Opin. Chem. Biol. 12, 483–490 [DOI] [PMC free article] [PubMed] [Google Scholar]
- 49. Mann M., Kelleher N. L. (2008) Precision proteomics: The case for high resolution and high mass accuracy. Proc. Natl. Acad. Sci. U.S.A. 105, 18132–18138 [DOI] [PMC free article] [PubMed] [Google Scholar]
- 50. Scigelova M., Makarov A. (2009) Advances in bioanalytical LC–MS using the Orbitrap™ mass analyzer. Bioanalysis 1, 741–754 [DOI] [PubMed] [Google Scholar]
- 51. Perry R. H., Cooks R. G., Noll R. J. (2008) Orbitrap mass spectrometry: Instrumentation, ion motion and applications. Mass Spectrom. Rev. 27, 661–699 [DOI] [PubMed] [Google Scholar]
- 52. Makarov A. (2000) Electrostatic axially harmonic orbital trapping: a high-performance technique of mass analysis. Anal. Chem. 72, 1156–1162 [DOI] [PubMed] [Google Scholar]
- 53. Denisov E., Strupat K., Makarov A. A., Zabrouskov V. (2007) Pushing intact protein detection limits of the Orbitrap mass analyzer. Proc. 55th ASMS Conf. on Mass Spectrom., and Allied Topics, Indianapolis, June 3–7 [Google Scholar]
- 54. Makarov A., Denisov E., Lange O., Horning S. (2006) Dynamic range of mass accuracy in LTQ orbitrap hybrid mass spectrometer. J. Am. Soc. Mass Spectrom. 17, 977–982 [DOI] [PubMed] [Google Scholar]
- 55. Schwartz J. C., Senko M. W., Syka J. E. P. (2002) A two-dimensional quadrupole ion trap mass spectrometer. J. Am. Soc. Mass Spectrom. 13, 659–669 [DOI] [PubMed] [Google Scholar]
- 56. Makarov A., Denisov E., Kholomeev A., Balschun W., Lange O., Strupat K., Horning S. (2006) Performance evaluation of a hybrid linear ion trap/Orbitrap mass spectrometer. Anal. Chem. 78, 2113–2120 [DOI] [PubMed] [Google Scholar]
- 57. Olsen J. V., de Godoy L. M., Li G., Macek B., Mortensen P., Pesch R., Makarov A., Lange O., Horning S., Mann M. (2005) Parts per million mass accuracy on an Orbitrap mass spectrometer via lock mass injection into a C-trap. Mol. Cell Proteomics 4, 2010–2021 [DOI] [PubMed] [Google Scholar]
- 58. Cox J., Mann M. (2008) MaxQuant enables high peptide identification rates, individualized p.p.b.-range mass accuracies and proteome-wide protein quantification. Nat. Biotechnol 26, 1367–1372 [DOI] [PubMed] [Google Scholar]
- 59. Dernovics M., Lobinski R. (2008) Speciation analysis of selenium metabolites in yeast-based food supplements by ICPMS assisted hydrophilic interaction HPLC hybrid linear ion trap/Orbitrap MSn. Anal. Chem. 80, 3975–3984 [DOI] [PubMed] [Google Scholar]
- 60. Erve J. C., DeMaio W., Talaat R. E. (2008) Rapid metabolite identification with sub parts-per-million mass accuracy from biological matrices by direct infusion nanoelectrospray ionization after clean-up on a ZipTip and LTQ/Orbitrap mass spectrometry. Rapid Commun. Mass Spectrom. 22, 3015–3026 [DOI] [PubMed] [Google Scholar]
- 61. Scherl A., Shaffer S. A., Taylor G. K., Hernandez P., Appel R. D., Binz P. A., Goodlett D. R. (2008) On the benefits of acquiring peptide fragment ions at high measured mass accuracy. J. Am. Soc. Mass Spectrom. 19, 891–901 [DOI] [PMC free article] [PubMed] [Google Scholar]
- 62. Lange O., Makarov A., Balschun W., Denisov E. (2010) Accelerating spectral acquisition rate of Orbitrap mass spectrometry. 58th ASMS Conf. on Mass Spectrom. & Allied Topics, May 23–27, Salt Lake City, Utah [Google Scholar]
- 63. Bondarenko P. V., Second T. P., Zabrouskov V., Makarov A. A., Zhang Z. (2009) Mass measurement and top-down HPLC/MS analysis of intact monoclonal antibodies on a hybrid linear quadrupole ion trap-Orbitrap mass spectrometer. J. Am. Soc. Mass Spectrom. 20, 1415–1424 [DOI] [PubMed] [Google Scholar]
- 64. Kaufmann R., Kirsch D., Rood H. A., Spengler B. (1992) Secondary-ion generation from large keV molecular primary ions incident on a stainless-steel dynode. Rapid Commun. Mass Spectrom. 6, 98–104 [Google Scholar]
- 65. Makarov A., Denisov E., Lange O. (2009) Performance evaluation of a high-field Orbitrap mass analyzer. J. Am. Soc. Mass Spectrom. 20, 1391–1396 [DOI] [PubMed] [Google Scholar]
- 66. Beu S. C., Blakney G. T., Quinn J. P., Hendrickson C. L., Marshall A. G. (2004) Broadband phase correction of FT-ICR mass spectra via simultaneous excitation and detection. Anal. Chem. 76, 5756–5761 [DOI] [PubMed] [Google Scholar]
- 67. Xian F., Hendrickson C. L., Blakney G. T., Beu S. C., Marshall A. G. (2010) Automated broadband phase correction of Fourier transform ion cyclotron resonance mass spectra. Anal. Chem. 82, 8807–8812 [DOI] [PubMed] [Google Scholar]


