

Abstract
This study investigated the effect of bone marrow mesenchymal stem cells (BMSCs) on the motor pathway in the transient ischemic rat brain that were transplanted through the carotid artery, measuring motor-evoked potential (MEP) in the four limbs muscle and the atlantooccipital membrane, which was elicited after monopolar and bipolar transcortical stimulation. After monopolar stimulation, the latency of MEP was significantly prolonged, and the amplitude was less reduced in the BMSC group in comparison with the control group (P < .05). MEPs induced by bipolar stimulation in the left forelimb could be measured in 40% of the BMSC group and the I wave that was not detected in the control group was also detected in 40% of the BMSC group. Our preliminary results imply that BMSCs transplanted to the ischemic rat brain mediate effects on the functional recovery of the cerebral motor cortex and the motor pathway.
1. Introduction
When ischemic stroke occurs, motor function is one of the most important brain functions to be protected together with language, sensory, visual, and hearing function. Since the most motor cortex and motor neuron pathway are located in the middle cerebral artery territory, infarction of this territory causes contralateral hemiplegia. Therefore, to treat acute cerebral infarction, recanalization of occluded blood vessels should be performed, and neuroprotective therapies that prevent reperfusion injury should be performed. Nevertheless, if it could not be treated within limited times, neurons could not be restored permanently. In such manners, the regeneration capacity of neurons is very low, and thus methods that could substitute neurons are required [1]. Therefore, studies that transplant diverse stem cells to the cerebral ischemic area and induce them to differentiate to neurons or to substitute neuronal function are ongoing.
Several studies reported that in adult rats, BMSCs transplanted after cerebral infarction accelerated neuroplasticity and facilitated neuronal regeneration as well as functional recovery [2–7]. In other words, it has been reported that intravenous injection of BMSCs reduced the cerebral infarct volume and improved motor functions, and cerebral infarct size could be reduced noticeably by the injection within 3 hours after MCA occlusion (MCAo) [8]. In addition, one-hour MCAo rat models, similarly, when BMSCs were injected to the ipsilateral carotid artery immediately after reperfusion, the cerebral infarct volume was reduced and motor function was improved [3].
All investigators reported that as the cerebral infarct volume became smaller, the neurobehavior was improved more [9–11]. Nevertheless, evaluation of the recovery of motor function was conducted with subjective neurobehavioral tests, determined and scored by examiners [9–11]. Objective evaluation studies on the recovery of motor function in cerebral ischemic animals after transplantation of stem cells have not been conducted. Therefore, for the objective evaluation of the recovered neuronal function after stem cell transplant, we applied MEPs representing the level of electrophysiological response. MEPs have been used to measure the motor nerve function in animals with lower limb paralysis at BMSCs transplantation after spinal cord injury [12–14]. However, it has been rarely used to measure the motor neuronal function in the ischemic rat brain [15–17].
Recently, it has been reported that in normal rats, by measuring the sensory-evoked potential, the corticomotor-evoked potential (CMEP), and the brainstem-derived MEP (BMEP) serially, CMEP was originated from the motor cortex [18]. In addition, through monopolar as well as bipolar stimulation, MEPs originated from the brainstem could be measured during suprathreshold stimulation [19], and after focal stimulation of the motor cortex, the MEP in the brain stem was measured, and thus studies on electrophysiological changes after reperfusion in transient ischemic animal models have been conducted [15, 20]. Therefore, if MEPs with a different origin could be measured continuously through focal monopolar as well as bipolar stimulation of the motor cortex, the integrity of the motor pathway may be examined.
In our study, in acute cerebral ischemic rats, electrophysiological effects on motor-neuron pathway of transplanted BMSCs were assessed by measuring MEP.
2. Materials and Methods
2.1. General Aspects
All experimental protocols used in this study were designed according to animal guidelines established by the Institutional Animal Care and Use Committee of the Catholic University Medical School. Ten adult male Sprague-Dawley rats weighing 270 to 320 g were employed in the study. MEPs were measured in all animals of each group before surgery for establishment of comparative baseline waves. After transient MCA occlusion surgery, experimental animals were assigned randomly to one of the following two groups: (1) the saline injection group as the control group (n = 5, Control group) and (2) the BMSC injection group as the experimental group (n = 7, BMSC group). Electrophysiological recording was conducted at seven days after MCAo.
2.2. Preparation of BMSC
2.2.1. BMSC Isolation and Culture
Rats weighing 150–200 g were sacrificed by 15% urethane; BMSCs were collected from femurs and tibias by flushing the shaft with 15 mL buffer (phosphate-buffered saline supplemented with 2% fetal bovine serum) using a sterile hypodermic syringe. Cells were diluted with buffer up to 50 mL and centrifuged through a density gradient (Ficoll-Paque-Plus; 1.077 g/mL; Pharmacia) for 30 minutes at 1000 × g. Cells were plated at 7 × 10⁵ cells/cm2 in a coating-culture dish and maintained in Dulbecco's modified Eagle medium/20% fetal bovine serum.
2.2.2. Immunophenotyping of BMSC
For cell-surface Ag phenotyping, cells were detached and stained with fluorescein isothiocyanate—or fluorescein phycoerythrin-coupled Ab. Labeled cells were analyzed by FACSCalibur flow cytometer (Becton Dickinson, San Jose, CA, USA) using CellQuest software (Becton Dickinson). For detection of surface Ag, aliquots of BMSCs were washed 3 times with PBS, pH 7.4, following treatment with 0.25% trypsin. For direct assays, cells were immunolabeled with antirat Ab CD45 (FITC) and CD90 (PE).
2.3. Surgical Procedure and MCA Occlusion
2.3.1. Ischemic Rat Model
Rats were anaesthetized using nitrous oxide/oxygen gas, 70 and 30%, respectively, administered through an inhalation mask. During all procedures, body temperatures were maintained under controlled conditions (37 ± 0.4°C) via the use of a rectal thermometer and a heating pad (Harvard Apparatus Inc., Holliston, MA, USA). Each animal was placed in a stereotactic frame (Narishige Scientific Instrument Lab, Tokyo, Japan). An incision of about 1.5 cm was made in the scalp under asceptic conditions, and two holes were carefully drilled into the skull of each animal; a 1.0 mm diameter drill bit (Saeshin Precision Co., Ltd., Daegu, Korea) was used in order to avoid direct injury by perforation of the dura mater. Cerebral blood flow (CBF) in each occlusion model was measured using a Transonic Laser Doppler (BLF21 series, Transonic Systems Inc., New York, USA). After measurement of cerebral blood flow, transient MCA occlusion was induced using the intraluminal filament technique described by Longa et al. [21]. Briefly, this involves making an approximately 2 cm ventral incision, exposing the right common carotid artery (CCA), external carotid artery (ECA), and internal carotid artery (ICA). ECA was ligated distal to the bifurcation using 4–0 silk. A 30 mm length 3–0 nylon monofilament (Ethicon, Johnson & Johnson Medical Ltd., Livingston, UK) with a heat-blunted round tip was inserted through a small opening in the ECA stump and gently advanced into the ICA until it blocked the bifurcating origin of the MCA. The wound was closed temporarily to enable BMSC injection following withdrawal of the inserted nylon through the ECA after an occlusion period of 90 minutes.
Each animal was then fixed again in a stereotactic frame, and the scalp wound was reopened. Regional CBF values for the forelimb area were recorded. CBF values were < 35% of the levels recorded prior to MCA occlusion (26.5 ± 5.73%).
2.3.2. Placement of MEP Electrodes
One screw (coronal) was positioned at the following coordinates: 2.5 mm right from midline and 1 mm anterior to the bregma over the forelimb area of the right motor cortex [22, 23]. The other (posterior) screw was positioned 1–2 mm posterior to the lambda. Commercial stainless steel screws (10 mm in length with a 1.2 mm outer diameter) were implanted as the anode for elicitation of MEP at the burr hole site at a depth of 1.5 mm (Figure 1).
Figure 1.
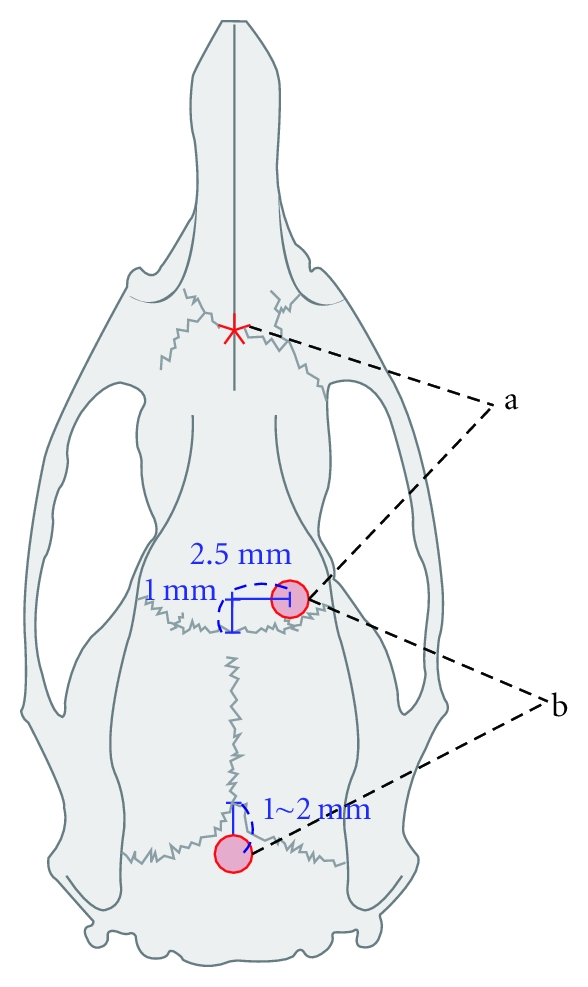
Two cranial screws inserted right to the midline and posterior to the lambda for suprathreshold monopolar electrical stimulation (a) and focal cortical bipolar stimulation (b) Asterix: reference electrode for monopolar stimulation.
We chose commercial disposable subdermal stainless steel needle electrodes (ref. 019-409800, Viasys Healthcare Inc., Conshohocken, PA, USA) with a diameter of 0.4 mm (27 G) and a needle length of 12 mm. However, the uninsulated part of the needle tip proved too long for insertion into the forelimb and hind limb muscles; therefore, we insulated the tip using a rubber tube to expose just 3 mm of the tip. One pair of 1mm uninsulated electrodes was used to record the motor evoked potential at the brain stem (bsMEP), and the interpolar distance was 2 mm.
Intra-Arterial Injection of BMSCs —
After a 90-minute period of MCA occlusion, the wound was reopened, and the CCA and ICA were loosely ligated with 4–0 silk to prevent bleeding from the ECA opening. The 3–0 monofilament was then gently withdrawn from the ECA opening through the ICA lumen, and 100 μL of saline containing 1 × 10⁶ cells was introduced using a Hamilton syringe (Harvard Apparatus, Holliston, MA, USA) to which a Polyethylene (PE) 10 tube (Harvard Apparatus, Holliston, MA, USA) was connected. The PE 10 tube was then advanced into a small opening of the ECA to the lumen of the ICA to a depth of approximately 15 mm, and blood was retrieved through the PE 10 tube to confirm a connection with the MCA. Stem cells were slowly injected into the lumen, and the blunt needle was withdrawn from the ECA. The ECA was ligated with 4–0 silk, and pulsation of the ICA was confirmed. The control group was injected only with 10 uL of saline. After injection of stem cells or saline, reperfusion was identified by measuring the cortical blood flow with a Transonic Laser Doppler in both groups (62 ± 10.4%).
2.3.3. Electrophysiological Recordings
MEPs were recorded using the Cadwell Cascade (Cadwell laboratories, Inc., Kennewick, WA, USA). After a fast of 12 hours, a dosage of ketamine 60 mg/kg and xylazine 5 mg/kg was administered intraperitoneally to rats for induction of anesthesia. The level of anesthesia was assessed by scoring of the withdrawal reflex described in a previous report [24]. This index assigns a score of 1–6 based on factors such as level of muscle contraction and limb withdrawal as well as flexion. A withdrawal reflex score below 3 was required before fixing any animal on the stereotaxic frame. Subdermal needles were then introduced into the belly of both brachioradialis muscles.
Monopolar Electrical Stimulation —
mBMEPs were evoked by a single, short train of supramaximal intensity impulses (stimulation type, TCS-1; pulse width, 50 μs; 6–20 mA; 0.5 Hz; interstimulus interval 2 milli seconds, maximal intensity 20 mV) applied via the coronal screw (anode) referenced to the electrode around the nasion (cathode). Stimulation was ceased when a clear signal was detected. At least two signals were required to confirm reproducibility. Amplitude (mV) was defined as the height from initial peak to baseline. Latency was defined as the interval from administration of the electrical stimulation to the starting point of initial deflection (Figure 3(a)).
Figure 3.

Motor-evoked potentials. Typical trace (mBMEP) recorded after suprathreshold monopolar stimulation in normal rat (a) (* and ** indicate latency and amplitude). Preoperative baseline MEPs at four limbs (b). At postoperative day 7, representative wave patterns were obtained in the control group (c) and in the BMSC group (d) (FL: forelimb; HL: hind limb; Lt: left; Rt: right).
Bipolar Electrical Stimulation —
Anodal coronal and cathodal posterior screws were connected to a stimulator. The other ground electrode was placed subdermally at the back of the cervicothoracic junction. An additional midline skin incision was made over the neck, and the posterior atlantooccipital membrane was exposed in order to enable placement of MEP recording electrodes. Signals were filtered at a bandpass frequency of between 10 and 3,000 Hz and stored for later computer analysis. Electrical stimuli were discharged at 30-second intervals in order to avoid signal deterioration [25, 26]. Transcranial electrical stimulation was set to occur at every 3 minutes. Amplitude (mV) was defined as the height from negative peak to positive peak. Latency was defined as the interval from administration of electrical stimulation to the starting point of the initial deflection. MEPs were evoked by a single short train of low intensity impulse (stimulation type: electrical; pulse width: 100 μs; stimulation intensity: 0.05–10 mA; repetition rate: 15.1 Hz) applied via the coronal screw (anode) referenced to the posterior screw (cathode) in the manner used by Schlag et al. [18]. Three different MEPs were measured: bCMEP, bBMEP, and bsMEP. bCMEP was elicited by focal bipolar stimulation of the cortex with two cranial screws and recorded from the contralateral forelimb. Stimulation intensity was increased by 0.5 mA and was stopped when both bBMEPs were recorded or movement of both forelimbs developed (Figure 4). bsMEP recorded at the atlantooccipital membrane consisted of D and I wave. At least two signals were obtained in order to confirm reproducibility.
Figure 4.

Representative MEPs recorded serially by bipolar stimulation in normal rat (A) and control group (B) and BMSC group (C) 7days after reperfusion. Column (a) displayed a typical bCMEP (*) at 4.0 mA stimulation intensity and consecutive waves of bBMEP (large arrow) and bCMEP (*) at 6.0 mA stimulation intensity in the left forelimb. Column (b) shows right forelimb-evoked potentials. Column (c) shows a typical D and I wave (D and I). Column (d) displays a vestige of bCMEP (large arrow) at 6.0 mA stimulation intensity with a preceding bBMEP column (e) showing right forelimb-evoked potentials. Column (f) shows a large D wave but no I wave. Column (g) shows bCMEP (large arrow) at 6.0 mA stimulation intensity with a preceding bBMEP. Column (h) shows right forelimb-evoked potentials. Column (i) depicts a visible I wave subsequent to D wave.
2.3.4. Behavior Evaluation
Daily adhesive-removal tests and treadmill tests were performed in 10 adult rats for 5 days prior to cranial screw implantation. After MCAo, behavior tests were conducted at 1- and 7-day follow-up.
Adhesive-Removal Test —
Two small adhesive paper dots (12 mm diameter) as bilateral tactile stimuli were firmly attached to each wrist of the forelimbs of the rat so that they covered the hairless part of the forepaw.
The time required to remove both paper dots from each limb was recorded in five trials per day for 3 days. All animals can remove the dot within 10 seconds (sec.) at the end of training. So, the animals were familiarized with the testing environment before operation. Three trials were conducted after ischemic stroke, with a cutoff time of 180 seconds. Data are presented as the mean time for removal of the left dot.
Treadmill Test —
Animals were trained 3 times per week prior to MCAo. Treadmill (Panlab, Barcelona, Spain) acceleration was 5 to 80 cm/sec within 4 minutes, and the end of the test was 85 cm/sec. Maximum velocity of tolerance for each animal was checked 3 times.
2.3.5. Quantitative Analysis of Infarct Volume
At 7 days after MCAO, all rats (n = 5 and 4 in each group) were anesthetized with 15% urethane and sacrificed by decapitation. The brain was immediately removed and sectioned into 2 equally spaced, 2 mm coronal blocks using a rodent brain matrix. These sections were stained with 0.1 M PBS containing 2% solution of 2-3-5-triphenylterazolium (TTC; Sigma, St. Louis, MO, USA) for 15 minutes at 37°C. Scanned brain images were quantified using Meta-Morph imaging software (Molecular Devices Inc, Downingtown, PA, USA). To reduce errors due to cerebral edema, the infarct area in each slice was corrected by subtracting the ischemic lesion site hemisphere area from the contralateral hemisphere area.
2.3.6. Identification of BMSC
Seven days after MCAo, three animals into which PKH26-labeled stem cells had been injected were sacrificed for histological examination. Another was anesthetized with 15% urethane and then perfused transcardially with 0.01 M PBS (pH 7.4), and with 4% paraformaldehyde (PFA) in 0.01 M PBS. Brains were removed and postfixed in 4% PFA for 4 hours. Postfixed tissue was cryoprotected in 0.1 M phosphate buffer (pH 7.4) containing 10, 20, and 30% sucrose solutions, respectively, at 4°C. Brain tissues were embedded in Tissue-Tech OCT compound (PS002) and stored at −70°C. For immunohistochemical staining of BMSC-injected brain lesions, 14 μm thick coronal sections were cut on a cryostat microtome. After cleaning the brain with a PBS solution, nuclei were stained with 4, 6 diamidino-2-phenylindole (DAPI; Sigma).
2.3.7. Statistical Analysis
Statistical analysis was performed using commercially available software (PASW Statistics 16.0; SPSS Inc., Chicago, IL, USA). All data are presented as mean values ± standard deviation. Behavior tests, cerebral infarct volume, and MEP parameters in each group were subjected to one-way ANOVA with posthoc analysis, independent T-test, or Mann-Whitney U test. Statistical significance was accepted at P < .05.
3. Results
3.1. Infarction Volume
Size of infarcts was evaluated by measurement of infarction volumes at 7 days after MCAo. Rat brains were stained with TTC in order to obtain the infarction volume, which was calculated by measurement of the area of the infarcted region. Infarction volume of the BMSC group decreased significantly compared with that of the control group (Control: 393.18 ± 155.4; BMSC: 123.1 ± 55.0, P < .05) (Figure 2(a)).
Figure 2.

Infarct volume of the BMSC group decreased significantly from that of the control group (a). Results of the adhesive removal test (b) and treadmill test (c) at days 1 and 7 after MCAo in the control and BMSC groups. In the adhesive removal test, the BMSC group showed markedly improved behavior function (b). On the treadmill test, although there were no significant differences between the groups, the graph depicts an improvement in motor function in the BMSC group. *P < .05.
3.2. Behavior Analysis
Behavior function was determined with adhesive removal and treadmill tests. Prior to MCAo, neurological scores among the 10 animals were similar. At postoperative day 1, the performance of the BMSC group in the adhesive removal test was superior to that of the control group (Control group: 174.3 ± 10.2, BMSC group: 74.5 ± 12.6, P < .05). At day 7, the difference between the two groups was significant (Control group: 149.85 ± 50.3, BMSC group: 26.7 ± 4.7, P < .05). However, in relation to the treadmill test, there were no significant differences between the two groups at postoperative days 1 and 7 (Figures 2(b) and 2(c)).
3.3. Motor-Evoked Potentials
In the case of bipolar electrical stimulation, MEPs following anesthetic injection were recorded at intervals ranging from 24 to 42 minutes (36.4 ± 5.2). MEPs produced by monopolar electrical stimulation were then recorded (45.7 ± 8.5 minutes).
3.3.1. Monopolar Transcranial Stimulation
Stimulation intensity needed to elicit mBMEP was 12.2 ± 3.3 mA. Latency of left forelimb mBMEP was 4.0 ± 0.4 milli seconds, and the amplitude of mBMEP was 3,770 ± 1,518 μV. No significant difference was observed between right and left sides in the preoperative MEP parameters of all animals of both groups (Table 1, Figure 3).
Table 1.
Preoperative baseline mBMEP parameters.
| Variables | FL Lt (1) | HL Lt (2) | FL Rt (3) | HL Rt (4) |
|---|---|---|---|---|
| Amplitude (μV) | 3770 ± 1518 | 3300 ± 1191 | 3590 ± 1990 | 4410 ± 1964 |
| Latency (ms) | 4.0 ± 0.4 | 7.4 ± 0.5 | 3.9 ± 0.4 | 7.2 ± 0.6 |
(1) versus (3) and (2) versus (4): not statistically significant (Mann-Whitney U-test).
At postoperative day 7, mean mBMEP values between the control group and the BMSC group showed significant differences in left forelimb amplitude (P = .013) and right forelimb latency (P = .021) (Table 2). Figure 4(C) shows a characteristic mBMEP signal with a conspicuous reduction of amplitude of left forelimb MEP recorded in the control group at day 7 after MCAo. In contrast, the BMSC group showed relatively larger amplitude of left forelimb MEP (Table 2, Figure 3(d)).
Table 2.
mBMEP parameters in experimental animals at day 7 after MCAo.
| Variables | Control group (n = 5) (10.0 mA)§ | BMSC group (n = 5) (12.0 ± 2.4 mA)§ | ||||||
|---|---|---|---|---|---|---|---|---|
| FL Lt | HL Lt | FL Rt | HL Rt | FL Lt | HL Lt | FL Rt | HL Rt | |
| Amplitude (μV) | 1030 ± | 4420 ± | 3880 ± | 4130 ± | 2740 ± | 4570 ± | 5170 ± | 6034 ± |
| 286* | 2211 | 1553 | 2197 | 943* | 1563 | 846 | 140 | |
| Latency (ms) | 5.3 ± | 8.7 ± | 4.2 ± | 8.1 ± | 5.7 ± | 8.5 ± | 5.0 ± | 8.1 ± |
| 0.6 | 0.6 | 0.1† | 0.8 | 0.8 | 0.7 | 0.6† | 0.4 | |
∗† P < .05 (Independent T-test), §Current intensity (FL: forelimb; HL: hind limb; Rt: right; Lt: left).
In comparison with preoperative baseline MEPs, the control group at postoperative day 7 showed a significant reduction in the amplitude of mBMEP and prolonged latency in the left limbs, although not in amplitude in the left hind limbs. The BMSC group, however, displayed significant prolongation of latency at both the left forelimbs and the hind limbs (P < .05) (Table 3).
Table 3.
Comparison of baseline mBMEPs with the experimental group on day 7.
| Baseline versus Day 7 values of left limbs | P value | |
|---|---|---|
| Control group (n = 5) | BMSC group (n = 5) | |
| FL amplitude (μV) | .002* | .142 |
| FL latency (ms) | .005* | .003* |
| HL amplitude (μV) | .391 | .270 |
| HL latency (ms) | .004* | .020* |
*A significant difference was observed between preoperative baseline values and those at 7 days (Mann-Whitney U test) (FL: forelimb; HL: hind limb).
3.3.2. Bipolar Electrical Cortical Stimulation
Focal bipolar stimulation of the cortex via the cranial screw resulted in movements of the contralateral forelimb. On gradual increase of stimulation intensity, the current interval required to elicit bCMEP ranged from 0.1 to 12.0 mA (7.1 ± 2.9). However, a pure bCMEP occurred at a current interval ranging from 0.5 to 5.0 mA (2.9 ± 1.4) (Figure 4(A)). Movement in both forelimbs was accompanied by the appearance of short-latency peak waves. D and I waves were produced at a 1.0 mA threshold (Figure 4(A)(c)) in response to gradual stimulation. Larger D and I waves were produced at greater stimulation intensities (Figure 4(A)). At a different current intensity, D wave could be measured in each group (preoperative baseline, 3.6 ± 1.9 mA; control group, 5.8 ± 1.2 mA; BMSC group, 5.0 ± 0.3 mA). Preoperative baseline amplitudes of D and I waves were 59.9 ± 18.9 and 36.1 ± 16.9 μV, respectively (Table 4). With regard to latency, mean values of D and I waves in the normal group were 2.4 ± 0.7 milli seconds and 5.6 ± 1.8 milli seconds, respectively (Table 4).
Table 4.
MEPs recorded at the left forelimb muscle produced by bipolar stimulation.
| MEPs | Preoperative baseline values | Control group (n = 5) | BMSC group (n = 5)¶ | |||
|---|---|---|---|---|---|---|
| Amp (μV) | Lat (ms) | Amp (μV) | Lat (ms) | Amp (μV) | Lat (ms) | |
| D wave(bsMEP) | 60.4 ± 22.8* | 2.4 ± 0.7 | 195.6 ± 70.6* | 1.9 ± 0.3 | 142.5 ± 14.1* | 2.0 ± 0.2 |
| I wave (bsMEP) | 36.1 ± 16.9 | 5.6 ± 1.8 | NA | NA | 52.9, 10.8 | 5.9, 10.1 |
| bCMEP | 22.1 ± 19.7 | 15.1 ± 2.3 | NA | NA | 22.7, 27.8 | 11.7, 14.4 |
| bBMEP | 68.4 ± 34.9† | 4.2 ± 0.7 | 34.8 ± 14.2 | 3.8 ± 0.2 | 21.9 ± 8.7† | 3.8 ± 0.9 |
*A significant difference was observed among preoperative baseline values, control, and BMSC group (One-Way ANOVA, P < .05). †Significant difference between two variables (Mann-Whitney U test, P < .05). ¶In two rats, I and bCMEP waves were found in the BMSC group at 7 days after MCAO. NA: not available; Amp: amplitude; Lat: latency.
At day 7 after stroke, the control group showed no bCMEP, except for a vestige signal in one animal (Figure 4(B)). bsMEP of this group contained larger amplitudes of D waves than in the normal group (116.5 ± 25.4 μV); however, no I wave was detected at sub- and supramaximal thresholds (Figure 4(B)).
Control group at postoperative day 7 had a trend with larger amplitudes of D wave (195.6 ± 70.6 μV, P = .06) than those of the BMSC group; however, no differences in latency were observed between the two groups (Table 4). In two of five rats, I wave and bCMEP turned up and were measured (Figure 4 (C)(g) and (i)).
3.4. Identification of BMSCs
In our experiment, we aimed to determine the distribution of BMSCs in the motor cortex following intra-arterial injection of PKH26-labeled BMSCs. At 7 day after injection of BMSC, sectioned rat brain around 1 mm anterior to the bregma was analyzed. Abundant PKH26-labeled cells were detected using fluorescence microscopy at the left forelimb primary motor cortex in the infarction hemisphere (Figure 5(c)) and external capsule in the contralateral hemisphere (Figure 5(d)). This rat was proved to be one of two rats whose I wave and bCMEP were restored. In additional two rats, the presence of PKH26-labeled cells in the right mortor cortex was identified.
Figure 5.

BMSCs labeled by PKH26. A schematic drawing of a brain section 0.96 mm anterior to the bregma (a). Representative confocal micrographs of brain section obtained at anterior 0.98 mm to the bregma (b, c, and d). Merged images show BMSCs at the right primary motor cortex (c) and left external capsule (d). A bar in each microphotograph represents 50 μm (×400 in (c), (d)) and 2 mm in (b). A dotted rectangle indicates the contralateral extrernal capsule and a rectangular box indicates the right primary motor cortex.
4. Discussion
In this study, the electrophysiological effect of BMSC transplanted during reperfusion to acute phase cerebral ischemia rats through the carotid artery on the motor cortex and the motor nerve pathway was examined by measuring the MEP one week after transplantation of stem cells.
At 7 days after surgery, the cerebral infarct volume of the BMSC group was significantly decreased in comparison with the control group (Figure 2(a)). Together with such histological effects, based on the serial record of mBMEPs, bCMEPs, bBMEPs, and bsMEPs in response to monopolar as well as bipolar stimulation, it could be proven that the BMSC group was associated with the partial recovery of the long-lasting synaptic transmission defect of the motor cortex in comparison with the control group.
Konrad and Tacker have reported that the transcranial MEP generated in response to monopolar suprathreshold stimulation was measured at the 2nd lumbar vertebra and the latency was lower than 3.5 milli seconds [19]. Schlag et al. have reported that the latency of MEP with a distinct negative peak measured in hind limbs was 5–7.5 milli seconds [18]. Our preoperative baseline latency of mBMEPs measured at forelimbs and hind limbs (3.9 ± 0.4 ms, 7.3 ± 0.5 ms) concurred to other studies [27], and the amplitude was larger (Table 1). In addition, after focal bipolar stimulation, the latency of bBMEPs measured in the left forelimbs was 4.2 ± 0.7 milli seconds, which was shorter than the latency of mBMEP measured in the hind limb (7.3 ± 0.5 ms), and slightly longer than the latency of mBMEP measured in the forelimbs (3.9 ± 0.4 ms) (Table 4). This phenomenon is thought to be due to the fact that the stimulation intensity of our study was stronger than that of other studies, and monopolar stimulation was stronger than bipolar stimulation, and thus the latency became shorter, and such phenomena have been reported in other studies [28]. Therefore, mBMEP and bBMEP could be considered to be the evoked potentials originated from the brainstem. On the other hand, Schlag et al. transected the corticospinal tract of spinal cord and measured the CMEP in the hind limbs and proved that the origin of this MEP generated in response to focal bipolar stimulation is the motor cortical area, based on the observation that CMEP disappeared and only BMEP was recorded [18]. In our study, the latency of bCMEP of left forelimbs in response to focal bipolar stimulation was 15.1 ± 2.3 milli seconds, which was shown to be shorter than the latency of CMEP (17–22 ms) measured in hind limbs by Schlag et al., and because of the delay comparable to the difference of the latency of the mBMEPs of hind limbs and forelimbs (3.4 ms), bCMEPs were proven to be originated from the motor cortex. Furthermore, when the intensity of bipolar stimulation was increased gradually, in response to low currents, bCMEPs were generated first, and simultaneously, only the movement of left forelimbs was observed. When the stimulation intensity was increased more, bCMEP following bBMEP was observed, and the simultaneous movement of both forelimbs was observed, which also supports that bCMEP was originated from the motor cortex. The bsMEP measured in the atlantooccipital membrane after bipolar stimulation consisted of the D wave and the I wave, similar to the studies reported by Amassian et al. [29] and Bolay et al. [15, 20]. The preoperative baseline latency of the D wave was 2.4 ± 0.7 milli seconds, which was slightly longer than results of other studies (1.81 ± 0.11 ms) [15, 20]. In addition, the threshold of the generation of bsMEP was 1.0 mA, which was comparable to results of previous studies [15, 20, 29]. When the current intensity was increased gradually, bCMEP and bBMEP were observed sequentially. Moreover, the difference of the beginning of D wave and the beginning of I wave was 3.2 milli seconds, and this value comparable to the result reported by Amassian et al. (3.5 ms) was shown. In our study, it was epidural stimulation by screws, and in other studies, it was intracortical stimulation, and thus the latency was different. Combined together, bsMEP is considered to be originated from the motor cortex.
On the day 7 after reperfusion, the mBMEP latency of the two groups became significantly longer than the preoperative baseline values. The mBMEP amplitude in left forelimbs of the BMSC group was longer significantly in comparison with that of the control group (Table 3). In addition, the latency of the two groups was not different. Many investigators believe that MEPs generated in response to suprathreshold monopolar or bipolar electrical stimulation are developed in the brainstem and associated with the activation of the extrapyramidal tract [18, 19, 27, 30–32]. Since it is difficult to induce cerebral infarction in the brainstem by MCAo because of the distribution of blood vessels, the amplitude of MEP corresponding to the extrapyramidal tract associated with the left forelimb of the BMSC group was decreased relatively less, which may imply that the nerve conduction into the extrapyramidal tract at the upper levels in the BMSC group was recovered more than that in the control group. Such phenomenon could be explained with the enhanced corticofugal plasticity after the development of a unilateral lesion in the extrapyramidal tract in the brain [31, 33]. Andrews et al. reported that treatment with human adult bone marrow-derived somatic cell after ischemic stroke in adult rats results in recovery of forelimb function, which is positively correlated with increased axonal outgrowth of the intact, uninjured corticorubraltract [7]. In immunofluorescent staining performed on the day 7, stem cells were detected even in the contralateral external capsule, and thus the effect on the corticofugal plasticity of the ipsilateral side as well as the contralateral side could be considered. On the other hand, the mBMEP latency of the right forelimb in the BMSC group was significantly longer than that in the control group, which was thought to be due to that the stimulation intensity in the BMSC group was relatively stronger than that in the control group, and even if the stimulation intensity was considered, the amplitude difference of the left forelimbs of the two groups was significant.
Such relative recovery could be explained better in bipolar stimulation, and in regard to bsMEP measured in the atlantooccipital membrane, the amplitude of D waves of the BMSC group and the control group was significantly increased than the preoperative baseline values, and the tendency that the amplitude of the BMSC group was lower than the control group was shown; nonetheless, it was not significant (P = .06).
In addition, concerning the BMSC group, the I wave and the bCMEP measured in the left forelimbs were observed in 40%. It could be considered that such recovery of bsMEP and bCMEP in the BMSC group may imply the relative recovery of the subcortical and cortical area. Amassian et al. claimed that the D wave is the spike trigger zone (initial segment) present in the axon, it is generated by the first or deeper nodes in the white matter, or the excitation of the branch formation of the axon collaterals in the gray matter, and the I wave is generated in response to the excitement of the specific thalamocortical projection, corticocortical projection, or intrinsic, tangentially oriented fibers [29]. In addition, Bolay et al. have reported that during reperfusion after temporary MCAo, the D wave was recovered but the I wave was not recovered, the amplitude of D wave became larger after reperfusion, and the MEP in the contralateral paralyzed muscles was not observed [15, 20]. Therefore, such recovery of the I wave and bCMEP implies that BMSC transplant acts to protect the neurons in the cortical area, and as shown in Figure 5, BMSC transplant to the motor cortical area corresponding to forelimbs facilitated the recovery of nerve conduction. In addition, the amplitude of D wave of the two groups was increased in comparison with the preoperative baseline values, which implies that the axonal excitability caused by cerebral infarction is increased, which could be explained as the decrease of the inhibitory synapses in the cortical area [34]. Therefore, the tendency that the BMSC group showed smaller amplitudes than the control group could be considered to indirectly demonstrate the possibility of the relative recovery of the cortical area.
In our study, in adhesive removal tests, differences between the BMSC group and the control group were shown; nonetheless, differences in the treadmill test were not detected, which suggests the association with our MEP results. In other words, the results of mBMEP, bsMEP, and CMEP indirectly suggest that the adhesive removal tests assess primarily the sensation and skilled motor function of forelimbs, and thus significant differences were detected, and the treadmill test is associated with the motor ability of all four limbs. Such differences are considered due to the collateral circulation through the anterior cerebral artery after MCAo. In addition, the I wave and bCMEP were observed after BMSC transplantation, and thus the possibility of the migration of BMSCs to the motor cortical area of forelimbs through the anterior cerebral artery could not be ruled out. The latency of D wave of both groups became shorter, but they were not significantly different, which implies that the distance from the area of the development of D wave to the atlantooccipital membrane was comparable, which shows that the area of the initiation of D wave is similar. Such fact indirectly suggests that up to the day 7 after BMSC transplantation, it could not mediate direct effects to show electrophysiological improvement in subcortical area. However, our results were preliminary data and obtained from a small sample size. Our limitation was that we could not demonstrate the neuroprotective mechanism of BMSC transplatation.
In conclusion, by measuring MEP, we were able to imply that BMSC transplanted to the transient ischemic rat brain could reduce the cerebral infarct volume as well as mediate electrophysiological effects on the motor cortical area and the motor pathway. In addition, it is thought that to elucidate the mechanism of transplanted BMSCs mediating effects on the motor neuron, more studies are required. In the future, in stem cell therapy on the ischemic rat brain, MEP may become an objective marker of the functional recovery.
Conflict of Interest
The authors report no conflicts of interest.
Acknowledgment
The authors thank Hyeun-Chul Park for excellent technical assistance.
References
- 1.Arvidsson A, Collin T, Kirik D, Kokaia Z, Lindvall O. Neuronal replacement from endogenous precursors in the adult brain after stroke. Nature Medicine. 2002;8(9):963–970. doi: 10.1038/nm747. [DOI] [PubMed] [Google Scholar]
- 2.Pavlichenko N, Sokolova I, Vijde S, et al. Mesenchymal stem cells transplantation could be beneficial for treatment of experimental ischemic stroke in rats. Brain Research. 2008;1233:203–213. doi: 10.1016/j.brainres.2008.06.123. [DOI] [PubMed] [Google Scholar]
- 3.Keimpema E, Fokkens MR, Nagy Z, et al. Early transient presence of implanted bone marrow stem cells reduces lesion size after cerebral ischaemia in adult rats. Neuropathology and Applied Neurobiology. 2009;35(1):89–102. doi: 10.1111/j.1365-2990.2008.00961.x. [DOI] [PubMed] [Google Scholar]
- 4.Yoo SW, Kim SS, Lee SY, et al. Mesenchymal stem cells promote proliferation of endogenous neural stem cells and survival of newborn cells in a rat stroke model. Experimental and Molecular Medicine. 2008;40(4):387–397. doi: 10.3858/emm.2008.40.4.387. [DOI] [PMC free article] [PubMed] [Google Scholar]
- 5.Shen LH, Li Y, Chen J, et al. Intracarotid transplantation of bone marrow stromal cells increases axon-myelin remodeling after stroke. Neuroscience. 2006;137(2):393–399. doi: 10.1016/j.neuroscience.2005.08.092. [DOI] [PubMed] [Google Scholar]
- 6.Wu J, Sun Z, Sun HS, et al. Intravenously administered bone marrow cells migrate to damaged brain tissue and improve neural function in ischemic rats. Cell Transplantation. 2008;16(10):993–1005. [PubMed] [Google Scholar]
- 7.Andrews EM, Tsai SY, Johnson SC, et al. Human adult bone marrow-derived somatic cell therapy results in functional recovery and axonal plasticity following stroke in the rat. Experimental Neurology. 2008;211(2):588–592. doi: 10.1016/j.expneurol.2008.02.027. [DOI] [PMC free article] [PubMed] [Google Scholar]
- 8.Iihoshi S, Honmou O, Houkin K, Hashi K, Kocsis JD. A therapeutic window for intravenous administration of autologous bone marrow after cerebral ischemia in adult rats. Brain Research. 2004;1007(1-2):1–9. doi: 10.1016/j.brainres.2003.09.084. [DOI] [PubMed] [Google Scholar]
- 9.Cartmell SM, Gelgor L, Mitchell D. A revised rotarod procedure for measuring the effect of antinociceptive drugs on motor function in the rat. Journal of Pharmacological Methods. 1991;26(2):149–159. doi: 10.1016/0160-5402(91)90063-b. [DOI] [PubMed] [Google Scholar]
- 10.Nogradi A, Vrbova G. Improved motor function of denervated rat hindlimb muscles induced by embryonic spinal cord grafts. European Journal of Neuroscience. 1996;8(10):2198–2203. doi: 10.1111/j.1460-9568.1996.tb00741.x. [DOI] [PubMed] [Google Scholar]
- 11.Westergren H, Farooque M, Olsson Y, Holtz A. Motor function changes in the rat following severe spinal cord injury. Does treatment with moderate systemic hypothermia improve functional outcome? Acta Neurochirurgica. 2000;142(5):567–573. doi: 10.1007/s007010050471. [DOI] [PubMed] [Google Scholar]
- 12.Cho SR, Kim YR, Kang HS, et al. Functional recovery after the transplantation of neurally differentiated mesenchymal stem cells derived from bone barrow in a rat model of spinal cord injury. Cell Transplantation. 2009;18(12):1359–1368. doi: 10.3727/096368909X475329. [DOI] [PubMed] [Google Scholar]
- 13.Ohta M, Suzuki Y, Noda T, et al. Bone marrow stromal cells infused into the cerebrospinal fluid promote functional recovery of the injured rat spinal cord with reduced cavity formation. Experimental Neurology. 2004;187(2):266–278. doi: 10.1016/j.expneurol.2004.01.021. [DOI] [PubMed] [Google Scholar]
- 14.Zurita M, Vaquero J. Functional recovery in chronic paraplegia after bone marrow stromal cells transplantation. NeuroReport. 2004;15(7):1105–1108. doi: 10.1097/00001756-200405190-00004. [DOI] [PubMed] [Google Scholar]
- 15.Bolay H, Gürsoy-Özdemir Y, Ünal I, Dalkara T. Altered mechanisms of motor-evoked potential generation after transient focal cerebral ischemia in the rat: implications for transcranial magnetic stimulation. Brain Research. 2000;873(1):26–33. doi: 10.1016/s0006-8993(00)02466-5. [DOI] [PubMed] [Google Scholar]
- 16.Linden RD, Zhang YP, Burke DA, Hunt MA, Harpring JE, Shields CB. Magnetic motor evoked potential monitoring in the rat. Journal of Neurosurgery. 1999;91(supplement 2):205–210. doi: 10.3171/spi.1999.91.2.0205. [DOI] [PubMed] [Google Scholar]
- 17.Teskey GC, Flynn C, Goertzen CD, Monfils MH, Young NA. Cortical stimulation improves skilled forelimb use following a focal ischemic infarct in the rat. Neurological Research. 2003;25(8):794–800. doi: 10.1179/016164103771953871. [DOI] [PubMed] [Google Scholar]
- 18.Schlag MG, Hopf R, Redl H. Serial recording of sensory, corticomotor, and brainstem-derived motor evoked potentials in the rat. Somatosensory and Motor Research. 2001;18(2):106–116. doi: 10.1080/135578501012006219. [DOI] [PubMed] [Google Scholar]
- 19.Konrad PE, Tacker WA. Suprathreshold brain stimulation activates non-corticospinal motor evoked potentials in cats. Brain Research. 1990;522(1):14–29. doi: 10.1016/0006-8993(90)91572-x. [DOI] [PubMed] [Google Scholar]
- 20.Bolay H, Dalkara T. Mechanisms of motor dysfunction after transient MCA occlusion: persistent transmission failure in cortical synapses is a major determinant. Stroke. 1998;29(9):1988–1993. doi: 10.1161/01.str.29.9.1988. [DOI] [PubMed] [Google Scholar]
- 21.Longa EZ, Weinstein PR, Carlson S, Cummins R. Reversible middle cerebral artery occlusion without craniectomy in rats. Stroke. 1989;20(1):84–91. doi: 10.1161/01.str.20.1.84. [DOI] [PubMed] [Google Scholar]
- 22.Sakatani K, Iizuka H, Young W. Somatosensory evoked potentials in rat cerebral cortex before and after middle cerebral artery occlusion. Stroke. 1990;21(1):124–132. doi: 10.1161/01.str.21.1.124. [DOI] [PubMed] [Google Scholar]
- 23.Sanderson KJ, Welker W, Shambes GM. Reevaluation of motor cortex and of sensorimotor overlap in cerebral cortex of albino rats. Brain Research. 1984;292(2):251–260. doi: 10.1016/0006-8993(84)90761-3. [DOI] [PubMed] [Google Scholar]
- 24.Zandieh S, Hopf R, Redl H, Schlag MG. The effect of ketamine/xylazine anesthesia on sensory and motor evoked potentials in the rat. Spinal Cord. 2003;41(1):16–22. doi: 10.1038/sj.sc.3101400. [DOI] [PubMed] [Google Scholar]
- 25.Grunert HP, Landt O, Zirpel-Giesebrecht M, et al. Trp59 to Tyr substitution enhances the catalytic activity of RNase T1 and of the Tyr to Trp variants in positions 24, 42 and 45. Protein Engineering. 1993;6(7):739–744. doi: 10.1093/protein/6.7.739. [DOI] [PubMed] [Google Scholar]
- 26.Gruner JA, Yee AK. 4-aminopyridine enhances motor evoked potentials following graded spinal cord compression injury in rats. Brain Research. 1999;816(2):446–456. doi: 10.1016/s0006-8993(98)01184-6. [DOI] [PubMed] [Google Scholar]
- 27.Kamida T, Fujiki M, Hori S, Isono M. Conduction pathways of motor evoked potentials following transcranial magnetic stimulation: a rodent study using a ’figure-8’ coil. Muscle and Nerve. 1998;21(6):722–731. doi: 10.1002/(sici)1097-4598(199806)21:6<722::aid-mus3>3.0.co;2-9. [DOI] [PubMed] [Google Scholar]
- 28.Sun T, Schlag MG, Hopf R, Shen Q, Redl H. Brainstem-evoked muscle potentials: their prognostic value in experimental spinal cord injury in the rat. Somatosensory and Motor Research. 2000;17(4):317–324. doi: 10.1080/08990220020002024. [DOI] [PubMed] [Google Scholar]
- 29.Amassian VE, Stewart M, Quirk GJ, Rosenthal JL. Physiological basis of motor effects of a transient stimulus to cerebral cortex. Neurosurgery. 1987;20(1):74–93. [PubMed] [Google Scholar]
- 30.Adamson J, Zappulla RA, Fraser A, Ryder J, Malis LI. Effects of selective spinal cord lesions on the spinal motor evoked potential (MEP) in the rat. Electroencephalography and Clinical Neurophysiology. 1989;74(6):469–480. doi: 10.1016/0168-5597(89)90038-5. [DOI] [PubMed] [Google Scholar]
- 31.Z’Graggen WJ, Metz GAS, Kartje GL, Thallmair M, Schwab ME. Functional recovery and enhanced corticofugal plasticity after unilateral pyramidal tract lesion and blockade of myelin-associated neurite growth inhibitors in adult rats. Journal of Neuroscience. 1998;18(12):4744–4757. doi: 10.1523/JNEUROSCI.18-12-04744.1998. [DOI] [PMC free article] [PubMed] [Google Scholar]
- 32.Fehlings MG, Hurlbert RJ, Tator CH. The electrophysiological assessment of the pyramidal and non-pyramidal tracts of the spinal cord of rats. Electroencephalography and Clinical Neurophysiology. Supplement. 1991;43:287–296. [PubMed] [Google Scholar]
- 33.Kosar E, Fujito Y, Murakami F, Tsukahara N. Morphological and electrophysiological study of sprouting of corticorubral fibers after lesions of the contralateral cerebrum in kitten. Brain Research. 1985;347(2):217–224. doi: 10.1016/0006-8993(85)90180-5. [DOI] [PubMed] [Google Scholar]
- 34.Mittmann T, Qü M, Zilles K, Luhmann HJ. Long-term cellular dysfunction after focal cerebral ischemia: in vitro analyses. Neuroscience. 1998;85(1):15–27. doi: 10.1016/s0306-4522(97)00638-6. [DOI] [PubMed] [Google Scholar]