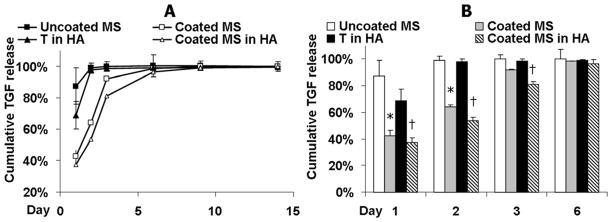
Figure 2.
Release profile over 14 days (A) and 6 days (B) of TGF-β3 encapsulated in bare microspheres (Uncoated MS); coated microspheres (Coated MS); coated microspheres and further photoencapsulated in HA hydrogel (Coated MS in HA) and TGF-β3 directly encapsulated in HA hydrogel (T in HA). Cumulative release is calculated based on the total amount of TGF-β3 detected after 28 days. *p<0.05 vs. “Uncoated MS” at the same timepoints, †p<0.05 vs. “T in HA” (n=3).

