

Abstract
We investigate if adapting to colored plaids produces a McCollough effect on plaids or gratings and if adapting to colored gratings produces a McCollough effect on plaids. We find that the answer is unambiguously yes in all cases, though the strength of the effect differs significantly depending on the inducing and testing stimuli. Furthermore, we show that plaids and gratings can simultaneously support opposite color aftereffects, suggesting that plaids drive a population of cells which are not stimulated by the same component gratings in isolation.
Introduction
The McCollough Effect (ME) is a color aftereffect induced by adapting to colored gratings for several minutes (McCollough, 1965). Thereafter, achromatic gratings of the same orientation appear to be tinged with the complement of the adapting color. Unlike typical adaptation effects, which usually abate in seconds, the ME includes a long-lasting component (Vul, Krizay, & MacLeod, 2008) that can be measured up to 3 months later (Jones & Holding, 1975). Contingent adaptation, of which the ME is the best known example, appears to reflect a general type of plasticity in sensory cortex, because it is seen not only for many different visual features (such as motion, color, and spatial frequency, but is also found in other modalities, such as audition or even touch (see Durgin (1996) for an extensive catalog of features and modalities that can be contingently adapted).
The ME is typically induced by free viewing of two perpendicularly oriented gratings of different colors, for example red horizontal and green vertical. If you take these two gratings that would normally induce an ME and spatially sum them together, you get a red/green/yellow plaid. Strangely, the literature is silent on whether this summed stimulus also leads to a ME; but the customary adoption of the alternating-grating adaptation procedure might suggest that plaid adaptation is relatively ineffective. Years ago, Anstis (Stuart Anstis, personal communication, 2010) investigated whether adapting to colored plaids produced a ME for gratings, and found that they did not. In a conference presentation White (1979) reported a similar experiment, but did not have conclusive results.
An ME from plaid adaptation would be expected purely from the combined adaptation of two orientation-selective color mechanisms. In addition, however, Peirce & Taylor (2006) have argued that there are plaid-selective neural mechanisms, based on experiments using contrast adaptation with achromatic plaids (see also McGovern and Peirce, 2010, and Nam et al. (2009)). Although these experiments did not demonstrate the kind of long-term adaptation that is the hallmark of the ME, if such mechanisms exist, it would be reasonable to expect that they could be contingently adapted.
In the present work we revisit the plaid ME, and also test for possible interactions between orientation and plaid-selective mechanisms. Specifically, we investigate if adapting to colored plaids produces a ME on plaid or grating tests and if adapting to colored gratings produces a ME on plaid tests. We find that the answer is unambiguously yes in all cases, though the strength of the effect differs significantly depending on the inducing and testing stimuli. Furthermore, we show that plaids and gratings can simultaneously support opposite color aftereffects, suggesting a plaid-selective visual mechanism that can be contingently adapted at least somewhat independently from mechanisms tuned to the component gratings.
Experiment 1
We measured orientation-contingent color-aftereffects observed both in gratings and in plaid test stimuli, under three different conditions of pre-adaptation (Fig. 1b): (1) In the grating-adapt condition, which was modeled on the typical McCollough effect inducing procedure, the adapting stimuli were orthogonal red and green gratings, displayed in alternation every two seconds. (2) In a plaid-adapt condition, the luminance profiles of the alternating gratings were summed to form a single colored adapting plaid, which was exposed continuously. (3) In a mixed opposing-adapt condition, we used pairs of alternating gratings of one color/orientation relationship, as in (1), but these were interleaved with periods where a plaid was shown as in (2); this plaid always had the opposite color/orientation relationship from the gratings.
Fig. 1.
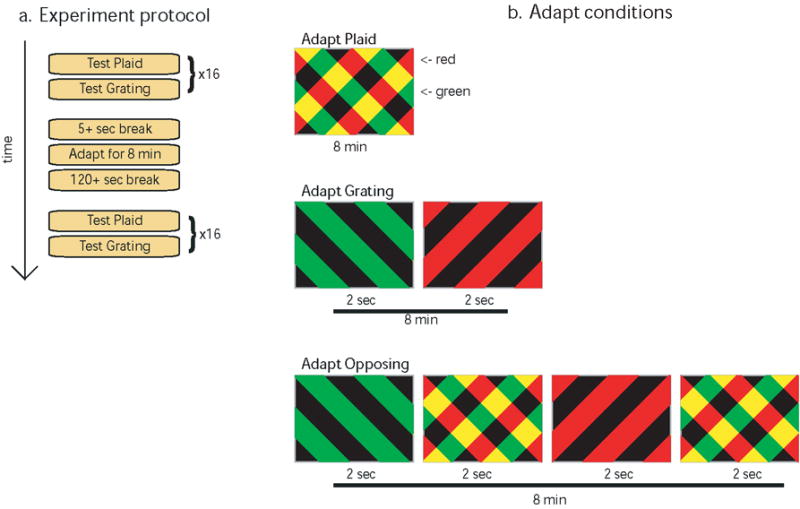
a. Overview of the experiment protocol for each testing session. 32 color nulling trials are run before adapting (interleaving test plaids and gratings), then the subject adapts for 8 minutes in one of the 3 conditions shown in (b), followed by another 32 color nulling trials. b. The three different adaptation conditions. Each rectangle denotes an image shown to the subject; the number immediately below it represents how long that image was shown. If multiple screens were shown during adaptation, the first screen shown is at left, and time progresses to the right. After the final screen, the process loops, beginning at the left, until the adapting sequence has been shown for a total of 8 minutes.
Methods
We ran four subjects: one was the first author and the rest were naive to the purpose of the study. All were experienced psychophysical observers.
Apparatus
Stimuli were presented on a 22” iiyama HM204DT A CRT driven by an NVIDIA GeForce 7600 GT video card at a refresh rate of 75Hz, in a dimly lit room. Display luminance was linearized using a Cambridge Research Systems Bits++ adapter using a 14-bit color lookup table. A UDT photometer was used to select the appropriate lookup table values for gamma compensation, and phosphor spectral energy distributions were measured using a PhotoResearch PR650 spectroradiometer. A chinrest was used to maintain a viewing distance of 48cm. Stimuli were generated and displayed using Matlab running the Psychophysics Toolbox, version 3 (Brainard, 1997; Pelli, 1997) on a Windows XP computer.
Procedure
Overview
Each test session used the following general procedure: First we measured the influence of orientation on perceived color, for both grating and plaid test stimuli, using a nulling procedure. Second, subjects adapted in one of the three different conditions described in detail below for eight minutes. A two minute break followed to allow dissipation of the rapid McCollough component (Vul et al, 2008) (longer breaks were allowed, but typically breaks did not exceed 5 minutes). Finally, the nulling procedure was repeated, for both gratings and plaids, to determine if the adapting condition had shifted subjects’ color perception (see Fig. 1). Sessions took between 45 and 70 minutes, depending on subject.
Subjects completed an average of two sessions for each condition. To reduce order effects when subjects came in for the next session we would adapt them with the opposite of the color/orientation bias used on the previous session. Since sessions were run on separate days we always collected a new set of pre-adapt nulls for each session, rather than reusing the post-adapt nulls from the previous session. The magnitude of the orientation-contingent color aftereffect in each session was measured as the average change between the pre- and post-adaptation color nulls for that session, thus canceling any persisting effect from prior sessions.
Nulling procedure
Each nulling procedure consisted of 32 self-paced trials. There were 2 different types of trials (plaid and grating). 16 of each trial type were included in each nulling procedure, interleaved to reduce order effects. On plaid trials subjects viewed a full-screen plaid; on grating trials two side-by-side gratings were displayed. For both types of trials the subject’s task was to indicate which of the two simultaneously presented orthogonal orientations appeared more red. After each button press a small amount of red was subtracted from that orientation and added to the other, and the result was displayed immediately. Subjects continued making adjustments until the two orthogonal orientations appeared identical in color, at which point they ended the trial. There was a 500ms blank screen between trials.
On the first trial for each stimulus type the initial color/orientation bias was set randomly. Thereafter, each trial was initialized with a color bias that was between 3 and 9 button pushes distant from the previously selected null point for that stimulus (nulls for gratings and plaids were tracked separately). This method ensured that (a) at the start of the trial one orientation was noticeably more red than the other, and (b) that it did not take too long to navigate back to the null point. This minimized the decay in adaptation caused by viewing the nearly neutral test patterns. On virtually all trials subjects adjusted the null point back toward the previous null point, suggesting that if we had used a completely random initial color bias on each trial, or a larger random shift away from the previous color bias, it would have slowed the time to complete the trial, but not change the trial-to-trial variability.
Subjects were free to move their eyes, but were instructed to look at the middle 30% of the screen while making adjustments or adapting. They were told to blink or make additional eye movements whenever their vision started to blur or fade due to fatigue.
Subjects were initially trained on the nulling paradigm without any adaptation, until they were able to make consistent null settings. This typically took 1-2 hours, spread over 2-3 training sessions on separate days. In addition, prior to each testing session subjects completed another brief refresher training session of 8 trials (4 plaids and 4 gratings), which were discarded. Since each testing session had two nulling procedures (pre and post adaptation), there was a total of 64 trials saved per session. Since the trials were self-paced the duration of the nulling procedure varied slightly between sessions for a given subject. There was significantly more variability between subjects, ranging from about 10 to 30 minutes to complete the nulling procedure, but this did not appear to influence the results.
Adapting procedure
Subjects adapted for 8 minutes, in one of 3 conditions (Fig. 1b). In the grating-adapt condition, a full-contrast red grating was shown for 2 seconds, followed by a full contrast green grating of the opposite orientation, for another 2 seconds. This continued in a loop until the session was over. In the plaid-adapt condition, a single, continuously visible plaid was shown for 8 minutes. In the opposing-adapt condition, subjects viewed a sequence of plaids interweaved with gratings with opposite color/orientation pairings (e.g., the orientation that was red in the plaid was green for the grating). Each stimulus was shown full screen for 2 seconds in a loop that repeated every 8 seconds in the following order: green grating; plaid; red grating; plaid. In total, subjects adapted to the plaid stimulus for 4 minutes and the grating stimuli for 4 minutes.
Stimuli
Gratings and plaids were made up of 0.45° wide bars, which filled the screen from edge to edge (45.7° by 36.6°). The bars were rotated +45° and -45° off vertical (Fig. 1) so as to cancel CRT artifacts. The plaid adapt stimulus consisted of a full-intensity red grating added to a full-intensity green grating of the opposite orientation (thus, the intersections were yellow). The grating adapt stimuli consisted of the same component gratings that made up the plaid, but each was shown in isolation, for 2 seconds at a time, in a loop, with zero ISI between orientations. Thus, there was no yellow on the screen, and each orientation had a total exposure time half as long as in the plaid condition.
The nulling procedure for plaids used a full-screen plaid that was the sum of two nearly yellow gratings at half intensity. One orientation would have a small amount of red subtracted from it and an equal amount of green added. The perpendicular orientation had an equal, but opposite color shift. Thus, when added, the intersections of each grating were pure yellow at full intensity, and only the non-overlapping regions had any red/green color bias.
The nulling procedure for gratings split the screen into a left and right half, with the two orientations shown on opposite sides. The two gratings abutted directly at the center of the screen. Which side of the screen was +45° and -45° alternated between trials. On each trial we randomly varied the phase of the gratings (and thus, the exact configuration where they abutted). Subjects were instructed to keep their fixations directly along the abutting region.
Results
To combine data across sessions we analyzed the color nulls according to the orientation that was red during adaptation, which varied across sessions. The strength of the aftereffect is expressed as the difference in red phosphor intensity between pre-adaptation and post-adaptation nulls. Since the ME is a negative aftereffect, to null it more red would have to be added to the post-adapt null, which would be expressed as a positive value in Fig. 2.
Fig. 2.
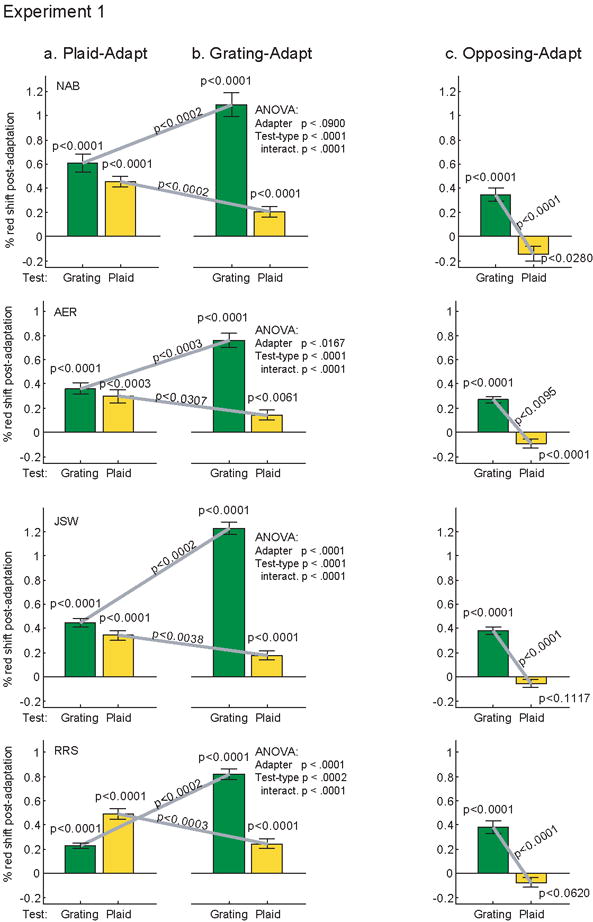
Results of Experiment 1: effect of adapting to (a) a plaid, (b) a grating, or (c) a grating alternating with a plaid of an opposite color/orientation. The aftereffect measure reported is the change in the intensity of the red phosphor between the pre- and post-adaptation null. A 1% change in phosphor intensity corresponds a 0.091% change in L-cone (red) contrast. Error bars denote +/- 1 standard error of the mean. The results of a 2×2 ANOVA on stimuli type (grating, plaid) and adapter (grating, plaid) are shown at the right of (b). All other p values are calculated by t-tests comparing the pre- to post-adaptation nulls, and have been corrected for multiple comparisons using the Bonferroni-Holm method.
To analyze the results for the grating-adapt and plaid-adapt conditions we submitted each subject’s data individually to a 2×2 ANOVA, with factors Adapter (grating or plaid), and Test-type (grating or plaid). We also applied t-tests to further analyze these conditions. To control for multiple comparisons we calculated the Bonferroni–Holm corrected p values for each subject individually (as described in Aickin & Gensler, 1996, see also Holm, 1979), which keeps the probability of a false positive (type-I error) below 0.05. p values from the ANOVA are reported on the right side of Fig. 2 all other p values in the figure are from the corrected t-tests.
All four subjects saw statistically significant color aftereffects for each of the test stimuli under both adapting conditions. This shows that plaids can support MEs, and that both plaids and gratings are effective inducers. These aftereffects were quite different in magnitude, however, as revealed by the ANOVA analysis. All subjects showed a significant main effect of Test-type, because larger aftereffects were seen on grating tests (indeed, this was true for all conditions and subjects, except for subject RRS in the plaid-adapt condition). In 3 of 4 subjects there was also a significant main effect of Adapter, because the grating-adapt condition produced larger aftereffects on average, though this was driven entirely by the large aftereffects on grating tests. As this suggests, there was a significant interaction between factors: (1) the largest effect for plaid tests was found with plaid adapters, and likewise (2) the largest effect for grating tests was found with grating adapters. T-tests comparing the two adapting conditions separately for grating tests and for plaid tests revealed that both (1) and (2) were significant for each of the four subjects.
This interaction suggests that plaids and gratings may be supporting different, but partially overlapping aftereffects. To address this question directly we analyzed the data for the adapt-opposing condition using t-tests corrected with the Bonferroni–Holm procedure (shown in Fig. 2 c). Here, the results are plotted so that an ME from the grating adapt stimuli would produce a positive value, just as in Fig. 2 a-b. Meanwhile, since the plaid is adapted with the opposite color contingency, an ME driven by it would cause a negative post-adapt null value.
Our data show that adapting to a grating of one color contingency and a plaid of the opposite contingency leads to a statistically significant aftereffect on grating tests in the direction expected by adapting to the grating alone. Meanwhile, the aftereffect measured on plaid tests is in the direction expected from adapting to plaids alone; this is significant for the individual data of two of the four subjects, and the other two subjects show the same trend. As indicated in the figure, and as implied by the results for the individual conditions, the difference between effects on plaids and gratings is also highly significant for all subjects.
Discussion
We have shown that both plaids and gratings can induce and support color aftereffects, of significantly different magnitudes. Note that the relative difference in strength between plaid and grating tests cannot be due to the order that the test stimuli were shown. The first test trial was always a plaid, so if the aftereffect decayed on subsequent trials we would expect that plaids should show the largest aftereffect, when the reverse was seen for both adaptation conditions. It is possible, however, that the testing order decreased the difference between plaid and grating tests. Based on Vul, et al. (2008), this effect should be quite small, however, since the long-term component of the ME changes slowly. To estimate this effect, we re-analyzed our data, discarding the results from the first plaid trial, thus giving any advantage to the grating tests. The average difference between tests, however, did not increase or otherwise change appreciably.
The smaller size of the aftereffects induced with plaids likely explains why these effects were missed by previous investigators. Why is the effect so much smaller? It is possible that plaids weakly stimulate neurons that respond to gratings in isolation, thus leading to a smaller aftereffect. This would not explain the interaction effect we found between the plaid-adapt and grating-adapt conditions, nor would it explain the trend we found in the opposing-adapt condition. Instead, gratings and plaids may actually drive different mechanisms which can individually support opposite ME effects. The evidence from the opposing condition is somewhat precarious, however, since it was only significant in 2 of 4 subjects for the plaid adapter, so we ran a follow-up experiment to check this result.
Experiment 2
In Experiment 1 the color aftereffects were on average smaller for plaid adaptation than for grating adaptation, and with plaid tests, plaid adaptation was only slightly more effective than grating adaptation. Thus, one would expect a small effect for plaid tests in the opposing-adapt condition if the effects of grating and plaid adaptation simply add. Indeed, the opposing results are in rough agreement with what would be predicted from subtracting the plaid-adapt results from the grating-adapt results (and dividing by 2 since each stimulus type was only shown for half of the 8-minute adapting period).
In this experiment we made the effect easier to measure by simply increasing the relative adapting time of the plaid, so that the total duration of adapting plaid exposure became twice the total duration of grating exposure.
Methods
We ran three subjects who had participated in Experiment 1 (including the two who had shown a non-significant effect in the opposing condition) and one new subject. Our experiment was identical to the opposing condition in Experiment 1, except for the following change in timing: a complete adapting cycle consisted of 2 seconds of a full-screen +45° grating, 4 seconds of a full-screen plaid, 2 seconds of a full-screen -45° grating, and then another 4 seconds of a full-screen plaid. As in Experiment 1, the plaids and gratings had opposite color/orientation contingency. We also increased the total adaptation time to 10 minutes.
Results and Discussion
The results are plotted in Fig. 3, using the same conventions as in Fig. 2 c. We analyzed the data for each subject individually, using t-tests with the Bonferroni–Holm correction for multiple comparisons. All four subjects showed a statistically significant (but opposite) color aftereffect for both plaid tests and grating tests. In all cases, the color-aftereffect direction was the same as would be expected if the subject had adapted and been tested on the grating or plaid in isolation. This shows that opposite contingent color aftereffects can be simultaneously induced for gratings and plaids.
Fig. 3.
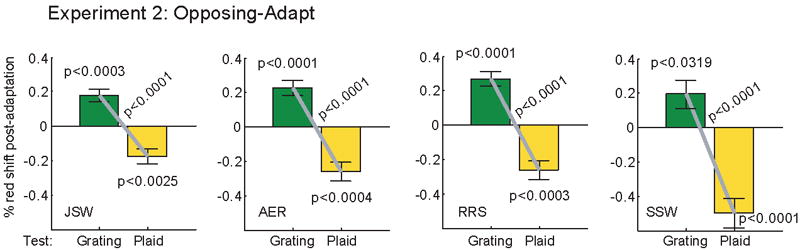
The results of Experiment 2. Figure conventions are the same as Fig 2.
General discussion
Adapting to a plaid induced color aftereffects of roughly equal strength on both plaid and grating tests. Adapting to a grating also induced aftereffects for both types of test stimuli, but the aftereffect was much stronger for grating tests. The after-effect revealed by a plaid test is not just a weaker version of the aftereffect shown by a grating test, because opposite color/orientation aftereffects can be induced simultaneously.
We found that the largest color aftereffects were found for grating tests, independent of the adapting stimulus. This is difficult to explain by solely appealing to the theory that the ME is just another example of associative learning (e.g. Murch, 1976; Allan & Siegal, 1986). By this theory, one would expect that maximizing the similarity between adapt and test stimuli would produce the strongest aftereffect. A more complex theory drawing from neurophysiology may be more successful.
A neuron in visual cortex responds strongly to a grating of its preferred orientation and spatial frequency in isolation, but superimposing a grating of a different orientation will reduce the cell’s response (cross-orientation suppression, Blakemore & Tobin, 1972). A recent study by Busse, Wade, & Carandini (2009) found that adding a perpendicular grating reduces firing rate an average of 23% in cat V1, which seems modest relative to the differences we found between plaids and gratings, but it could at least contribute to our results. To date, neural recordings of this effect only exist for achromatic stimuli, however a recent masking study in humans (Medina & Mullen, 2009) suggest that a similar result holds for superimposed red/green Gabor patches (i.e. plaids), though here the effect is measured in terms of detection thresholds of low-contrast stimuli.
Thus, we can hypothesize that cells responding to chromatic gratings will respond less strongly when that same orientation is part of a plaid pattern. Can some of our results be explained by assuming that plaids and gratings stimulate the same set of neurons, but with different effectiveness? Previous work has shown that high luminance during adaptation, or low luminance during test causes a larger color aftereffect (White, 1976). If this is due to changes in firing rate, then adapting to a plaid should have the same effect as adapting to a lower contrast grating. On this view, adapting with a grating should produce a larger overall effect than adapting with a plaid, independent of test stimuli, as we found. A further prediction, however, is that testing with a grating should reveal less aftereffect than found with the less effective plaid test stimulus. This prediction was not fulfilled: aftereffects tested on plaids were the same or smaller – sometimes much smaller. In addition, as suggested by Experiment 1, and confirmed by Experiment 2, plaids and gratings can support separate color aftereffects, which cross-orientation suppression cannot explain.
The results of the opposing conditions instead suggest that different mechanisms respond to plaids and gratings, and are to some extent independently adapted as well as independently excited. Could this also explain the rest of the results from Experiment 1?
Ignoring for the moment what mechanism would respond selectively to plaids, assume that it adapts to color/orientation contingency. We know from cross-orientation suppression experiments that the grating mechanisms will respond to plaids, albeit more weakly. Leaving aside such particulars as whether the plaid and grating detectors are arranged in series or in parallel, we simply assume that the plaid selective mechanism responds only to plaids, and that the final color-aftereffect for plaids is a weighted average of both mechanisms. With these assumptions, all of our results can be explained.
Adapting to a plaid should cause contingent adaptation for both plaid and grating mechanisms since it stimulates both. Thereafter, a grating test should exhibit an ME, but weaker than if a grating alone had been used as an adapter, due to cross-orientation suppression during adaptation. Meanwhile, a plaid test stimulates both the grating mechanism and the relatively unaffected plaid mechanism and the color-aftereffect is the weighted combination of the two mechanisms.
Adapting to a grating induces a color aftereffect in the grating mechanism, which is seen at full strength for a test grating. Some color aftereffect is also seen on the plaid test because it also stimulates the grating mechanism, but the effect is weaker because no color aftereffect has been induced in the plaid mechanism.
Finally, when opposing color/orientation pairs are used to adapt gratings and plaids at the same time, differing color aftereffects are induced for each mechanism. The effect for plaid tests would be weaker, however, since a plaid test will stimulate both the grating and plaid mechanisms, which have opposite color/orientation aftereffects.
Thus, our results are compatible with the assumption that there is a plaid-selective mechanism. This mechanism may not be exclusively tuned to plaids, however. For instance, it could be responding to the overlap of two transparent surfaces, or to the angle of the intersection between the component gratings. MEs dependent on curvature (Riggs, 1973) and angle (White & Riggs, 1974) have been reported in the literature. Subsequent experiments by Sigel & Nachmias (1975), and Hayman & Allan (1980) refuted both of these findings, showing that they could be explained by local orientation dependent aftereffects and patterns of visual fixation. Recently Hancock & Peirce (2008) showed that apparent curvature can be influenced by adaptation, in a manner consistent with the existence of curvature dependent mechanisms. The same experiments, however, did not show any evidence of contrast adaptation in these putative mechanisms. This is consistent with the earlier work, since contrast adaptation is somewhat analogous to an achromatic ME. These experiments cast doubt on angle or curvature contingency as an explanation of our current results.
Our invocation of pattern selectivity for plaids is foreshadowed in other reports of 2-dimensional pattern selectivity for color aftereffects. Emerson, Humphrey, & Dodwell (1985) reported that different members of the Lie transform group (such as radial, concentric, or hyperbolic gratings) can elicit different MEs, even though locally these stimuli are made up of the same orientations and spatial frequencies (see also Dodwell & O’Shea, 1987). They argue this shows that the ME elicited depends on the global organization of the figure. This conclusion is controversial, however, and more recently McCollough (2000) reported that induction with pairs of these figures does not lead to a single color percept for each global organization; rather there is spatial variation in perceived color aftereffects, consistent with local factors (i.e. orientation and spatial frequency) accounting for most if not all of the effect (see also Broerse & O’Shea, 1995). Either this is incorrect and global 2-D organization can influence the MEs formed (thus explaining our result as well), or the Lie group is not a global organization that can support color after-effects, but plaids are. Of these two explanations, the plaid-selective mechanism seems more plausible, but more empirical evidence may be needed to settle the question conclusively.
Other researchers have also posited a plaid-selective mechanism, at least in the achromatic domain. Peirce & Taylor (2006) measured apparent contrast for plaids after brief adaption to a sequence of plaids with different component orientations. They tested using the set of all possible plaids constructed from the adapted component orientations, but only found the greatest effect when the test plaids matched the adapting plaids. This suggests visual mechanisms tuned to specific conjunctions of orientations. A later study by McGovern and Peirce (2010) also measured contrast adaptation, using grating tests after plaid adapters and vice versa. They found that the effectiveness of the adapting stimuli depended on the contrast of the test stimuli. At high Michelson contrast (0.4 - 0.6), they found clear evidence that plaid adaptation reduced the contrast of a plaid test, but had little effect on tests using the grating components of the plaid. wever, only gratings showed any evidence of contrast reduction, for either type of adapter. Since our test stimuli were always full luminance contrast, but very low chromatic contrast it is unclear how to compare the influence of contrast between our experiments, though at first glance it seems like our results are rather different. It may be interesting in future work to measure the effect of contrast (both chromatic and achromatic) on the plaid ME.
Additional converging evidence for a plaid-selective mechanism comes from a visual search experiment. Nam et al. (2009) showed that plaid targets “pop-out” amongst gratings, which they suggest is due to pre-attentive plaid-selective mechanisms. Furthermore, they only found pop-out when the spatial frequencies of the plaid’s component gratings matched, suggesting this is necessary to activate the mechanism, paralleling contrast adaptation results from Hancock, McGovern, & Peirce, (2010). While the cause of visual search pop-out is somewhat controversial, their results do suggest there is something special about plaids.
These experiments all suggest a plaid-selective mechanism, but do not reveal what exact feature of plaids drive it. It is worth noting that JPEG, the most widely used image compression technique, uses the 2-D discrete cosine transform basis set, which is formed by point-wise multiplication of gratings of opposite orientation. Many of these patterns are plaid-like. Perhaps the efficiency of this kind of representation means that something similar is also used by the visual system? Further adaptation experiments testing different ways of combining orientations may be able to isolate exactly what feature of plaids are driving the putative plaid-selective mechanism.
Acknowledgments
Supported by NIH Grant EY01711. Alan Robinson also was supported by the Temporal Dynamics of Learning Center at UCSD (NSF Science of Learning Center SBE-0542013).
References
- Aickin M, Gensler H. Adjusting for multiple testing when reporting research results: The Bonferroni vs Holm methods. American Journal of Public Health. 1996;86:726–728. doi: 10.2105/ajph.86.5.726. [DOI] [PMC free article] [PubMed] [Google Scholar]
- Allan LG, Siegal S. McCollough effects as conditioned responses: Reply to Skowbo. Psychological bulletin. 1986;100:388–393. [Google Scholar]
- Blakemore C, Tobin E. Lateral inhibition between orientation detectors in the cat’s visual cortex. Experimental Brain Research. 1972;15:439–440. doi: 10.1007/BF00234129. [DOI] [PubMed] [Google Scholar]
- Broerse J, O’Shea RP. Local and global factors in spatially-contingent coloured aftereffects. Vision Research. 1995;35(2):207–226. doi: 10.1016/0042-6989(94)00131-5. [DOI] [PubMed] [Google Scholar]
- Busse L, Wade AR, Carandini M. Representation of Concurrent Stimuli by Population Activity in Visual Cortex. Neuron. 2009;64:931–942. doi: 10.1016/j.neuron.2009.11.004. [DOI] [PMC free article] [PubMed] [Google Scholar]
- Dodwell PC, O’Shea RP. Global factors generate the McCollough effect. Vision Research. 1987;27:569–80. doi: 10.1016/0042-6989(87)90043-5. [DOI] [PubMed] [Google Scholar]
- Durgin FH. Visual aftereffect of texture density contingent on color of frame. Perception & Psychophysics. 1996;58:207–223. doi: 10.3758/bf03211876. [DOI] [PubMed] [Google Scholar]
- Emerson VF, Humphrey GK, Dodwell PC. Colored aftereffects contingent on patterns generated by Lie transformation groups. Perception & Psychophysics. 1985;37:155–162. doi: 10.3758/bf03202851. [DOI] [PubMed] [Google Scholar]
- Hancock S, Peirce JW. Selective mechanisms for simple contours revealed by compound adaptation. Journal of Vision. 2008;8(7):11, 1–10. doi: 10.1167/8.7.11. [DOI] [PMC free article] [PubMed] [Google Scholar]
- Hancock S, McGovern D, Peirce JW. Ameliorating the combinatorial explosion with spatial frequency-matched combinations of V1 outputs. Journal of Vision. 2010;10(8):7, 1–14. doi: 10.1167/10.8.7. [DOI] [PMC free article] [PubMed] [Google Scholar]
- Hayman CAG, Allan LG. A reevaluation of angle-contingent color aftereffects. Perception and Psychophysics. 1980;28:61–67. doi: 10.3758/bf03204316. [DOI] [PubMed] [Google Scholar]
- Holm S. A simple sequentially rejective multiple test procedure. Scandinavian Journal of Statistics. 1979;6:65–70. [Google Scholar]
- Jones PD, Holding DH. Extremely long-term persistence of the McCollough effect. Journal of Experimental Psychology: Human Perception & Performance. 1975;1:323–327. doi: 10.1037//0096-1523.1.4.323. [DOI] [PubMed] [Google Scholar]
- McCollough C. Color adaptation of edge-detectors in the human visual system. Science. 1965;149:1115–1116. doi: 10.1126/science.149.3688.1115. [DOI] [PubMed] [Google Scholar]
- McCollough C. Do McCollough effects provide evidence for global pattern processing? Perception and Psychophysics. 2000;62:350–62. doi: 10.3758/bf03205555. [DOI] [PubMed] [Google Scholar]
- McGovern D, Peirce JW. The spatial characteristics of plaid-form-selective mechanisms. Vision Research. 2010;50(8):796–804. doi: 10.1016/j.visres.2010.01.018. [DOI] [PMC free article] [PubMed] [Google Scholar]
- Medina JM, Mullen KT. Cross-orientation masking in human color vision. Journal of vision. 2009;920(3):1–16. doi: 10.1167/9.3.20. [DOI] [PubMed] [Google Scholar]
- Murch GM. Classical conditioning of the McCollough effect: Temporal parameters. Vision Research. 1976;16:615–619. doi: 10.1016/0042-6989(76)90008-0. [DOI] [PubMed] [Google Scholar]
- Nam J, Solomon JA, Morgan MJ, Wright CE, Chubb C. Coherent plaids are preattentively more than the sum of their parts. Attention, Perception, & Psychophysics. 2009;71(7):1469–1477. doi: 10.3758/APP.71.7.1469. [DOI] [PubMed] [Google Scholar]
- Peirce JW, Taylor LJ. Selective mechanisms for complex visual patterns revealed by adaptation. Neuroscience. 2006;141:15–18. doi: 10.1016/j.neuroscience.2006.04.039. [DOI] [PubMed] [Google Scholar]
- Riggs LA. Curvature as a feature of pattern vision. Science. 1973;181:1070–1072. doi: 10.1126/science.181.4104.1070. [DOI] [PubMed] [Google Scholar]
- Sigel C, Nachmias J. A re-evaluation of curvature-specific chromatic aftereffects. Vision Research. 1975;15:829–836. doi: 10.1016/0042-6989(75)90262-x. [DOI] [PubMed] [Google Scholar]
- Skowbo D. Are McCollough effects conditioned responses? Psychological bulletin. 1984;96(2):215–226. [PubMed] [Google Scholar]
- Vul E, Krizay E, MacLeod DIA. The McCollough effect reflects permanent and transient adaptation in early visual cortex. Journal of Vision. 2008;8(12):1–12. doi: 10.1167/8.12.4. [DOI] [PubMed] [Google Scholar]
- White KD, Riggs LA. Angle-contingent color aftereffects. Vision Research. 1974;14:1147–1154. doi: 10.1016/0042-6989(74)90211-9. [DOI] [PubMed] [Google Scholar]
- White KD. Luminance as a parameter in the establishment and testing of the McCollough effect. Vision Research. 1976;16:297–302. doi: 10.1016/0042-6989(76)90113-9. [DOI] [PubMed] [Google Scholar]
- White KD. Contingent aftereffects, “plaid patterns,” and spatial filtering; Paper presented at the meeting of the Optical Society of America; Rochester, NY. 1979. [Google Scholar]