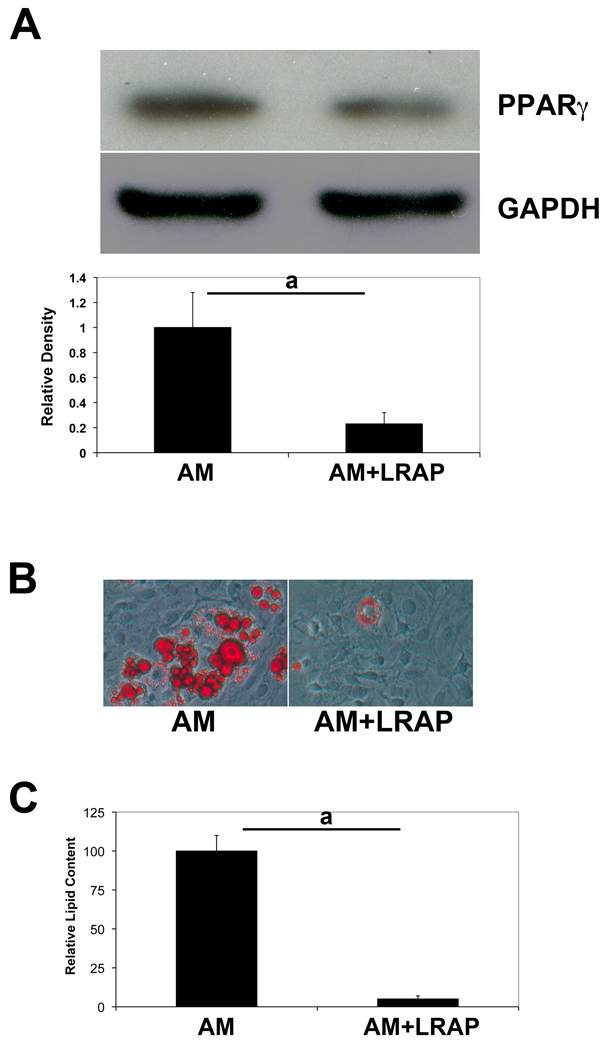
Figure 2. LRAP inhibits adipogenesis of ST2 cells.
ST2 cells were induced to adipogenesis in the presence or absence of LRAP (10 ng/ml). (A) Western blot analysis of PPARγ. GAPDH was used as an internal control. Band intensity ratio was calculated by normalizing the band intensity for each sample with the band intensity of GAPDH. (B) Oil Red O staining of ST2 cells. “AM”: cells induced to adipogenic differentiation in the absence of LRAP; “AM+LRAP”: cells induced to adipogenic differentiation in the presence of LRAP. (C) Quantification of triglyceride and lipid deposition in cells induced to adipogenic differentiation. The graphs represent mean±SD (a: P<0.01).

