

Abstract
Lysophosphatidic acid (LPA) is a phospholipid mediator that plays multiple cellular functions by acting through G protein-coupled LPA receptors.LPAs are known to be key mediators in inflammation,and several lines of evidence suggest a role for LPAs in inflammatory periodontal diseases. A simple and sensitive liquid chromatography coupled with tandem mass spectrometry (LC-MS/MS) method has been developed and validated to quantify LPA species (LPA 18:0, LPA 16:0, LPA 18:1 and LPA 20:4) in human saliva and gingival crevicular fluid (GCF). LPA 17:0 was used as an internal standard and the LPA species were extracted from saliva by liquid-liquid extraction using butanol. Chromatography was performed using a Macherey-Nagel NUCLEODUR® C8 Gravity Column (125mm × 2.0mm ID) with a mixture of methanol/water: 75/25 (v/v) containing 0.5% formic acid and 5mM ammonium formate (mobile Phase A) and methanol/water : 99/0.5 (v/v) containing 0.5% formic acid and 5mM ammonium formate (mobile phase B) at a flow rate of 0.5 mL/min. LPAs were detected by a linear ion trap-triple quadrupole mass spectrometer with a total run time of 8.5 min. The limit of quantification (LOQ) in saliva was 1 ng/mL for all LPA species and the method was validatedover the range of 1-200 ng/mL. The method was validated in GCF over the ranges of 10-500 ng/mL for LPA 18:0 and LPA 16:0, and 5-500 ng/mL for LPA 18:1 and LPA 20:4. This sensitive LC-MS/MS assay was successfully applied to obtain quantitative data of individual LPA levels from control subjects and patients with various periodontal diseases. All four LPA species were consistently elevated in samples obtained from periodontal diseases, which supports a role of LPAs in thepathogenesis of periodontal diseases.
Keywords: Lysophosphatidic acid, LC-MS/MS, Periodontitis, Saliva, GCF
1. Introduction
Lysophosphatidic acids (LPAs) are one of the simplest phospholipids, which consist of a glycerol backbone, a single fatty acid chain and a phosphate group. LPAs are recognized as pleiotropic extracellular lipid mediators with growth-factor-like activities for many cell types [1]. LPAs can be synthesized intracellularly by glycerol-3-phosphate acyl-transferase or monoacyl glycerol kinase via various highly regulated pathways[2, 3]. In addition, LPAs can be produced extracellularly through the hydrolysis of phosphatidic acid and lysophospholipids by phospholipase A1/A2, and lysophospholipase D (autotaxin), respectively[1, 4, 5]. LPAs act as growth factors that stimulate cell proliferation, migration, and survival. LPAs inducethese multiple cellular responses by acting through specific G protein-coupled LPA receptors (LPAR1-7)[1, 6, 7].
LPAs are known inflammatory mediators that regulate the expression of several genes involved in airway inflammatory diseases[8, 9], rheumatoid arthritis[10], atherosclerosis [11], and periodontitis[12]. Periodontal disease is a chronic inflammatory disease of the periodontium that leads to erosion of the attachment apparatus and supporting bone for the teeth and is one of the most common chronic infectious diseases of humans[13]. Platelets are activated in periodontitis due to the local inflammation and tissue destruction, which leads to the overproduction of LPAs. Therefore, pathological levels of LPAs can be potentially generated in the gingival crevice microenvironment, which may contribute to the pathogenesis and progression of periodontal diseases [12, 14, 15].
Sugiura et al. [16] first reported the presence of significant amounts of LPAs in normal human saliva, and these LPA levels were comparable to LPA levels in plasma.At these physiological levels, LPAs were shown to accelerate the growth and enhance the survival of cells derived from human esophagus, pharynx, and tongue.In addition, the LPA receptors (LPAR) LPA1, LPA2, and LPA3 are expressed by human gingival fibroblasts (GF) and periodontal ligament fibroblasts (PDLF)[14, 17]. Therefore, several lines of evidence support a role for LPAs in the pathogenesis of periodontal diseases.
Wound-healing responses are associated with changes in intracellular calcium, which play an important role in cell proliferation;LPA regulates these intracellular Ca2+ signaling responses via its cognate LPARs[18]. Intracellular calcium levels increasein PDLF and GF in response to saturated LPA species (LPA 18:0 and LPA 16:0), whereas the unsaturated LPA species (LPA 18:1) does not significantly stimulate intracellular calcium production, especially in PDLFs [17]. Because of the differences in the responses produced by various LPAs, it is thus important to detect individual LPA species rather than total LPAs.
Therefore, it is of a particular interest for us to quantify individual LPAs in saliva and in gingival crevicular fluid (GCF). The gingival tissues form a protective, looselyadherent cuff around each tooth. The gingivalconnective tissues exude a biological fluid intothe crevice between this cuff and the tooth knownas the GCF [19].
The various roles of individual LPA species that may act as regulatory mediators in many pathophysiological conditions triggeredefforts to apply various analytical techniques to quantify LPAs in biological fluids and tissues.Several analytical methods have been used previously for the determination of LPAs in biological samples, including capillary electrophoresis [20], radioenzymatic assays [21], gas chromatography [16, 22], and HPLC with evaporative light-scattering detection[23]. The limitations of these methods include the quantification of total LPA rather than individual LPA species,the requirement of complex and time-consuming sample preparation such as thin-layer chromatography (TLC) prior to analysis, or/and complex sample derivatization procedures.
The persistent need for rapid and sensitive methods has motivated efforts to use liquid chromatography-tandem mass spectrometry (LC-MS/MS) for LPA analysis in biological fluids. The selectivity and sensitivity provided by LC-MS/MS makes it the method of choice to quantify complex group of compounds such as LPAs in biological matrices. Several methods have been developed to quantify LPAs using LC-MS/MS. Most of the methods have been developed for determination of LPAs in human plasma[24-29]. A method using GC-MS to quantify LPAs in human saliva was reported [16], but it requires laborious derivatization procedures for sample analysis. To the best of our knowledge, there are currently no LC-MS/MS methods developed and validated for the quantification of LPAs in human saliva and GCF. Therefore, we have developed and validated a sensitive and selective LC-MS/MS method for the quantification of the major LPA species (18:0, 16:0, 18:1, 20:4) in human saliva and GCF. Furthermore, the method was applied to compare the LPA profile in saliva and GCF from healthy subjects and patients with various degrees of periodontal disease.
2. Methods and materials
2.1. Chemicals and reagents
LPA 18:0, LPA 16:0, LPA 18:1, LPA 20:4 and LPA 17:0 were purchased from Avanti Polar Lipids (Alabaster, AL, USA). HPLC grade methanol, 1-butanol,Ethyl alcohol, hydrochloric acid (37 %v/v), ammonium formate, and formic acid were purchased from Fisher Scientific (Fair Lawn, NJ). Activated charcoal was obtained from Sigma–Aldrich (St. Louis, MO). 0.22 μm nylon filters were purchased from Phenomenex (Torrance, CA). Absorbent Paper Points (#25, for endodontics) were purchased from Freud-Carson (Flanders, NJ).
2.2. Instrumentation
A Waters ACQUITY ultra-performance liquid chromatography (UPLC) system (Waters, Milford, MA) coupled to a 4000 Q TRAP®quadrupole linear ion trap hybrid mass spectrometer with an electrospray ionization (ESI) source (Applied Biosystems, MDS Sciex, Foster City, CA) was used throughout. The UPLC was controlled by Empower Pro 6.0 (Waters, Milford, MA) and MS system was controlled by Analyst 1.4.2 software (Applied Biosystems, MDS Sciex, Foster City, CA).All chromatographic separations were performed with a Macherey-Nagel NUCLEODUR® C8 Gravity Column (125mm × 2.0mm ID, 5μm particles) equipped with an ACQUITY UPLC C18 guard column (Waters, Milford, MA).The organic solvent obtained from sample extraction was evaporated using a Universal Vacuum System 400 (Thermo Scientific, Milford, MA).
2.3. Liquid chromatographic and mass spectrometric conditions
Mobile phase A consisted of methanol/water: 75/25 (v/v) containing 0.5% formic acid and 5mM ammonium formate. Mobile phase B comprised of methanol/water/formic acid: 99/0.5/0.5 (v/v) and 5mM ammonium formate.The chromatographic separation was achieved by gradient elution. The initial mobile phase composition was 100% A for the first 1 min and was gradually changed to 100% B over 1 min and then held constant at 100% B for 2.5 min. The mobile phase was then reset to 100% A over 0.5 min and the column was equilibrated under these conditions for 3.5 min. The total run time was 8.5 min and the injection volume of all samples was 10 μl.The column temperature was set at 23 °C and a total flow rate of0.5mL/min was used.
Mass spectrometer parameters, such as temperature, voltage, and nitrogen gas pressure were optimized by infusing each analyte and the internal standard (LPA 17:0) using a 10 μg/ml solution in MeOH via a Harvard ‘22’ standard infusion syringe pump (Harvard Apparatus, South Natick, MA, USA). Analytes and internal standard (IS) were detected in the negative ionization mode and the following settings were optimized for achieving highest signal intensity: ion spray voltage:-4000 V, source temperature: 700 °C, curtain gas: 10, gas-1: 40, gas-2: 30, collision gas pressure (nitrogen): medium, Q1/Q3 resolution: high, and interface heater: on.The MRM transitions for parent ions of LPAs 18:0, 16:0, 18:1, 20:4, and 17:0 were 437.1m/z, 409.0 m/z, 435.1m/z, 457.1 m/z, and 423 m/z respectively. The most abundant product ion for all LPAs was 152.8 m/z. The optimized collision energies were -32, -30, -33, -30, and -30 eV for LPA 18:0, 16:0, 18:1, 20:4, and 17:0, respectively. The declustering potential was -80 V and the entrance potential was set to 10 V for all LPAs. The cell exit potentials were -7, -7, -5, -7, and -1 for LPA 18:0, 16:0, 18:1, 20:4, and 17:0, respectively.
2.4. Preparation of standard solutions and calibration curves
Control human saliva was incubated with a 100 mg/mL activated charcoal for 1h at room temperature to remove the high levels of endogenous LPAs from the matrix. The saliva-charcoal mixture was centrifuged at 12,500 g for 10 min and the supernatant was aspirated and filtered using a 0.22 μm nylon filter. The filtrate obtained from the stripped saliva matrix was used for preparing the LPA calibration curves. 20 μl of stripped saliva matrix was 25-fold diluted with deionized water and then spiked with 10 μl of the appropriate LPA standard solution containing LPA 17:0 (IS) for constructing calibration curves within the range of 1-200 ng/mL . The final concentration of internal standard in the calibration curve was 240 ng/mL. Two ml of acidified 1-butanol (0.12025 %v/v HCl in 1-butanol) was added to the spiked saliva matrix. The samples were incubated for 15 min, centrifuged at 12,500g for 10 min at 4 °C, and the resulting supernatants were collected. The remaining residues were extracted again with 1ml of water-saturated 1-butanol and the supernatants from both extraction steps were pooled, evaporated under vacuum, and reconstituted in a 100 μl methanol. Water-saturated 1-butanol was prepared by collecting the supernatant resulting from mixing water and 1-butanol in the ratio of 1:2.
For GCF calibration curve, the spiking solutions made were 25-fold higher than the final concentration. The spiking solutions were made accordingly so that the final concentrations in the calibration curve are within the dynamic range of 5-500 ng/ml. 2 μl of spiking solution was added to 4 μl of saliva and the solution was siphoned by the paper points. The paper points were dried at room temperature for 2 hr. Paper points were then incubated for 1 hr with continuous shaking in 2 mL of acidified 1-butanol containing IS (LPA 17:0) at a final concentration of 240 ng/mL. Samples were centrifuged at 12,500g for 10 min at 4 °C and the resulting supernatants were collected. The supernatants were evaporated under vacuum and reconstituted in 50 μl MeOH for LC-MS/MS analysis.
2.5. Sample collection
Saliva was collected at the same time of day from ten consenting donors of both genders: healthy controls (ages 35-65) and patients (ages 35-70) with mixed mild/moderate and moderate/severe periodontitis areasaccording to the classification of American Academy of Periodontology[30], using a Creighton University IRB-approved protocol. Any sample containing any trace of blood was discarded. All samples were centrifuged at 14,000g for 2 min to remove cells/debris, and the supernatants were collected and frozen at -80 °C until analysis by LC-MS/MS.
Gingival Crevicular Fluid (GCF) was collected from subjects by using #25 endodontic paper points. The GCF migrates from the crevice into the paper point through capillary action. The points were cut off into a 1.5 ml microfuge tube at the level where the GCF absorbed to. As for the collection of saliva, points showing any traces of blood were discarded. Sample volume was calibrated against the length of quadruplicate control paper points used to absorb 0.5 -8 μl (in 0.5 μl increments)of charcoal stripped saliva. The volume of the fluid collected on all points was calculated by digital measurement of the distance that the GCF migrated along the paper point with a Mitutoyo Solar Absolute Digimatic digital meter. The points containing GCF samples were then dried at room temperature for 2 hr and stored at -80 °C until analysis by LC-MS/MS.
2.6. Sample preparation
Twentyμl of saliva samples were 25-fold diluted with deionized water and spiked with internal standard (LPA 17:0) at a final concentration of 240 ng/mL. Two ml of acidified 1-butanol was added to samples and extracted as previously described in section 2.4.
For analysis of GCF samples, paper points were incubated for 1 hr at room temperature with continuous shaking in 2 mL of acidified 1-butanol containing IS (LPA 17:0) at a final concentration of 240 ng/mL and extracted as previously described in section 2.4.
2.7. Method validation
The method was validated using 5 QC points for each calibration curve. Calibration curves were prepared in charcoal-treated saliva using 10 points within the range of 1-200ng/mL. For saliva samples, the dynamic range was 1-200 ng/mL and the concentrations of the QC points were 1, 3, 20, 150, and 200 ng/mL. For GCF samples, the dynamic range was 10-500 ng/mL for LPA 18:0 and LPA 16:0, and 5-500 ng/mL for LPA 18:1 and LPA 20:4. The concentrations of QC points for GCF were (10, 20, 50, 400, and 500 ng/mL) for LPA 18:0 and LPA 16:0; and (5, 10, 50, 400, and 500 ng/mL) for LPA 18:1 and LPA 20:4. Five replicates of each QC point were analyzed each day to determine the intra- and inter-day accuracy and precision of the method. This process was repeated 3 times over 3 days in order to determine the intra- and inter-day accuracy and precision using freshly prepared calibration curves.Intra-day accuracy and precision were calculated from the % bias [% (measured–theoretical)/theoretical concentration] and relative standard deviation [%R.S.D. = % standard deviation/mean], respectively, for the 5 replicates of each QC point. Inter-day accuracy and precision were calculated similarly for the 15 replicates of each QC point pooled from the 3 validation runs. The absolute recovery and relative recovery were determined for each of the 5 QC points. Absolute recovery was calculated by comparing the peak area of samples spiked pre-extraction to the peak area of samples in untreated neat solution (methanol). Relative recovery was calculated by comparing the peak area of samples spiked pre-extraction to the peak area of samples spiked post-extraction. Stability of analytes in neat solution (methanol) was determined on the bench and in the -20 °C freezer at 2 ng/mL and 20 ng/mL concentrations. The stability of the saliva extracts was determined in the autosampler at 2 ng/mL and 20 ng/mL.
3. Results and discussion
3.1. LC condition optimization
Different columns and mobile phases were evaluated in order to achieve a desirable peak shape and high sensitivity for all analytes and IS. The addition of 5mM ammonium formate and 0.5% formic acid to both aqueous (mobile phase A) and organic (mobile phase B) mobile phases markedly increased the signal intensity and improved the peak shape of all analytes. Fig. 1 shows a representative chromatogram of LPAs 18:0, 16:0, 18:1, 20:4 and 17:0 (IS) in a human saliva sample obtained from one of the subjects participating in the study. Wash conditions were optimized to reduce the high carry over associated with LPA analysis under final chromatography conditions. Using 5ml ethanol followed by 5ml 75% methanol in water to wash the UPLC injection valve and the syringe markedly reduced the carry over effect. Under the final wash conditions, the carryover was 0.6%, 0.2%, 0.3%, and 0.1% for LPA 18:0, LPA 16:0, LPA 18:1, and LPA 20:4, respectively.
Fig.1.
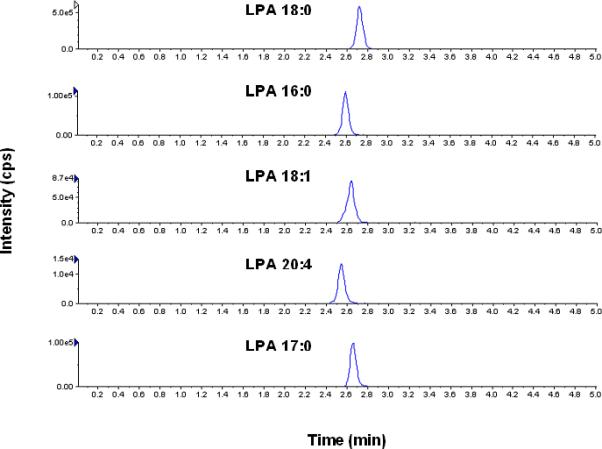
Representative chromatogram of LPAs in a human saliva sample under the final chromatography and detection conditions.
3.2. Sample extraction optimization
Several extraction procedures were previously used for extraction of LPA species from biological samples. In the current study, we found that liquid-liquid extraction with neutral 1-butanol yielded a high recovery of LPA 18:0 (~90%), whereas it yielded very low recovery (~44-54%) of all other LPA species (LPA 16:0, LPA 18:1, and LPA 20:4). Adjusting the pH with an acid such as HCl significantly improved the extraction recovery to >70% for all analytes. Therefore, acidified 1-butanol was used for extracting LPAs from saliva samples. Tables 1 (a) and 1 (b) summarize the extraction recovery of all 4 LPAs from saliva and GCF, respectively. The relative recovery was examined in order to evaluate the matrix effect from saliva. The relative recoveries of all LPAs in both matrices were ≥ 100% indicating an ion enhancement rather than an ion suppression effect (data not shown). Therefore, the low recovery of LPAs from the paper points (~20%) is not due to any matrix effect and is rather related to extraction efficiency. Because of the low recovery of our extraction procedure, the LOQ of LPAs in paper points was 5-10 times higher than that in saliva samples. Preparing the calibration curve in the same biological matrices to be analyzed compensates for loss of analytes during the extraction procedure and ion suppression in the ESI, which results from the co-eluting endogenous components of the matrix. Because LPAs are endogenous compounds, blank matrices free from LPAs are not available. Therefore, the method of standard addition was investigated. Calibration curves were prepared in the biological matrix (human saliva) and the endogenous levels of LPAs in the blank samples (area ratio of analyte/IS) were subtracted [31]. However, this approach yielded very poor accuracy and precision for the analysis of human saliva samples because of the presence of high levels of endogenous LPAs. Therefore, activated charcoal was used to remove LPAs from the matrix [32, 33]. Although the saliva matrix was not completely stripped from all LPAs, only trace levels of endogenous LPAs remained after treatment with activated charcoal. The peak area of the remaining trace levels of LPAs were subtracted from the peak area of the calibration curve standards, which allowed the construction of calibration curves with high accuracy and precision.
Table 1.
Absolute recoveries of LPAs from (a) saliva and (b) loaded paper points at various QC concentrations. Data are presented as average of 5 QC concentrations ± %RSD.
| (a) | |||||
|---|---|---|---|---|---|
| QC1 | QC2 | QC3 | QC4 | QC5 | |
| Analyte | 1 ng/mL | 3 ng/mL | 20 ng/mL | 150 ng/mL | 200 ng/mL |
| LPA 18:0 | 97.1 ± 13.7 | 99.3 ± 16.0 | 107.0 ± 9.8 | 86.2 ± 13.8 | 86.5 ± 15.3 |
| LPA 16:0 | 90.8 ± 8.4 | 86.9 ± 15.6 | 98.6 ± 7.8 | 77.8 ± 8.7 | 77.0 ± 15.3 |
| LPA 18:1 | 82.4 ± 8.8 | 71.9 ± 5.8 | 87.6 ± 4.0 | 69.9 ± 11.0 | 77.6 ± 6.1 |
| LPA 20:4 | 69.9 ± 5.3 | 74.8 ± 5.4 | 82.8 ± 5.6 | 70.1 ± 10.3 | 70.1 ± 4.8 |
| (b) | |||||
|---|---|---|---|---|---|
| QC1 | QC2 | QC3 | QC4 | QC5 | |
| Analyte | 10 ng/mL | 20 ng/mL | 50 ng/mL | 400 ng/mL | 500 ng/mL |
| LPA 18:0 | 14.2 ± 12.8 | 16.7 ± 10.2 | 23.8 ± 14.0 | 21.9 ± 3.7 | 23.9 ± 8.9 |
| LPA 16:0 | 14.6 ± 6.9 | 14.4 ± 7.3 | 21.7 ± 11.9 | 17.5 ± 7.0 | 20.9 ± 7.5 |
| 5 ng/mL | 10 ng/mL | 50 ng/mL | 400 ng/mL | 500 ng/mL | |
|---|---|---|---|---|---|
| LPA 18:1 | 15.2 ± 9.7 | 14.5 ± 3.9 | 21.4 ± 9.6 | 16.7 ± 6.3 | 21.5 ± 9.1 |
| LPA 20:4 | 20.2 ± 10.9 | 15.6 ± 9.1 | 19.9 ± 9.9 | 15.4 ± 8.0 | 19.4 ± 6.8 |
3.3. Method validation
For quantification of LPAs in saliva, the limit of quantification (LOQ) was 1 ng/mL for all LPAs and the quantification range of the assay was 1-200 ng/mL. Because of the lower extraction recovery, the dynamic range for GCF-loaded paper points was 10-500 ng/mL for LPA 18:0 and LPA 16:0, and 5-500 ng/mL for LPA 18:1 and LPA 20:4. Calibration curves were prepared using 10 points and linear regression analysis with 1/x2 weighting was applied. Tables 2 (a) and (b) summarize the calibration parameters from the three validation runs for the saliva and paper points, respectively. The slopes and intercepts were consistent throughout validation and the regression coefficient (r2) was consistently > 0.95 for all analytes over the three validation runs. The reliability and reproducibility of the method for LPAs quantification was evaluated by determining the intra and inter-day accuracy and precision using five QC concentrations distributed throughout the dynamic range for each analyte. In saliva, the inter-day accuracy and precision was < 20% at the LOQ (1 ng/mL) and <13% at other QCs for all analytes (Table 3 (a)). In paper points, the inter-day accuracy and precision was <14% for all analytes at all concentration levels (Table 3(b)). Stability studies indicated that LPAs were stable for at least 1 week, 2 weeks, and 24 hours on the bench, in the -20 °C freezer, and in the autosampler, respectively. Bench and freezer stability were tested using neat standards whereas autosampler stability was tested in extracted saliva samples.
Table 2.
Mean and standard deviation (SD) of the slopes, intercepts, and regression coefficients of the regression equations of LPAs in (a) human saliva and (b) loaded paper points. Results are calculated from the three validation runs and a weighting factor of 1/x2 was used.
| a | ||||||
|---|---|---|---|---|---|---|
| Slope | Intercept | R2 | ||||
| Analyte | Mean | SD | Mean | SD | Mean | SD |
| LPA 18:0 | 4.64E-03 | 5.63E-04 | 1.55E-04 | 3.06E-03 | 0.989 | 0.002 |
| LPA 16:0 | 3.89E-03 | 3.72E-04 | -3.35E-04 | 1.80E-03 | 0.957 | 0.036 |
| LPA 18:1 | 3.76E-03 | 1.49E-04 | 3.36E-04 | 1.32E-03 | 0.992 | 0.004 |
| LPA 20:4 | 5.68E-03 | 2.58E-04 | 5.48E-04 | 1.82E-03 | 0.983 | 0.012 |
| b | ||||||
|---|---|---|---|---|---|---|
| Slope | Intercept | R2 | ||||
| Analyte | Mean | SD | Mean | SD | Mean | SD |
| LPA 18:0 | 3.24E-03 | 1.82E-04 | -9.35E-03 | 4.80E-03 | 0.986 | 0.004 |
| LPA 16:0 | 2.46E-03 | 3.26E-04 | -1.22E-03 | 4.79E-03 | 0.971 | 0.016 |
| LPA 18:1 | 2.31E-03 | 2.02E-04 | -5.75E-03 | 1.51E-03 | 0.969 | 0.012 |
| LPA 20:4 | 4.17E-03 | 5.69E-04 | -3.16E-03 | 7.46E-03 | 0.982 | 0.016 |
Table 3.
Summary of inter-day accuracy and precision of LPA analysis in (a) human Saliva and (b) loaded paper points. Results are calculated from the three validation runs.
| a | ||||||||||
|---|---|---|---|---|---|---|---|---|---|---|
| QC1 | QC2 | QC3 | QC4 | QC5 | ||||||
| Analyte | 1 ng/ml | %RSD | 3 ng/ml | %RSD | 20 ng/ml | %RSD | 150 ng/ml | %RSD | 200 ng/ml | %RSD |
| LPA 18:0 | 1.02 | 19.56 | 3.12 | 11.50 | 19.33 | 9.32 | 142.95 | 8.22 | 190.98 | 5.19 |
| LPA 16:0 | 1.08 | 14.00 | 3.25 | 12.19 | 19.83 | 10.16 | 136.69 | 7.29 | 177.92 | 5.31 |
| LPA 18:1 | 0.94 | 10.89 | 3.44 | 5.45 | 20.95 | 6.54 | 146.41 | 5.05 | 194.98 | 4.25 |
| LPA 20:4 | 0.90 | 11.43 | 3.43 | 7.57 | 22.15 | 8.75 | 148.88 | 2.99 | 189.68 | 6.52 |
| b | ||||||||||
|---|---|---|---|---|---|---|---|---|---|---|
| QC1 | QC2 | QC3 | QC4 | QC5 | ||||||
| Analyte | 10 ng/ml | %RSD | 20 ng/ml | %RSD | 50 ng/ml | %RSD | 400 ng/ml | %RSD | 500 ng/ml | %RSD |
| LPA 18:0 | 11.17 | 13.97 | 18.04 | 12.31 | 48.42 | 11.12 | 436.05 | 4.57 | 495.23 | 7.87 |
| LPA 16:0 | 10.15 | 13.71 | 18.93 | 9.74 | 47.42 | 12.09 | 432.59 | 6.66 | 513.61 | 7.74 |
| 5 ng/ml | %RSD | 10 ng/ml | %RSD | 50 ng/ml | %RSD | 400 ng/ml | %RSD | 500 ng/ml | %RSD | |
|---|---|---|---|---|---|---|---|---|---|---|
| LPA 18:1 | 5.55 | 11.75 | 10.83 | 6.86 | 49.75 | 4.84 | 448.68 | 5.33 | 522.46 | 7.25 |
| LPA 20:4 | 5.15 | 11.06 | 10.27 | 7.19 | 50.63 | 6.60 | 415.20 | 9.77 | 495.58 | 12.35 |
3.4. Application of the method
3.4.1. LPAs in Human Saliva
Table 4 summarizes the concentrations of LPAs in saliva samples obtained from healthy controls and subjects with various degrees of periodontal disease. These indicate that LPA 18:0, LPA 16:0, and LPA 18:1 are the major LPA species in human saliva, whereas LPA 20:4 is a minor component. In our study, we found that LPA 18:0 is the most abundant LPA species in human saliva, whereas LPA 18:1 was found to be the predominant species in a previous report using GC/MS analysis [16]. This difference could be related to the different analytical methods used, as well as to the number and genetics of human subjects enrolled in the study. LPA concentrations were approximately 10 times higher in the saliva obtained from subjects with periodontitis compared to those obtained from control subjects. These data support the role of LPA in the inflammation associated with periodontitis, and suggest that LPA and/or LPA receptors may be potential targets for the treatment of periodontal diseases.
Table 4.
LPA levels in saliva of normal subjects and patients with mixed mild/moderate and moderate/severe periodontitis areas.
| Mean ± SD, ng/ml | Median | Range | |
|---|---|---|---|
| LPA 18:0 | |||
| Normal | 165.0 ± 139.0 | 162.1 | 43.3 to 388.3 |
| Periodontitis (Mild to Moderate) | 1713.4 ± 1879.4 | 1054 | 106.1 to 5949.0 |
| Periodontitis (Moderate to Severe) | 1713.5 ± 2412.0 | 923 | 133.2 to 5949.0 |
| LPA 18:1 | |||
| Normal | 58.1 ± 36.0 | 56.3 | 23.3 to 113.1 |
| Periodontitis (Mild to Moderate) | 697.3 ± 722.3 | 372.5 | 28.5 to 1484.4 |
| Periodontitis (Moderate to Severe) | 467.0 ± 769.3 | 123.0 | 48.4 to 1836.0 |
| LPA 16:0 | |||
| Normal | 60.0 ± 40.0 | 62.0 | 22.0 to 121.1 |
| Periodontitis (Mild to Moderate) | 509.0 ± 539.9 | 265.0 | 33.0 to 1339.2 |
| Periodontitis (Moderate to Severe) | 686.0 ± 951.0 | 393.2 | 106.0 to 2365.3 |
| LPA 20:4 | |||
| Normal | 7.1 ± 5.0 | 7.1 | 0.9 to 15.0 |
| Periodontitis (Mild to Moderate) | 46.0 ± 67.0 | 18 | 4.2 to 163.5 |
| Periodontitis (Moderate to Severe) | 35.0 ± 56.3 | 11.2 | 2.7 to 135.0 |
3.4.2. LPAs in Human GCF
This is the first report of LPA levels in human GCF. Fig.2 shows the levels of LPAs in normal subjects and patients with moderate and severe periodontal disease. LPA 18:0 and LPA 18:1 were found to be the most abundant components in GCF, whereas, LPA 20:4 had the lowest concentration among all 4 LPAs in all samples. The data show that the levels of all the four LPA species are higher in patients with periodontal disease compared to normal subjects. These data support our findings from the saliva data, which suggest that the elevated LPA levels could play a major role in the inflammatory periodontal diseases.
Fig.2.

LPA levels in GCF of normal subjects (N) and patients with moderate (M) and severe (S) periodontal disease.
4. Conclusions
This is the first validated LC-MS/MS method for the quantification of four LPA species (LPA 18:0, LPA 16:0, LPA 18:1, and LPA 20:4) in human saliva and GCF. A sensitive, selective, and simple method was validated for the quantification of LPAs in human saliva in the range of 1-200 ng/mL. In GCF, LPAs were quantified in the range of 5-10 ng/mL to 500 ng/mL. The sample volume was 20 μl for saliva samples and 1-6μl for GCF samples. LPAs were markedly elevated (5-10 fold) in the saliva and GCF from human subjects with periodontitis, which supports a role of LPAs in the pathogenesis of periodontal diseases.
Acknowledgements
Sai Praneeth R Bathena is thankful to University of Nebraska Medical Center for the Graduate Fellowship.
Abbreviations
- LPA
lysophosphatidic acid
- GF
gingival fibroblasts
- PDLF
periodontal ligament fibroblasts
- GCF
gingival crevicular fluid
- LC-MS/MS
liquid chromatography-tandem mass spectrometry
- MeOH
methanol
- IS
internal standard
- QC
quality control
Footnotes
Publisher's Disclaimer: This is a PDF file of an unedited manuscript that has been accepted for publication. As a service to our customers we are providing this early version of the manuscript. The manuscript will undergo copyediting, typesetting, and review of the resulting proof before it is published in its final citable form. Please note that during the production process errors may be discovered which could affect the content, and all legal disclaimers that apply to the journal pertain.
References
- 1.Tigyi G. Aiming drug discovery at lysophosphatidic acid targets. Br J Pharmacol. 2010;161:241–270. doi: 10.1111/j.1476-5381.2010.00815.x. [DOI] [PMC free article] [PubMed] [Google Scholar]
- 2.Haldar D, Vancura A. Glycerophosphate acyltransferase from liver. Methods Enzymol. 1992;209:64–72. doi: 10.1016/0076-6879(92)09008-q. [DOI] [PubMed] [Google Scholar]
- 3.Simpson CM, Itabe H, Reynolds CN, King WC, Glomset JA. Swiss 3T3 cells preferentially incorporate sn-2-arachidonoyl monoacylglycerol into sn-1-stearoyl-2-arachidonoyl phosphatidylinositol. J Biol Chem. 1991;266:15902–15909. [PubMed] [Google Scholar]
- 4.Fourcade O, Simon MF, Viode C, Rugani N, Leballe F, Ragab A, Fournie B, Sarda L, Chap H. Secretory phospholipase A2 generates the novel lipid mediator lysophosphatidic acid in membrane microvesicles shed from activated cells. Cell. 1995;80:919–927. doi: 10.1016/0092-8674(95)90295-3. [DOI] [PubMed] [Google Scholar]
- 5.Sano T, Baker D, Virag T, Wada A, Yatomi Y, Kobayashi T, Igarashi Y, Tigyi G. Multiple mechanisms linked to platelet activation result in lysophosphatidic acid and sphingosine 1-phosphate generation in blood. J Biol Chem. 2002;277:21197–21206. doi: 10.1074/jbc.M201289200. [DOI] [PubMed] [Google Scholar]
- 6.Anliker B, Chun J. Lysophospholipid G protein-coupled receptors. J Biol Chem. 2004;279:20555–20558. doi: 10.1074/jbc.R400013200. [DOI] [PubMed] [Google Scholar]
- 7.An S, Bleu T, Hallmark OG, Goetzl EJ. Characterization of a novel subtype of human G protein-coupled receptor for lysophosphatidic acid. J Biol Chem. 1998;273:7906–7910. doi: 10.1074/jbc.273.14.7906. [DOI] [PubMed] [Google Scholar]
- 8.Toews ML, Ediger TL, Romberger DJ, Rennard SI. Lysophosphatidic acid in airway function and disease. Biochim Biophys Acta. 2002;1582:240–250. doi: 10.1016/s1388-1981(02)00177-4. [DOI] [PubMed] [Google Scholar]
- 9.Zhao Y, Natarajan V. Lysophosphatidic acid signaling in airway epithelium: role in airway inflammation and remodeling. Cell Signal. 2009;21:367–377. doi: 10.1016/j.cellsig.2008.10.010. [DOI] [PMC free article] [PubMed] [Google Scholar]
- 10.Song HY, Lee MJ, Kim MY, Kim KH, Lee IH, Shin SH, Lee JS, Kim JH. Lysophosphatidic acid mediates migration of human mesenchymal stem cells stimulated by synovial fluid of patients with rheumatoid arthritis. Biochim Biophys Acta. 2010;1801:23–30. doi: 10.1016/j.bbalip.2009.08.011. [DOI] [PubMed] [Google Scholar]
- 11.Siess W, Zangl KJ, Essler M, Bauer M, Brandl R, Corrinth C, Bittman R, Tigyi G, Aepfelbacher M. Lysophosphatidic acid mediates the rapid activation of platelets and endothelial cells by mildly oxidized low density lipoprotein and accumulates in human atherosclerotic lesions. Proc Natl Acad Sci U S A. 1999;96:6931–6936. doi: 10.1073/pnas.96.12.6931. [DOI] [PMC free article] [PubMed] [Google Scholar]
- 12.Cerutis DR, Alnouti Y, Weston M, Bathena SPR, McVaney TP, Ogunleye A, Headen KV. International Association of Dental Research (IADR) 2010 Conference; Abstract #4359, http://iadr.confex.com/iadr/2010barce/webprogram/Paper137491.html. [Google Scholar]
- 13.Oliver RC, Brown LJ, Loe H. Periodontal diseases in the United States population. J Periodontol. 1998;69:269–278. doi: 10.1902/jop.1998.69.2.269. [DOI] [PubMed] [Google Scholar]
- 14.George J, Headen KV, Ogunleye AO, Perry GA, Wilwerding TM, Parrish LC, McVaney TP, Mattson JS, Cerutis DR. Lysophosphatidic Acid signals through specific lysophosphatidic Acid receptor subtypes to control key regenerative responses of human gingival and periodontal ligament fibroblasts. J Periodontol. 2009;80:1338–1347. doi: 10.1902/jop.2009.080624. [DOI] [PMC free article] [PubMed] [Google Scholar]
- 15.Li S, Zhang J. Lipopolysaccharide induces autotaxin expression in human monocytic THP-1 cells. Biochem Biophys Res Commun. 2009;378:264–268. doi: 10.1016/j.bbrc.2008.11.047. [DOI] [PubMed] [Google Scholar]
- 16.Sugiura T, Nakane S, Kishimoto S, Waku K, Yoshioka Y, Tokumura A. Lysophosphatidic acid, a growth factor-like lipid, in the saliva. J Lipid Res. 2002;43:2049–2055. doi: 10.1194/jlr.m200242-jlr200. [DOI] [PubMed] [Google Scholar]
- 17.Cerutis DR, Dreyer A, Cordini F, McVaney TP, Mattson JS, Parrish LC, Romito L, Huebner GR, Jabro M. Lysophosphatidic acid modulates the regenerative responses of human gingival fibroblasts and enhances the actions of platelet-derived growth factor. J Periodontol. 2004;75:297–305. doi: 10.1902/jop.2004.75.2.297. [DOI] [PubMed] [Google Scholar]
- 18.Meyer Zu Heringdorf D. Lysophospholipid receptor-dependent and -independent calcium signaling. J Cell Biochem. 2004;92:937–948. doi: 10.1002/jcb.20107. [DOI] [PubMed] [Google Scholar]
- 19.Oliver RC, Holm-Pederen P, Loe H. The correlation between clinical scoring, exudate measurements and microscopic evaluation of inflammation in the gingiva. J Periodontol. 1969;40:201–209. doi: 10.1902/jop.1969.40.4.201. [DOI] [PubMed] [Google Scholar]
- 20.Chen YL, Xu Y. Determination of lysophosphatidic acids by capillary electrophoresis with indirect ultraviolet detection. J Chromatogr B Biomed Sci Appl. 2001;753:355–363. doi: 10.1016/s0378-4347(00)00582-x. [DOI] [PubMed] [Google Scholar]
- 21.Saulnier-Blache JS, Girard A, Simon MF, Lafontan M, Valet P. A simple and highly sensitive radioenzymatic assay for lysophosphatidic acid quantification. J Lipid Res. 2000;41:1947–1951. [PMC free article] [PubMed] [Google Scholar]
- 22.Xu Y, Shen Z, Wiper DW, Wu M, Morton RE, Elson P, Kennedy AW, Belinson J, Markman M, Casey G. Lysophosphatidic acid as a potential biomarker for ovarian and other gynecologic cancers. JAMA. 1998;280:719–723. doi: 10.1001/jama.280.8.719. [DOI] [PubMed] [Google Scholar]
- 23.Holland WL, Stauter EC, Stith BJ. Quantification of phosphatidic acid and lysophosphatidic acid by HPLC with evaporative light-scattering detection. J Lipid Res. 2003;44:854–858. doi: 10.1194/jlr.D200040-JLR200. [DOI] [PubMed] [Google Scholar]
- 24.Scherer M, Schmitz G, Liebisch G. High-throughput analysis of sphingosine 1-phosphate, sphinganine 1-phosphate, and lysophosphatidic acid in plasma samples by liquid chromatography-tandem mass spectrometry. Clin Chem. 2009;55:1218–1222. doi: 10.1373/clinchem.2008.113779. [DOI] [PubMed] [Google Scholar]
- 25.Shan L, Jaffe K, Li S, Davis L. Quantitative determination of lysophosphatidic acid by LC/ESI/MS/MS employing a reversed phase HPLC column. J Chromatogr B Analyt Technol Biomed Life Sci. 2008;864:22–28. doi: 10.1016/j.jchromb.2008.01.031. [DOI] [PubMed] [Google Scholar]
- 26.Meleh M, Pozlep B, Mlakar A, Meden-Vrtovec H, Zupancic-Kralj L. Determination of serum lysophosphatidic acid as a potential biomarker for ovarian cancer. J Chromatogr B Analyt Technol Biomed Life Sci. 2007;858:287–291. doi: 10.1016/j.jchromb.2007.08.008. [DOI] [PubMed] [Google Scholar]
- 27.Yoon HR, Kim H, Cho SH. Quantitative analysis of acyl-lysophosphatidic acid in plasma using negative ionization tandem mass spectrometry. J Chromatogr B Analyt Technol Biomed Life Sci. 2003;788:85–92. doi: 10.1016/s1570-0232(02)01031-0. [DOI] [PubMed] [Google Scholar]
- 28.Murph MM, Hurst-Kennedy J, Newton V, Brindley DN, Radhakrishna H. Lysophosphatidic acid decreases the nuclear localization and cellular abundance of the p53 tumor suppressor in A549 lung carcinoma cells. Mol Cancer Res. 2007;5:1201–1211. doi: 10.1158/1541-7786.MCR-06-0338. [DOI] [PubMed] [Google Scholar]
- 29.Baker DL, Desiderio DM, Miller DD, Tolley B, Tigyi GJ. Direct quantitative analysis of lysophosphatidic acid molecular species by stable isotope dilution electrospray ionization liquid chromatography-mass spectrometry. Anal Biochem. 2001;292:287–295. doi: 10.1006/abio.2001.5063. [DOI] [PubMed] [Google Scholar]
- 30.Armitage GC. Development of a classification system for periodontal diseases and conditions. Ann Periodontol. 1999;4:1–6. doi: 10.1902/annals.1999.4.1.1. [DOI] [PubMed] [Google Scholar]
- 31.Alnouti Y, Li M, Kavetskaia O, Bi H, Hop CE, Gusev AI. Method for internal standard introduction for quantitative analysis using on-line solid-phase extraction LC-MS/MS. Anal Chem. 2006;78:1331–1336. doi: 10.1021/ac051806q. [DOI] [PubMed] [Google Scholar]
- 32.Alnouti Y, Csanaky IL, Klaassen CD. Quantitative-profiling of bile acids and their conjugates in mouse liver, bile, plasma, and urine using LC-MS/MS. J Chromatogr B Analyt Technol Biomed Life Sci. 2008;873:209–217. doi: 10.1016/j.jchromb.2008.08.018. [DOI] [PMC free article] [PubMed] [Google Scholar]
- 33.Hochberg RB. Biological esterification of steroids. Endocr Rev. 1998;19:331–348. doi: 10.1210/edrv.19.3.0330. [DOI] [PubMed] [Google Scholar]