

Abstract
Hippocampal sharp waves (SPWs) and associated fast (“ripple”) oscillations (SPW-Rs) in the CA1 region are among the most synchronous physiological patterns in the mammalian brain. Using two-dimensional arrays of electrodes for recording local field potentials and unit discharges in freely moving rats, we studied the emergence of ripple oscillations (140–220 Hz) and compared their origin and cellular–synaptic mechanisms with fast gamma oscillations (90–140 Hz). We show that (1) hippocampal SPW-Rs and fast gamma oscillations are quantitatively distinct patterns but involve the same networks and share similar mechanisms; (2) both the frequency and magnitude of fast oscillations are positively correlated with the magnitude of SPWs; (3) during both ripples and fast gamma oscillations the frequency of network oscillation is higher in CA1 than in CA3; and (4) the emergence of CA3 population bursts, a prerequisite for SPW-Rs, is biased by activity patterns in the dentate gyrus and entorhinal cortex, with the highest probability of ripples associated with an “optimum” level of dentate gamma power. We hypothesize that each hippocampal subnetwork possesses distinct resonant properties, tuned by the magnitude of the excitatory drive.
Introduction
Large-amplitude local field potentials [“sharp waves” (SPWs)] occur irregularly in the hippocampal CA1 stratum radiatum when the animal has minimal interaction with its environment, such as immobility, consummatory behaviors, or slow-wave sleep (Buzsáki et al., 1983; Suzuki and Smith, 1987). SPWs are associated with fast-field oscillations (∼140–200 Hz), or “ripples” (SPW-Rs) in the CA1 pyramidal cell layer (O'Keefe and Nadel, 1978; Buzsáki et al., 1992; Csicsvari et al., 2000; Ylinen et al., 1995). In the time window of SPW-Rs (50–150 ms), 50,000 to 100,000 neurons (10–18% of all neurons) discharge synchronously in the CA3–CA1 subicular complex/entorhinal cortex (Chrobak and Buzsáki, 1996; Csicsvari et al., 1999a), representing a several-fold increase of population synchrony compared to theta oscillations (Csicsvari et al., 1999a). Neuronal participation in the population discharge of SPW-R is biased by previous experience of the animal (Buzsáki, 1989; Wilson and McNaughton, 1994; Skaggs and McNaughton, 1996; Kudrimoti et al., 1999; Nadasdy et al., 1999; Lee and Wilson 2002; Foster and Wilson, 2006; O'Neill et al., 2006, 2008; Diba and Buzsáki, 2007; Karlsson and Frank, 2008, 2009; Singer and Frank, 2009; Dupret et al., 2010). Mostly because of the behaviorally relevant spike content and the large gain in network excitability (Csicsvari et al., 1999a), SPW-Rs have been postulated to play a critical role in consolidating memory traces within the hippocampus and in transferring memories from the hippocampus to the neocortex (Buzsáki, 1989, 1996; Wilson and McNaughton, 1994; McClelland et al., 1995; Siapas and Wilson, 1998; Ji and Wilson, 2007; Axmacher et al., 2008; Eschenko et al., 2008; Mölle et al., 2009; Ramadan et al., 2009; but see Lubenov and Siapas, 2008). In support of this hypothesis, selective elimination of SPW-Rs during postlearning sleep results in impairment of memory (Girardeau et al., 2009; Ego-Stengel and Wilson, 2010; Nokia et al., 2010). The importance of SPW-R is further illustrated by the observation that the temporal patterning of ripples is altered in epilepsy; in human temporal lobe epilepsy, the super-fast ripples that emerge are pathognomonic (Bragin et al., 1999a,b; 2000; Staba et al., 2002; Jiruska et al., 2010).
A related hippocampal pattern in the absence of the theta rhythm is the gamma oscillation. Gamma oscillations are supported by multiple mechanisms (Bartos et al., 2007; Wang 2010) and occur in at least two varieties: gamma (or low-frequency gamma; 30–90 Hz) and fast or “high” gamma (>90 Hz) (Csicsvari et al., 1999b; Canolty et al., 2006; Colgin et al., 2009), which occupy different frequency bands and possibly use different mechanisms. Whereas the origin and mechanisms of “slow” gamma oscillations are relatively well characterized (Csicsvari et al., 2003; Mann et al. 2005; Whittington et al., 2011), the mechanisms supporting fast gamma oscillations and especially their relationship to SPW-Rs are not well understood (Csicsvari et al., 1999b). In the present experiments, we investigated the physiological features of SPWs, ripples, and fast gamma oscillations in the CA1 and CA3 regions of the hippocampus and the impact of the activity in the dentate gyrus and entorhinal cortex on these rhythms in the sleeping rat.
Materials and Methods
Animals and surgery.
Ten male Long–Evans (5–8 months old) and two male Sprague Dawley rats (350–500 g; 5–8 months) were used in these experiments. Behavioral training, surgery details, and data obtained from subgroups of the present rats have been reported previously (Csicsvari et al., 2003; Diba and Buzsáki, 2007; Montgomery et al., 2009; Mizuseki et al., 2009). After maze training, recording and stimulation electrodes were implanted. In six rats, a 96-site silicon probe was implanted in the right hemisphere parallel to the transverse axis of the hippocampus (45° parasagittal). These probes had recording sites spaced regularly over a 1.5 × 1.5 mm area with six shanks spaced at 300 μm, each with 16 recording sites at 100 μm spacing. A bipolar stimulating electrode was implanted into the angular bundle (perforant path) at 1.0 mm anteroposterior (AP) and 1.0 mm mediolateral (ML) from the junction between lambda and the right lateral ridge, and 3.5 mm dorsoventral from the dura. Another stimulating electrode was implanted in the ventral hippocampal commissure at 1.2 mm AP and 1.0 mm ML from bregma and 3.8 mm from the dura (Csicsvari et al., 2000; Montgomery et al., 2009). Three other rats were implanted with 32- and/or 64-site silicon probes in the left or right dorsal hippocampus. The silicon probes, consisting of four or eight individual shanks (spaced 200 μm apart), each with eight staggered recording sites (20 μm spacing), were lowered to CA1 and CA3 pyramidal cell layers (Diba and Buzsáki, 2007) and dentate gyrus. An additional three rats were implanted with a four-shank silicon probe in the right dorsocaudal medial entorhinal cortex (EC) (Hafting et al., 2005) and another four- or eighth-shank probe into the CA1–dentate axis (Mizuseki et al., 2009). All silicon probes were attached to a microdrive, which allowed precise positioning of the probe tips into the desired layer. Two stainless-steel screws inserted above the cerebellum were used as indifferent and ground electrodes during recordings.
Postmortem electrode location was verified using thionin, fluorescent Nissl (Invitrogen), or DAPI (Invitrogen) staining in combination with DiI-labeled (Invitrogen) electrode tracks. The histological reconstruction of the electrode tracks is available from Montgomery et al. (2007, 2008). All protocols were approved by the Institutional Animal Care and Use Committee of Rutgers University.
Data collection.
After recovery from surgery (∼1 week), physiological signals were recorded in the home cage and included waking immobility and sleep epochs. During sleep, the rat curled up in one of the corners with eyes closed. Rapid eye movement (REM) and slow-wave sleep epochs were separated as described previously (Montgomery et al., 2008). During the recording sessions, neurophysiological signals were amplified (1000×), bandpass filtered (1 Hz to 5 kHz), and acquired continuously at 20 kHz on a 128-channel DataMax system (RC Electronics) or at 32.5 kHz on a 128-channel Digital Lynx system (Neuralynx). After recording, the local field potential (LFP) was downsampled to 1250 Hz for additional analysis. For offline spike sorting of unit activity, the wideband signal was digitally high-pass filtered (0.8–5 kHz). Spike sorting was performed automatically, using KlustaKwik (http://klustakwik.sourceforge.net), followed by manual adjustment of the clusters (using “Klusters” software package; http://klusters.sourceforge.net). Neurophysiological and behavioral data were explored using NeuroScope (http://neuroscope.sourceforge.net) (Hazan et al., 2006). Additional details of recording and unit separation and cell type classifications have been described previously by Csicsvari et al. (2003), Diba and Buzsáki (2007), and Mizuseki et al., (2009). For the entorhinal unit data here (used exclusively for the purpose of detecting UP–DOWN state transitions), putative interneurons and principal cells were classified according to the procedure described by Mizuseki et al. (2009). Because of the low number of simultaneously recorded hippocampal units in animals implanted with 96-site probes, we used a simplified method for classification of hippocampal units based on the shape of spike autocorrelograms; units with a characteristic “bursty” autocorrelogram were classified as principal cells, and units lacking a “bursty” autocorrelogram with mean firing rates >5 Hz were classified as putative interneurons. Hippocampal units with mean firing rates <0.5 Hz were discarded from the data set. Recording site irregularities (including cross talk and excessive impedances) were a priori identified and removed from analysis using measures of coherence and normalized power similarity (Diba et al., 2005). Current source density (CSD) was calculated by standard methods (Mitzdorf, 1985). Only CSD calculations centered on three consecutive good channels were used. CSD calculations that would require use of a recording site displaying an irregularity were excluded from additional analysis.
Detection of ripples and fast gamma oscillations.
The procedures for detection were based on those described previously (Csicsvari et al., 1999b), but with additional refinements to minimize false-positive detections and align detected oscillatory events to the peak of the CSD source in the CA1 pyramidal layer. First, the LFP signals from one or more selected channels from the CA1 pyramidal layer were filtered between 50 and 250 Hz, rectified, smoothed with a three-sample uniform kernel, and then z-score normalized. Candidate oscillatory events (epochs during which this normalized signal exceeded a 2 SD threshold) were detected first. Each candidate event was aligned to the nearest peak of the CA1 pyramidal CSD signal within a ±25 ms window around the midpoint of the detected suprathreshold epoch. Because this alignment procedure can result in the same oscillatory event being detected multiple times, we edited the realigned candidate oscillatory events to enforce a minimum 50 ms spacing between events, deleting all but the event with the highest CSD peak when multiple events occurred within a 50 ms time span. Spectral analysis using multitaper FFT on the wideband LFP and CSD signals (Mitra and Pesaran, 1999) (see below, Multitaper FFT) was then performed on each remaining candidate oscillatory event to remove false positives. We required that each oscillation in the final data set have a spectral peak at any frequency between 120 and 200 Hz that is at least 2 SDs above the SWS background for that frequency, for power spectra computed using both the LFP and CSD. The frequency at the spectral peak of each remaining oscillatory event was then calculated. If this peak frequency was under 140 Hz, we categorized the oscillatory event as “fast gamma” for the purposes of our analysis; otherwise the event was categorized as a ripple.
Detection of UP and DOWN states in dentate gyrus and entorhinal cortex.
Down states in the dentate gyrus (DOWNDG) were detected from the CSD trace in the molecular layer of the dentate gyrus. The trace was bandpass filtered between 50 and 100 Hz, rectified, smoothed using a 40 ms uniform kernel, and then normalized. DOWNDG states were defined as periods where the processed normalized signal was at least 0.75 SDs below the mean for at least 100 ms. The remaining epochs were considered UP states. Only slow-wave sleep episodes were included for the detection of UP–DOWN states. The DOWNEC–UPEC transitions in EC were detected by using the spiking activity of EC neuron populations. All isolated (clustered) neurons were combined as a single multiple-unit (MU) train and smoothed with a 10 ms Gaussian kernel. The DOWNEC–UPEC transitions were determined by the following criteria: (1) the smoothed MU activity reached above the UPEC state threshold, defined to be the geometric mean of all nonzero MU firing; (2) the mean MU activity in a 150 ms window before candidate onset of UP state was below the DOWNEC state threshold, which was defined as 0.2 times UP state threshold; and (3) the mean MU activity in a 200 ms window after the onset of the candidate UP state was above the UPEC state threshold (Isomura et al., 2006; Sakata and Harris, 2009). In previous studies, the DOWNEC–UPEC transitions in population firing were strongly correlated with increased gamma power and large membrane potential shifts of intracellularly recorded neurons (Isomura et al., 2006; Mukovski et al., 2007).
Multitaper FFT.
For spectral analysis of oscillatory patterns, we used a modified version of the multitaper FFT MATLAB package by Mitra and Pesaran (1999). Using an FFT window length of 100 ms, over frequencies ranging 50–400 Hz, spectra of individual events contained power estimates over 35 discrete frequency bins. Power spectra were z-score normalized. These z-scored power measurements indicate the number of SDs by which power in a given 100 ms window (e.g., a ripple oscillation) differs from average background power during SWS. The normalizing means and SDs used in calculating the z-score were derived by randomly triggering at 20,000 different points within slow-wave sleep, computing the raw FFT at each of these points, and then calculating the mean and SD of power at each frequency; this procedure was performed independently for every animal and channel analyzed, for both CSD and LFP.
Wavelet algorithm.
For wavelet analysis, the discrete wavelet transform (65 levels, 1–300 Hz) was computed by using a MATLAB wavelet software package provided by C. Torrence and G. Compo (http://paos.colorado.edu/research/wavelets/software.html). Each level (i.e., frequency) of the wavelet transform was individually normalized by the mean and SD of wavelet power during slow-wave sleep episodes. Although the wavelet data for the entire session were normalized, only data from slow-wave sleep epochs were used to calculate the normalizing factors to avoid bias deriving from differing proportions of slow-wave sleep and other behaviors in recording sessions.
Results
As described previously, the in situ recording sites in the various anatomical regions and layers could be determined with high spatial resolution (±30 μm) using a combination of spontaneous LFP patterns, multiple-unit activity, evoked potentials in response to perforant path and/or commissural stimulation, and post hoc histological identification of the anatomical position of each recording shank (Csicsvari et al., 2003; Montgomery and Buzsáki, 2007).
Segregation and definition of ripple and fast gamma oscillations
Figure 1A illustrates wide-band (1 Hz to 5 kHz) CSD traces superimposed on time-frequency spectra in CA1 and CA3 stratum pyramidale, CA1 stratum radiatum, and the granule cell layer during non-REM sleep. In the absence of theta oscillations, LFP patterns in the CA1 pyramidal layer are characterized by relatively silent periods alternating with fast oscillatory events. These transient rhythms can take the form of a faster or slower oscillation in the frequency range of 50–250 Hz, associated with sinks of varying magnitude in CA1 stratum radiatum. To segregate and group these oscillations objectively, oscillatory episodes were detected from the 50–250 Hz filtered CA1 stratum pyramidale LFPs, and the frequency of the peak power was determined for each of the detected events. In the CA1 region, the frequency distribution of the LFP oscillatory episodes was characterized by a definable dip between 130 and 150 Hz, surrounded by distinct peaks at 170–180 and 110 Hz (Fig. 1B). An additional dip at 80–90 Hz was also present in several animals, reflecting a putative boundary between gamma and fast gamma oscillations (Csicsvari et al., 1999b; Canolty et al., 2006; Colgin et al., 2009). Using these boundaries, we defined ripples as fast oscillatory events with peak power >140 Hz and events with peak power within the 90–140 Hz band as fast gamma (Csicsvari et al., 1999b). During oscillatory episodes (detected in CA1), the distribution of peak frequencies in CA3 showed a similar bimodality, but the main peak occurred in the fast gamma oscillation band, rather than at ripple frequency. Interestingly, similar frequency boundaries between gamma, fast gamma, and ripple oscillations have been described in the human brain as well (Canolty et al., 2006; Le Van Quyen et al., 2010). The slower oscillation frequency in the CA3 region, relative to CA1, was also apparent in ripple peak-triggered averages of filtered (50–250 Hz) CA1 pyramidal-layer CSD traces (Fig. 1C). Remarkably, the phase of the CA3 traces was consistent across rats, an indication of cross-frequency phase coupling (n:m) (Tass et al., 1998; Pikovsky et al., 2001).
Figure 1.

Ripples and fast gamma oscillations. A, Example trace of wide-band (1 Hz to 10 kHz) CSD traces of ripple and fast gamma oscillations from the CA1 stratum pyramidale (pyr) and radiatum (rad), CA3 pyramidal layer, and dentate granule cell layer (DG S. gran) in a sleeping rat, overlaid on their respective wavelet spectrograms. B, Distribution of the peak spectral frequency (calculated via FFT) of oscillatory high-frequency episodes detected in the CA1 and CA3 pyramidal layers (mean ± SEM; n = 9 animals). Dashed lines represent minima at 80–90 Hz separating gamma and fast gamma oscillations, and at 140 Hz separating fast gamma (<90–140 Hz) and ripple (>140 Hz) oscillations in CA1. C, Ripple-triggered averages of simultaneously recorded CSD traces from CA1 and CA3 pyramidal layers. For clarity, the amplitude of the CA3 traces has been doubled. Superimposed traces are from four different animals. Note the consistent CA1 versus CA3 phase relationships across animals, despite different oscillatory frequencies. D, Group mean power spectra of ripple and fast oscillation episodes.
The distinct frequencies of the CA1 oscillatory episodes (i.e., ripple and fast gamma) (Fig. 1D) were exploited to examine the potential differential contribution of hippocampal regions to these rhythms. Examination of the magnitude of SPW sinks in CA1 stratum radiatum showed a unimodal distribution (Fig. 2A). The magnitude of SPW sink in mid-stratum radiatum and the source in the CA1 pyramidal layer were strongly correlated for both ripple events and fast oscillations (Fig. 2B) (r > 0.63 in six of six animals; p < 0.00001). This high correlation justified the use of SPW source magnitude for further comparisons in all rats, including those in which electrodes were placed only in CA1 pyramidal layer. Both ripples and fast gamma episodes were associated with SPW sources in the CA1 stratum pyramidale, but ripple-associated sources were of larger magnitude (n = 11; p < 0.00001; Wilcoxon rank sum) (Figs. 2C, 3). In addition, the mean duration of SPW sinks was significantly longer for ripple than for fast gamma episodes (mean duration, 51.8 and 41.8 ms, respectively, n = 6; p < 0.00001; Wilcoxon rank sum) (Figs. 2D, 3). Comparison between the magnitude of SPW CSD source in the pyramidal layer (i.e., the driving excitatory “force”) and oscillatory frequency revealed an inverted-U relationship in CA1. Small-amplitude SPWs were associated with fast gamma oscillations, and medium-size SPWs with either 140–170 or >190 Hz ripples, whereas the largest-amplitude SPWs consistently co-occurred with 170–180 Hz ripples (Fig. 2E). The SPW magnitude dependence of the oscillation frequency was much weaker in CA3 (Fig. 2E).
Figure 2.

Characteristics of ripples and fast gamma oscillations. A, Normalized distribution of SPW sink magnitudes during fast gamma, ripple oscillatory (90–250 Hz) episodes. B, Correlation between sink (CA1 stratum radiatum) and source (CA1 pyramidal layer) magnitudes during fast gamma and ripple episodes. C, Magnitude of SPW source during fast gamma and ripple oscillations. D, Distribution of SPW sink duration in stratum radiatum for ripple (top) and fast gamma (bottom) oscillations. Sink duration was defined as the time period around the detected oscillation where the normalized CSD signal is <0.5 SDs below the mean. E, Fast oscillation frequency in CA1 and CA3 pyramidal layers as a function of SPW sink magnitude in stratum radiatum. Note the resonant peak in CA1 at 200 Hz (inverted-U relationship). Error bars indicate mean ± SEM (n = 6 animals for CA1; n = 4 for CA3). *indicates statistically significant difference (p < 0.00001).
Figure 3.

Dynamic of oscillatory episodes, illustrated by averaged wavelet spectrograms from a single animal, triggered by ripple peaks and fast gamma oscillation peaks, respectively, in the CA1 and CA3 pyramidal layers and dentate granule cell layer.
Wavelet analysis of the CSD traces showed that immediately before the peak of the CA1 ripples, in CA3 there was elevated spectral power over a wide range of frequencies (∼60–250 Hz), but there was no single dominant frequency within this range, indicating that the early part of the CA3 oscillation during ripples lacks consistent rhythmicity (Fig. 3). During the latter part of the oscillation in CA3, spectral power showed higher concentration in frequencies around 100 Hz. In the DG, the dominant frequency was about 50 Hz lower than in CA1. Additionally, power was lower in the DG, reflecting less consistency in its coactivation with CA1. Strong power was present at ∼10 Hz, especially in CA1, reflecting the duration of the SPW source in the pyramidal layer (Fig. 3). During fast gamma oscillations, the frequency difference between CA1 and CA3 regions was rather small, although still apparent (Fig. 3). Both ripples and fast gamma episodes displayed a relatively steady frequency oscillation in the first half of the event, followed by a marked frequency deceleration to ∼110 Hz during the second half (Fig. 3) (Ponomarenko et al., 2008; Nguyen et al., 2009), thus reducing the frequency difference between CA1 and CA3 oscillations.
Using the peaks of the ripple and fast gamma episodes (see Materials and Methods), we constructed CSD maps (Fig. 4), which revealed strong ripple-associated SPW sinks in stratum radiatum of both CA1 and CA3 regions and smaller ones in the inner molecular layer of the dentate gyrus. The peak of SPW occurred earlier in CA3 than in CA1 by 4.46 ms on average (n = 5 animals; SEM, 1.14 ms; p < 0.00001 in five of five animals). SPW-associated current sinks were frequently (but not always) observed in the dentate inner molecular layer. In two of four animals with simultaneous CA1 and DG recordings, the peak of the dentate sink occurred significantly later than the peak of the CA1 radiatum sink by 5.34 ms (SEM, 1.48 ms; p < 0.00001 in two of four animals), supporting the CA3 origin of SPWs (Buzsáki et al., 1983; Buzsáki 1986). In the other two animals, there was no significant difference between the timing of dentate and CA1 CSD sink peaks. This inconsistency may be attributable to the relatively crude spatial resolution (100 μm electrode spacing) of the inner molecular layer. The correlation between SPW sink magnitudes in CA1 and CA3 stratum radiatum was strong (r = 0.58, 0.51, 0.65, 0.74, and 0.69; p < 0.00001 in five of five animals) and weaker between CA1 stratum radiatum and the dentate inner molecular layer (r = 0.13, 0.30, 0.27, 0.48; p < 0.00005 in four of four animals). SPW sink magnitudes in CA3 radiatum and the dentate molecular layer were moderately correlated during ripples (n = 3; p < 0.01; r = 0.10, 0.27, and 0.29), but were weakly correlated during fast gamma oscillations (n = 3; p < 0.01 in two of three animals; p > 0.05 in one of three animals; r = 0.1 where correlation was significant); given the small number of observations, these data should be interpreted with caution. Importantly, the magnitude of the SPW sink in CA1 stratum radiatum was significantly correlated with ripple power in the CA1 pyramidal layer (r = 0.47; range, 0.30 to 0.55; p < 0.01 in each of six animals). In summary, although CA1 ripples and SPWs are distinct physiological patterns, they are strongly coupled under physiological conditions (Ylinen et al., 1995; Chrobak and Buzsáki, 1996; Csicsvari et al., 2000; Buhl and Buzsáki, 2005).
Figure 4.

Regional distribution of currents associated with ripple and fast gamma oscillation. CSD maps (1 Hz to 10 kHz) in two different animals with the average LFP waveforms superimposed (gray traces). Maps were constructed by triggering on the peaks of ripple and fast gamma episodes. Asterisks indicate reference sites. Note strong SPWs (sinks) in the stratum radiatum of CA1 and CA3 and the inner molecular layer of the dentate gyrus during ripples and weaker sinks but with similar spatial distribution during fast gamma oscillations. Sinks in the inner molecular layer of the dentate gyrus possibly reflect activation of excitatory inputs from hilar mossy cells. The most lateral shank in the rat with CA3 sites (bottom) was in the fimbria (data not shown).
Filtered (50–250 Hz) CSD maps of ripples and fast gamma oscillations showed additional quantitative differences between these two types of events (Fig. 5A). Sinks in proximal CA1 radiatum reflected return currents of the sources in the pyramidal layer. In mid-radiatum, however, the frequency of oscillation was slower, reflecting the oscillation frequency of the CA3 input. To quantify the frequency and power differences, the power of LFP traces at 175 and 110 Hz was determined for ripple and fast gamma episodes, respectively, and data from multiple animals (n = 10) are displayed on the approximate anatomical locations of the recording sites (Fig. 5). As expected (Fig. 5B,C), LFP power was significantly different across regions (p < 0.0001; CA1, CA3, dentate gyrus) and across oscillation types (p < 0.0005; ripples vs fast gamma), with a significant region by oscillation type interaction (p < 0.00001; ANOVA followed by Tukey's test). The post-ANOVA tests also showed that CA1 power was significantly higher during ripples than fast gamma episodes (p < 0.0001), and CA1 power was stronger for both oscillation types compared to CA3 or dentate gyrus (Fig. 5B). Phase coherence within the ripple band (measured at 175 Hz) was relatively high for sites within the CA1 pyramidal layer (mean, 0.60; SEM, 0.026; n = 40 recording channel pairings). In contrast, phase coherence between the CA1 and CA3 pyramidal layers (mean, 0.25; SEM, 0.003; n = 17 recording site pairings) and between CA1 pyramidal layer and granule cell layer (mean, 0.27; SEM, 0.005; n = 14 recording site pairings) was significantly lower (p < 0.00001; ANOVA). The general pattern of coherence during fast gamma episodes was similar to that of ripples (Fig. 5C). However, coherence for fast gamma was significantly higher than for ripples both within CA1 sites (0.68 for fast gamma vs 0.599 for ripples; p < 0.00001; t test) and between the CA1 pyramidal layer and granule cell layer (0.35 for fast gamma vs 0.266 for ripples; p < 0.01; t test), but was not significantly different between CA1 and CA3 pyramidal layers. To examine region-dependent variability of peak frequency, the SD of log peak frequency was calculated for each recording site in the cell body layers for both ripple and fast gamma episodes (Fig. 5D). Log frequency variation was significantly smaller in CA1 during both ripples and fast gamma episodes than in the CA3 pyramidal layer and granule cell layer (p < 0.0005; ANOVA). In addition, the log frequency main effect showed a significantly smaller variation during ripples compared to fast gamma episodes (p < 0.0001). The log frequency variation was similar in CA3 and dentate gyrus (p > 0.05) and was not significantly different between ripples and fast gamma oscillations (p > 0.05).
Figure 5.
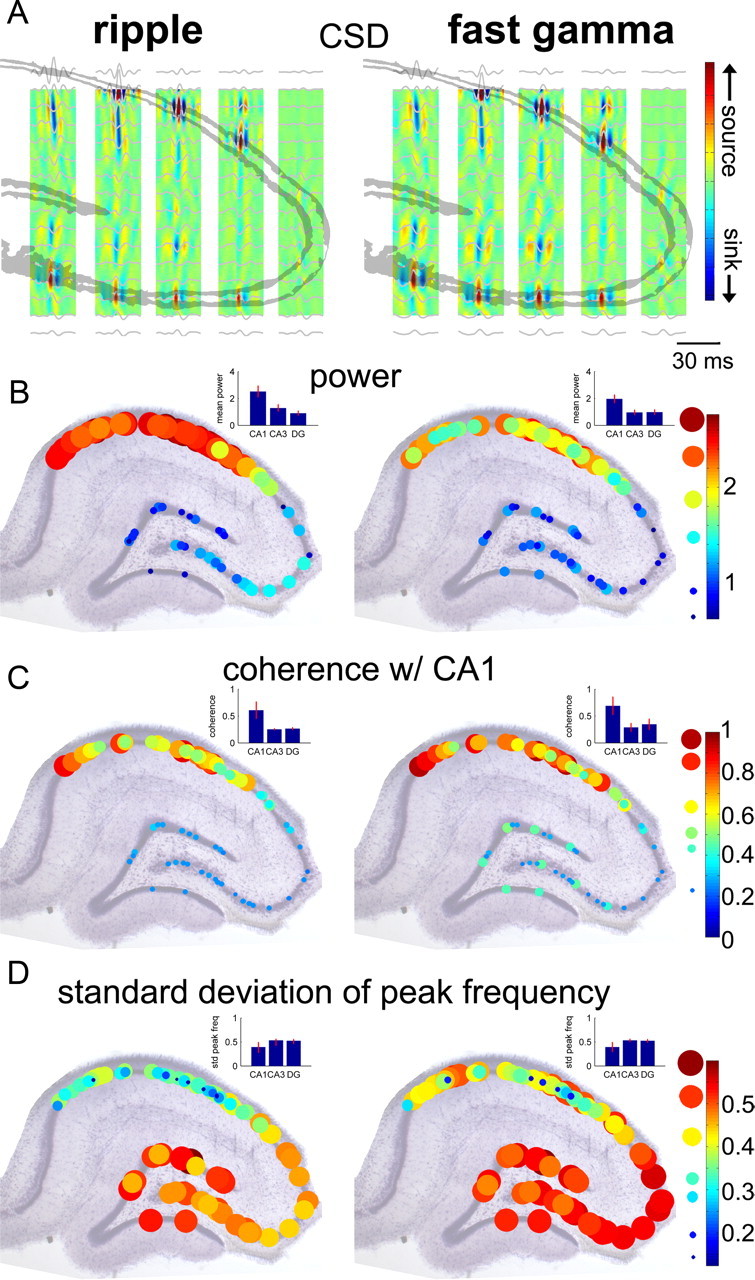
Similar and distinct features of ripple and fast gamma oscillations. A, Filtered CSD maps of ripples and fast gamma oscillations from a single animal. Maps were constructed by filtering the CSD signal (50–250 Hz) and then averaging this filtered CSD, triggering on the peaks of ripple and fast gamma episodes. Average filtered (50–250 Hz) LFP traces are overlaid in gray. Note faster oscillations in the CA1 compared to CA3 and dentate gyrus. B, Normalized power distribution of ripples (measured at 175 Hz) and fast gamma oscillations (110 Hz) in the cell body layers (n = 10 animals). Histology and CSD information from each animal was used to best align the recording sites from different animals to an idealized hippocampal section perpendicular to the long axis of the hippocampus. The size and color of circles indicate the magnitude of power. C, Regional distribution of phase coherence with the CA1 pyramidal layer. In each animal, coherence values were calculated for all sites in a principal cell layer versus the most medial CA1 pyramidal layer site available. D, Region dependence of frequency variability of ripple and fast gamma oscillations. Note the stronger power and larger CA1–CA3 difference of coherence and smaller variability of ripples compared to fast gamma episodes. Error bars indicate mean ± SEM.
To further examine the role of the CA3 region in generating ripples and fast gamma oscillations, coherence between CA1 stratum radiatum and the CA3 pyramidal layer CSD traces was calculated (Fig. 6). The coherence between these two regions/layers was low for both ripples and fast gamma oscillations (c < 0.4). In contrast, the coherence between CA1 pyramidal layer and radiatum was significantly higher for both ripples and fast gamma (Fig. 6) (n = 4; p < 0.00001; ANOVA). These observations show that ripple and fast gamma oscillations in the CA1 region are not “transferred” from the upstream CA3 network wave by wave.
Figure 6.

Coherence with CA1 stratum radiatum. During both ripple and fast gamma oscillations, the CA1 radiatum is more coherent with the CA1 pyramidal layer than the CA3 pyramidal layer. For each animal with simultaneous recordings of CA1 and CA3 pyramidal layers as well as CA1 radiatum (n = 4), average coherence spectra were calculated for both CA1 and CA3 pyramidal layers versus a CA1 radiatum channel, for both ripple and fast gamma oscillations, using CSD. Curves plotted here reflect the mean of these averaged spectra across animals. Error bars indicate SEM.
Although ripples and fast oscillations were not highly coherent across hippocampal regions, power changes at different frequencies may covary (Fig. 3), and such correlations can be revealed by power comodugrams (Buzsáki et al., 2003a; Mitra and Bokil, 2007). Power–power correlations showed differences between ripples and fast gamma oscillations, showing minima at 130–140 and 90 Hz, respectively, for CA1–CA1 site correlations (Fig. 7A,B). Power correlations during ripples were high within the CA1 pyramidal layer in the 140–250 Hz band, although the strength of the correlation decreased with distance (from 0.9 to 0.5 over a 1.5 mm distance in the mediolateral direction) (Fig. 7A). Power correlations between CA1 and CA3/DG were consistently low in the ripple band (<0.2). During fast gamma episodes, high power correlations were also confined to the CA1 region (0.6–0.9), associated with a weak increase of power in CA3/DG in the <100 Hz band (Fig. 7B). At times of ripple events, the maximum power correlation in the ripple band was accompanied by a minimum power correlation in the fast gamma band (Fig. 7, compare A, B), indicating that fast gamma and ripple oscillations are competing patterns and do not occur together in the same region at the same time. Overall, these findings demonstrate that although ripples and fast gamma oscillations share the same anatomical substrates and related physiological mechanisms, they also display distinct features.
Figure 7.

Interregional power correlations during ripples and fast gamma oscillations. A, Comodugrams during ripples between a reference site (red dot) and other sites in the cell body layers (black dots). Each comodugram plots the matrix of correlation coefficients (r) between the spectral power at the reference site (red dot; x-axis) and power at the target site (black dot; y-axis) for each pairing of frequencies. Note high power correlations in the 140–250 Hz band between CA1 sites and corresponding power increase at <130 Hz in the CA3 and dentate regions. The white arrow indicates correlation discontinuity. B, Same as in A but during fast gamma events.
Neuronal discharges associated with ripple and fast gamma oscillations
In agreement with previous studies, the majority of CA1 pyramidal cells were significantly phase locked to the trough of locally recorded ripple (p < 0.05; 38 of 54 neurons in four animals; Hodges–Ajne test for nonuniformity of circular data) (Buzsáki et al., 1992), and fast gamma (38 of 54 neurons) (Csicsvari et al., 1999b; Colgin et al., 2009) oscillations (Fig. 8). Similarly, eight of the nine putative CA1 interneurons were also phase modulated by both ripples and fast gamma, and the phase preference of the interneuron population was delayed 60° to 90° relative to the peak firing of CA1 pyramidal neurons (Fig. 8A,F, corresponding to 1.3 and 2.0 ms delays for ripples and fast gamma, respectively) (Csicsvari et al., 1999a). Phasic modulation of CA3 pyramidal cells was conspicuously absent during ripples, but three of the 60 CA3 pyramidal cells showed significant modulation with CA1 fast gamma oscillations. Five of the seven putative CA3 interneurons were significantly phase locked to both ripples and fast gamma, although their depth of the modulation (mean resultant vector length) was low (Fig. 8A,G). The phase preference of the majority of neurons was similar during ripples and fast gamma oscillation (Fig. 8F). In addition, the depth of the modulation (i.e., the mean resultant length) remained similar across the two rhythms (Fig. 8G). Overall, these unit findings show that although CA3 fast gamma oscillations may contribute to the timing of CA1 neurons, ripples are not “transferred” wave by wave from the CA3 region to CA1. Instead, the buildup of convergent excitation on the dendrites of CA1 neurons produces de novo CA1-specific oscillations.
Figure 8.

Phase locking of neurons to ripples and fast gamma oscillations. A, Periripple histograms of four simultaneously recorded CA3 and CA1 pyramidal cells and putative interneurons in a representative animal. The discharge of the CA1 pyramidal cell and both interneurons (but not the CA3 pyramidal cell) was significantly phase locked to ripple oscillations (p < 0.05; Hodges–Ajne test for nonuniformity of circular data). B, D, Group histograms for the four neuron types during ripples (B) and fast gamma oscillations (D). C, E, Group histograms confined only to significantly phase-locked neurons during ripples (C) and fast gamma oscillations (E). F, Phase relationship of different neuron types during ripples and fast gamma oscillations. G, Relationship between phase-locking magnitude (mean resultant length) of different neuron types during ripples and fast gamma oscillations. Only neurons with significant phase locking during both ripples and fast gamma oscillations are included.
Contribution of the dentate gyrus to SPW-Rs
A striking difference between SPW-Rs observed in vivo and in vitro is the strong frequency and amplitude regularity of SPW-R events in the slice preparation (Traub and Bibbig, 2000; Kubota et al., 2003; Maier et al., 2003; Colgin et al., 2005; Behrens et al., 2007; Foffani et al., 2007) compared to the irregularly occurring SPW-R in the intact brain (Buzsáki et al., 1983, 1992; Buzsáki 1986; Ylinen et al., 1995; Csicsvari et al., 2000; Nguyen et al., 2009; Le Van Quyen et al., 2010). The pattern difference may arise from the influence of networks affecting the CA3 region in vivo (Bragin et al., 1995; Ylinen et al., 1995). A candidate dentate event that may exert such an influence is the neocortical slow oscillation, dominant during slow-wave sleep (Steriade et al., 1993; Sirota et al., 2003; Battaglia et al., 2004; Isomura et al., 2006).
To detect the effect of neocortical influence on the hippocampus, the CSD trace recorded in the dentate molecular layer was filtered (50–100 Hz) and rectified, and epochs longer than 100 ms with at least 0.75 SDs below the mean power were classified as DOWNDG states (Fig. 9A) (Isomura et al., 2006). The validity of this arbitrary measure was justified by the correlation of the LFP DOWNDG–UPDG changes with unit activity recorded from the dentate gyrus, CA3, and CA1 regions (Fig. 9B) (n = 4 animals). During DOWNDG states, neurons recorded from the dentate granule cell layer were either silent or fired at a significantly reduced rate relative to baseline (p < 0.00001 in five of five animals; Wilcoxon signed rank test). This same finding also applied to neurons recorded in the CA1 pyramidal layer and stratum oriens (p < 0.05 in three of three animals) as well as the CA3 pyramidal layer (p < 0.01 in four of four animals), although the effect was of smaller magnitude in CA3, likely because of the presence of gamma oscillation bursts in the DOWNDG state (Isomura et al., 2007). The temporal distribution of DOWNDG states showed a Poisson-like distribution with a peak between 0.5 to 1 Hz (Fig. 9C), possibly reflecting the influence of cortical slow oscillation (Steriade et al., 1993), mediated by the EC. In addition, the dentate UPDG–DOWNDG fluctuations and correlated ripple events had an ultraslow recurrence component between 5 and 15 s (data not shown) (Leopold et al., 2003; Sirota et al., 2003). Dentate gamma power was positively correlated with the occurrence frequency of ripple oscillations (Fig. 9D) (n = 4 animals; r = 0.19, 0.25, 0.25, and 0.33; p < 0.00001) as well as fast gamma oscillations (Fig. 9D) (n = 4 animals; r = 0.28, 0.50, 0.31, and 0.26; p < 0.00001). Both ripple and fast gamma oscillations occurred at a lower rate in the 250 ms interval preceding DOWNDG–UPDG transitions than in the 250 ms interval after such transitions (Fig. 9E) (n = 4; p < 0.05; t test).
Figure 9.

Influence of dentate gyrus on CA1 SPW-R. A, Short epochs of wide-band CSD traces (raw, 1 Hz to 5 kHz) and their filtered derivatives recorded simultaneously from the CA1 pyramidal layer (CA1 PYR), outer molecular layer (DG OML), and granule cell layer (DG GCL) of the dentate gyrus. The horizontal bar indicates a DOWN state, defined by the decreased power of gamma band (50–100 Hz) power (see Materials and Methods). B, Relationship between dentate DOWN states (DOWNDG) and unit discharges of CA1 and CA3 pyramidal neurons (pyr) and putative dentate granule cells (DG granule). The end of the DOWN state (i.e., DOWN–UP transition) was used as the reference event (time 0). Note the strongly decreased discharge activity in the dentate gyrus during DOWNDG. C, Distribution of inter-UP state intervals, determined from DOWNDG–UPDG transitions. D, Occurrence (events per second, counted in 5 s bins) of fast gamma and ripple episodes as a function of normalized dentate gamma band power. Note the inverted-U relationship. E, Cross-correlogram between DOWNDG and the probability of CA1 ripple/fast gamma occurrence. Error bars indicate mean ± SEM (n = 4 animals). Note the low incidence of ripples and fast oscillation episodes during DOWNDG (i.e., before time 0).
Contribution of the entorhinal cortex to SPW-Rs
Previous work has suggested that “silent” epochs in the dentate gyrus reflect slow oscillation-related changes in the neocortex, conveyed by the EC (Wolansky et al., 2006; Hahn et al., 2007; Isomura et al., 2007). In support of those previous findings, the DOWNDG-to-UPDG shift-triggered CSD demonstrated strong sinks in the molecular layer of the dentate gyrus and a weaker and delayed sink in the CA1 stratum lacunosum moleculare, the main target layers 2 and 3 of the EC, respectively (EC2 and EC3, respectively) (Fig. 10A). Conversely, by defining DOWN states in the EC as nonspiking epochs of >150 ms in EC2 and EC3 neurons (Fig. 10C) (Isomura et al., 2006), simultaneous recordings of LFP from the dentate gyrus and unit activity in the EC confirmed that silent epochs in the entorhinal cortex (DOWNEC) and dentate gyrus DOWNDG were correlated with each other (Fig. 10B). After establishing a reliable relationship between silent states in the EC (DOWNEC) and the dentate gyrus (DOWNDG), we examined the relationship between DOWNEC–UPEC shifts and CA1 ripples and fast oscillations. In each rat with both CA1 and EC electrodes (n = 3), the probability of ripple oscillations was significantly lower during DOWNEC states compared to UPEC states (Fig. 10D) (p < 0.01; t test). The same relationship held for fast gamma oscillations in two of three animals. In summary, the EC, directly or by way of the dentate gyrus, can strongly affect the timing of of ripples and fast gamma oscillations.
Figure 10.

Influence of the entorhinal cortex on CA1 SPW-R. A, DOWNDG-triggered CSD map. Note strong sink in the molecular layer (and CA1 stratum lacunosum moleculare), likely reflecting excitatory inputs from the EC. B, C, Relationship between DOWN–UP transition in EC, defined by onset of unit firing in EC2–EC3 after 150 ms silence (C) (see Materials and Methods), and normalized dentate gamma band (50–100 Hz) power. Note correlated decrease of dentate gamma power and EC unit discharge. D, Cross-correlogram between DOWNEC and probability of CA1 ripple/fast gamma occurrence. Error bars indicate mean ± SEM (n = 3 animals).
Discussion
Our findings show that (1) although hippocampal ripples and fast gamma oscillations are distinct patterns, they share multiple physiological mechanisms and anatomical substrate; (2) during both rhythms, the oscillation frequency in CA1 is faster than in CA3, indicating different network resonance in these respective circuits; and (3) activity patterns in the EC and dentate gyrus bias the occurrence of both ripples and fast gamma oscillations.
Sharp waves, ripples, and fast gamma oscillations are distinct events
SPWs in stratum radiatum reflect the depolarization of the apical dendrites of CA1 and CA3 pyramidal cells, because of the synchronous bursting of CA3 pyramidal cells. The population bursts are supported by the spread of excitatory activity in the recurrent CA3 collateral system at times when the burst-suppressive effects of the subcortical inputs are reduced (Buzsáki et al., 1983; Hasselmo and Bower, 1993). The CA3 pyramidal cells, recruited into a SPW event, can broadcast their collective excitation over a large volume of the CA3 and CA1 region (Ylinen et al., 1995). The CA3 output also discharges various interneurons (Csicsvari et al., 1999a; 2000; Klausberger et al., 2003; Klausberger and Somogyi, 2008; Ellender et al., 2010), and the interaction between pyramidal cells and interneurons is believed to trigger the ripple oscillation (Buzsáki et al., 1992; Ylinen et al., 1995; Csicsvari et al., 2000; Brunel and Wang, 2003; Klausberger et al., 2003; Foffani et al., 2007). Additional mechanisms, such as gap-junction-mediated effects (Ylinen et al., 1995; Draguhn et al., 1998; Traub and Bibbig, 2000; Schmitz et al., 2001; Traub et al., 2002; Traub 2003) and ephaptic entrainment of neurons by the large SPW field (Anastassiou et al., 2010) may also contribute to the localized ripple episodes (Chrobak and Buzsáki, 1996; Csicsvari et al., 2000). In summary, although the spatially widespread SPWs and the local ripples/fast gamma bursts are strongly linked, they are distinct physiological events and can be dissociated in both normal tissue and pathology (Bragin et al., 1999a,b; Csicsvari et al., 2000; Leinekugel et al., 2002; Buhl and Buzsáki, 2005; Nakashiba et al., 2009).
Ripples and fast gamma oscillations share mechanisms
We found that in the absence of theta oscillations, CA1 can respond in two different ways to CA3 inputs: fast gamma oscillation (∼80–140 Hz) or ripple (∼140–220 Hz). Their emergence can be intuitively understood as follows. The CA1 and CA3 networks can be conceived of as voltage-controlled oscillators with different response/resonant properties. The coherent SPWs provide the depolarization force and both networks can resonate at either 110 or 170 Hz. Whereas the CA3 region preferentially resonates at <110 Hz, the CA1 favors 170 Hz, likely because of its stronger gain properties, as demonstrated here (Fig. 1D). Under this hypothesis, weaker excitation would generate ∼110-Hz resonance in both regions. Because the oscillations may emerge independently in CA1 and CA3, their frequencies might not perfectly match as shown by the low CA3–CA1 coherence. Nevertheless, because of the small frequency difference, transient phase coupling between the two regions is possible, as demonstrated by the phase-entrainment of individual neurons in both regions (Csicsvari et al., 1999b). At stronger excitation, the CA1 network responds with faster (ripple frequency) oscillation than CA3, because of its steeper input excitation versus frequency gain.
Anatomical information supports the differential level of excitation in the CA1 and CA3 regions. The axon collaterals of all pyramidal neurons of the CA3a, CA3b, and CA3c subregions target both CA3 and CA1 populations. In contrast, the CA3c subregion sends only limited numbers of collaterals to other CA3 neurons (Ishizuka et al., 1990; Li et al., 1994; Wittner et al., 2007). Therefore, during a CA3 population burst, CA1 neurons are more strongly excited, because of the stronger convergence of CA3 afferents. Another mechanism of the excitatory gain may include inhibition. Previous work has demonstrated that with increasing magnitudes of ripples, the recruitment of CA1 pyramidal cells is more effective than that of interneurons (Csicsvari et al., 1999b). The above hypothesis predicts that excessive excitation of the CA3 network should also generate ripples at the same frequency as in CA1. In support of this prediction, the CA3 region also oscillates at ripple frequency under challenged conditions in vitro and in the epileptic hippocampus in vivo (Draguhn et al., 1998; Bragin et al., 1999a,b, 2000; Dzhala and Staley, 2004; Behrens et al., 2005; Both et al., 2008; Liotta et al., 2011; Taxidis et al., 2011). The paucity of recurrent excitatory collaterals of CA1 neurons may be an important factor for the observed resonance at ripple frequency (Memmesheimer 2010). In recurrently connected network models, the propagation delays introduce temporal subclustering of neurons, and in turn, the resulting disorganization generates a broadband spectrum (Ibarz et al., 2010), as shown here in the CA3 region. The absence of subclustering mechanisms in CA1 would favor the integration of temporally offset CA3 inputs into a coherent oscillation (Memmesheimer 2010). The dynamically changing balance between excitation and inhibition may also contribute to the ripple band resonance. Overall, our observations suggest that ripples are generated de novo in the CA1 region of the intact hippocampus (Buzsáki et al., 1992, 2003; Ylinen et al., 1995; Csicsvari et al., 2003).
Role of dentate gyrus and entorhinal cortex in timing of SPW-Rs
SPW-like bursts have been also observed in isolated CA3 slices (Papatheodoropoulos and Kostopoulos, 2002; Kubota et al., 2003; Maier et al., 2003; Behrens et al., 2005; Papatheodoropoulos and Koniaris, 2010), and under in vitro conditions, they are super-regular at 2 to 4 Hz (Traub and Bibbig, 2000; Kubota et al., 2003; Maier et al., 2003; Pais et al., 2003; Colgin et al., 2004, 2005; Dzhala and Staley, 2004; Behrens et al., 2005, 2007; Wu et al., 2005; Foffani et al., 2007; Both et al., 2008; Reichinnek et al., 2010), in contrast to the irregular SPW-R intervals in vivo. The rhythmic recurrence of SPW-Rs in the CA3 network may be explained by an underlying slow relaxation oscillator (Pikovsky et al., 2001; Sirota et al., 2003; Buzsáki, 2006), in which the occurrence of the SPW burst can be advanced by weak inputs in a time- and input-magnitude-dependent manner. Our experiments show that inputs from the dentate gyrus and EC time bias the occurrence of SPW-Rs. We hypothesize that phasic inputs, such as slow oscillations or sleep spindles (Sirota et al., 2003; Isomura et al., 2006; Mölle et al., 2006, 2009; Clemens et al., 2010) can effectively trigger a SPW-R. In support of this hypothesis, slow oscillations were associated with strong sinks in the dentate molecular layer and increased probability of SPW-Rs (Battaglia et al., 2004; Isomura et al., 2006).
The hypothesized influence of EC can contribute to the irregular nature of SPW-Rs in vivo. The surge of activity from the EC during UP states can either advance or delay the next SPW-R event, depending both on the timing and on the relative dominance of excitation versus inhibition. Such external perturbations can effectively generate irregular patterns because of the interference between the hypothesized SPW-pacing oscillator in the CA3 network and the EC-mediated inputs. Finally, fluctuation of the strength of subcortical inputs may also contribute to the irregular nature of SPW-Rs (Buzsáki et al., 1983; Buzsáki 1989).
Footnotes
This work was supported by National Institutes of Health Grants NS034994 and MH54671, the J. D. McDonnell Foundation, and the National Science Foundation (Temporal Dynamics of Learning Center, Social, Behavioral, and Economic Sciences Grant 0542013). We thank members of the Buzsáki lab for their comments on this manuscript.
References
- Anastassiou CA, Montgomery SM, Barahona M, Buzsáki G, Koch C. The effect of spatially inhomogeneous extracellular electric fields on neurons. J Neurosci. 2010;30:1925–1936. doi: 10.1523/JNEUROSCI.3635-09.2010. [DOI] [PMC free article] [PubMed] [Google Scholar]
- Axmacher N, Helmstaedter C, Elger CE, Fell J. Enhancement of neocortical-medial temporal EEG correlations during non-REM sleep. Neural Plast. 2008;2008:563028. doi: 10.1155/2008/563028. [DOI] [PMC free article] [PubMed] [Google Scholar]
- Bartos M, Vida I, Jonas P. Synaptic mechanisms of synchronized gamma oscillations in inhibitory interneuron networks. Nat Rev Neurosci. 2007;8:45–56. doi: 10.1038/nrn2044. [DOI] [PubMed] [Google Scholar]
- Battaglia FP, Sutherland GR, McNaughton BL. Hippocampal sharp wave bursts coincide with neocortical “up-state” transitions. Learn Mem. 2004;11:697–704. doi: 10.1101/lm.73504. [DOI] [PMC free article] [PubMed] [Google Scholar]
- Behrens CJ, van den Boom LP, de Hoz L, Friedman A, Heinemann U. Induction of sharp wave-ripple complexes in vitro and reorganization of hippocampal networks. Nat Neurosci. 2005;8:1560–1567. doi: 10.1038/nn1571. [DOI] [PubMed] [Google Scholar]
- Behrens CJ, van den Boom LP, Heinemann U. Effects of the GABA(A) receptor antagonists bicuculline and gabazine on stimulus-induced sharp wave-ripple complexes in adult rat hippocampus in vitro. Eur J Neurosci. 2007;25:2170–2181. doi: 10.1111/j.1460-9568.2007.05462.x. [DOI] [PubMed] [Google Scholar]
- Both M, Bähner F, von Bohlen und Halbach O, Draguhn A. Propagation of specific network patterns through the mouse hippocampus. Hippocampus. 2008;18:899–908. doi: 10.1002/hipo.20446. [DOI] [PubMed] [Google Scholar]
- Bragin A, Jando G, Nadasdy Z, van Landeghem M, Buzsáki G. Dentate EEG spikes and associated population bursts in the hippocampal hilar region of the rat. J Neurophysiol. 1995;73:1691–1705. doi: 10.1152/jn.1995.73.4.1691. [DOI] [PubMed] [Google Scholar]
- Bragin A, Engel J, Jr, Wilson CL, Fried I, Buzsáki G. High-frequency oscillations in human brain. Hippocampus. 1999a;9:137–142. doi: 10.1002/(SICI)1098-1063(1999)9:2<137::AID-HIPO5>3.0.CO;2-0. [DOI] [PubMed] [Google Scholar]
- Bragin A, Engel J, Jr, Wilson CL, Fried I, Mathern GW. Hippocampal and entorhinal cortex high-frequency oscillations (100–500 Hz) in human epileptic brain and in kainic acid–treated rats with chronic seizures. Epilepsia. 1999b;40:127–137. doi: 10.1111/j.1528-1157.1999.tb02065.x. [DOI] [PubMed] [Google Scholar]
- Bragin A, Wilson CL, Engel J. Chronic epileptogenesis requires development of a network of pathologically interconnected neuron clusters: a hypothesis. Epilepsia. 2000;41(Suppl 6):S144–S152. doi: 10.1111/j.1528-1157.2000.tb01573.x. [DOI] [PubMed] [Google Scholar]
- Brunel N, Wang XJ. What determines the frequency of fast network oscillations with irregular neural discharges? I. Synaptic dynamics and excitation-inhibition balance. J Neurophysiol. 2003;90:415–430. doi: 10.1152/jn.01095.2002. [DOI] [PubMed] [Google Scholar]
- Buhl DL, Buzsáki G. Developmental emergence of hippocampal fast-field “ripple” oscillations in the behaving rat pups. Neuroscience. 2005;134:1423–1430. doi: 10.1016/j.neuroscience.2005.05.030. [DOI] [PMC free article] [PubMed] [Google Scholar]
- Buzsáki G. Hippocampal sharp waves: their origin and significance. Brain Res. 1986;398:242–252. doi: 10.1016/0006-8993(86)91483-6. [DOI] [PubMed] [Google Scholar]
- Buzsáki G. A two-stage model of memory trace formation: A role for “noisy” brain states. Neuroscience. 1989;31:551–570. doi: 10.1016/0306-4522(89)90423-5. [DOI] [PubMed] [Google Scholar]
- Buzsáki G. The hippocampo-neocortical dialogue. Cereb Cortex. 1996;6:81–92. doi: 10.1093/cercor/6.2.81. [DOI] [PubMed] [Google Scholar]
- Buzsáki G. Rhythms of the brain. New York: Oxford UP; 2006. [Google Scholar]
- Buzsáki G, Leung LW, Vanderwolf CH. Cellular bases of hippocampal EEG in the behaving rat. Brain Res Rev. 1983;287:139–171. doi: 10.1016/0165-0173(83)90037-1. [DOI] [PubMed] [Google Scholar]
- Buzsáki G, Horvath Z, Urioste R, Hetke J, Wise K. High-frequency network oscillation in the hippocampus. Science. 1992;256:1025–1027. doi: 10.1126/science.1589772. [DOI] [PubMed] [Google Scholar]
- Buzsáki G, Buhl DL, Harris KD, Csicsvari J, Czeh B, Morozov A. Hippocampal network patterns of activity in the mouse. Neuroscience. 2003a;116:201–211. doi: 10.1016/s0306-4522(02)00669-3. [DOI] [PubMed] [Google Scholar]
- Buzsáki G, Carpi D, Csicsvari J, Dragoi G, Harris KD, Henze DA, Hirase H. Maintenance and modification of firing rates and sequences in the hippocampus: does sleep play a role? In: Maquet P, Smith C, Stickgold R, editors. Sleep and plasticity. Oxford: Oxford UP; 2003b. pp. 247–270. [Google Scholar]
- Canolty RT, Edwards E, Dalal SS, Soltani M, Nagarajan SS, Kirsch HE, Berger MS, Barbaro NM, Knight RT. High gamma power is phase-locked to theta oscillations in human neocortex. Science. 2006;313:1626–1628. doi: 10.1126/science.1128115. [DOI] [PMC free article] [PubMed] [Google Scholar]
- Chrobak JJ, Buzsáki G. High-frequency oscillations in the output networks of the hippocampal-entorhinal axis of the freely behaving rat. J Neurosci. 1996;16:3056–3066. doi: 10.1523/JNEUROSCI.16-09-03056.1996. [DOI] [PMC free article] [PubMed] [Google Scholar]
- Clemens Z, Mölle M, Eröss L, Jakus R, Rásonyi G, Halász P, Born J. Fine-tuned coupling between human parahippocampal ripples and sleep spindles. Eur J Neurosci. 2010;33:511–520. doi: 10.1111/j.1460-9568.2010.07505.x. [DOI] [PubMed] [Google Scholar]
- Colgin LL, Kubota D, Brucher FA, Jia Y, Branyan E, Gall CM, Lynch G. Spontaneous waves in the dentate gyrus of slices from the ventral hippocampus. J Neurophysiol. 2004;92:3385–3398. doi: 10.1152/jn.00478.2004. [DOI] [PubMed] [Google Scholar]
- Colgin LL, Jia Y, Sabatier JM, Lynch G. Blockade of NMDA receptors enhances spontaneous sharp waves in rat hippocampal slices. Neurosci Lett. 2005;385:46–51. doi: 10.1016/j.neulet.2005.05.005. [DOI] [PubMed] [Google Scholar]
- Colgin LL, Denninger T, Fyhn M, Hafting T, Bonnevie T, Jensen O, Moser MB, Moser EI. Frequency of gamma oscillations routes flow of information in the hippocampus. Nature. 2009;462:353–357. doi: 10.1038/nature08573. [DOI] [PubMed] [Google Scholar]
- Csicsvari J, Hirase H, Czurko A, Mamiya A, Buzsáki G. Oscillatory coupling of hippocampal pyramidal cells and interneurons in the behaving rat. J Neurosci. 1999a;19:274–287. doi: 10.1523/JNEUROSCI.19-01-00274.1999. [DOI] [PMC free article] [PubMed] [Google Scholar]
- Csicsvari J, Hirase H, Czurkó A, Mamiya A, Buzsáki G. Fast network oscillations in the hippocampal CA1 region of the behaving rat. J Neurosci. 1999b;19:RC20. doi: 10.1523/JNEUROSCI.19-16-j0001.1999. [DOI] [PMC free article] [PubMed] [Google Scholar]
- Csicsvari J, Hirase H, Mamiya A, Buzsáki G. Ensemble patterns of hippocampal CA3–CA1 neurons during sharp wave-associated population events. Neuron. 2000;28:585–594. doi: 10.1016/s0896-6273(00)00135-5. [DOI] [PubMed] [Google Scholar]
- Csicsvari J, Jameison B, Wise KD, Buzsáki G. Mechanisms of gamma oscillations in the hippocampus of the behaving rat. Neuron. 2003;37:311–322. doi: 10.1016/s0896-6273(02)01169-8. [DOI] [PubMed] [Google Scholar]
- Diba K, Buzsáki G. Forward and reverse hippocampal place-cell sequences during ripples. Nat Neurosci. 2007;10:1241–1242. doi: 10.1038/nn1961. [DOI] [PMC free article] [PubMed] [Google Scholar]
- Diba K, Montgomery SM, Harris KD, Buzsáki G. Identification of silicon probe irregularities using analysis of in vivo recordings. Soc Neurosci Abstr. 2005;31:275–10. [Google Scholar]
- Draguhn A, Traub RD, Schmitz D, Jefferys JG. Electrical coupling underlies high-frequency oscillations in the hippocampus in vitro. Nature. 1998;394:189–192. doi: 10.1038/28184. [DOI] [PubMed] [Google Scholar]
- Dupret D, O'Neill J, Pleydell-Bouverie B, Csicsvari J. The reorganization and reactivation of hippocampal maps predict spatial memory performance. Nat Neurosci. 2010;13:995–1002. doi: 10.1038/nn.2599. [DOI] [PMC free article] [PubMed] [Google Scholar]
- Dzhala VI, Staley KJ. Mechanisms of fast ripples in the hippocampus. J Neurosci. 2004;24:8896–8906. doi: 10.1523/JNEUROSCI.3112-04.2004. [DOI] [PMC free article] [PubMed] [Google Scholar]
- Ego-Stengel V, Wilson MA. Disruption of ripple-associated hippocampal activity during rest impairs spatial learning in the rat. Hippocampus. 2010;20:1–10. doi: 10.1002/hipo.20707. [DOI] [PMC free article] [PubMed] [Google Scholar]
- Ellender TJ, Nissen W, Colgin LL, Mann EO, Paulsen O. Priming of hippocampal population bursts by individual perisomatic-targeting interneurons. J Neurosci. 2010;30:5979–5991. doi: 10.1523/JNEUROSCI.3962-09.2010. [DOI] [PMC free article] [PubMed] [Google Scholar]
- Eschenko O, Ramadan W, Mölle M, Born J, Sara SJ. Sustained increase in hippocampal sharp-wave ripple activity during slow-wave sleep after learning. Learn Mem. 2008;15:222–228. doi: 10.1101/lm.726008. [DOI] [PMC free article] [PubMed] [Google Scholar]
- Foffani G, Uzcategui YG, Gal B, Menendez de la Prida L. Reduced spike-timing reliability correlates with the emergence of fast ripples in the rat epileptic hippocampus. Neuron. 2007;55:930–941. doi: 10.1016/j.neuron.2007.07.040. [DOI] [PubMed] [Google Scholar]
- Foster DJ, Wilson MA. Reverse replay of behavioural sequences in hippocampal place cells during the awake state. Nature. 2006;440:680–683. doi: 10.1038/nature04587. [DOI] [PubMed] [Google Scholar]
- Girardeau G, Benchenane K, Wiener SI, Buzsáki G, Zugaro MB. Selective suppression of hippocampal ripples impairs spatial memory. Nat Neurosci. 2009;12:1222–1223. doi: 10.1038/nn.2384. [DOI] [PubMed] [Google Scholar]
- Hafting T, Fyhn M, Molden S, Moser MB, Moser EI. Microstructure of a spatial map in the entorhinal cortex. Nature. 2005;436:801–806. doi: 10.1038/nature03721. [DOI] [PubMed] [Google Scholar]
- Hahn TT, Sakmann B, Mehta MR. Differential responses of hippocampal subfields to cortical up-down states. Proc Natl Acad Sci U S A. 2007;104:5169–5174. doi: 10.1073/pnas.0700222104. [DOI] [PMC free article] [PubMed] [Google Scholar]
- Hasselmo ME, Bower JM. Acetylcholine and memory. Trends Neurosci. 1993;16:218–222. doi: 10.1016/0166-2236(93)90159-j. [DOI] [PubMed] [Google Scholar]
- Hazan L, Zugaro M, Buzsáki G. Klusters, NeuroScope, NDManager: A free software suite neurophysiological data processing and visualization. J Neurosci Methods. 2006;155:207–216. doi: 10.1016/j.jneumeth.2006.01.017. [DOI] [PubMed] [Google Scholar]
- Ibarz JM, Foffani G, Cid E, Inostroza M, Menendez de la Prida L. Emergent dynamics of fast ripples in the epileptic hippocampus. J Neurosci. 2010;30:16249–16261. doi: 10.1523/JNEUROSCI.3357-10.2010. [DOI] [PMC free article] [PubMed] [Google Scholar]
- Ishizuka N, Weber J, Amaral DG. Organization of intrahippocampal projections originating from CA3 pyramidal cells in the rat. J Comp Neurol. 1990;295:580–623. doi: 10.1002/cne.902950407. [DOI] [PubMed] [Google Scholar]
- Isomura Y, Sirota A, Ozen S, Montgomery S, Mizuseki K, Henze DA, Buzsáki G. Integration and segregation of activity in entorhinal-hippocampal subregions by neocortical slow oscillations. Neuron. 2006;52:871–882. doi: 10.1016/j.neuron.2006.10.023. [DOI] [PubMed] [Google Scholar]
- Ji D, Wilson MA. Coordinated memory replay in the visual cortex and hippocampus during sleep. Nat Neurosci. 2007;10:100–107. doi: 10.1038/nn1825. [DOI] [PubMed] [Google Scholar]
- Jiruska P, Finnerty GT, Powell AD, Lofti N, Cmejla R, Jefferys JG. Epileptic high-frequency network activity in a model of non-lesional temporal lobe epilepsy. Brain. 2010;133:1380–1390. doi: 10.1093/brain/awq070. [DOI] [PMC free article] [PubMed] [Google Scholar]
- Karlsson MP, Frank LM. Network dynamics underlying the formation of sparse, informative representations in the hippocampus. J Neurosci. 2008;28:14271–14281. doi: 10.1523/JNEUROSCI.4261-08.2008. [DOI] [PMC free article] [PubMed] [Google Scholar]
- Karlsson MP, Frank LM. Awake replay of remote experiences in the hippocampus. Nat Neurosci. 2009;12:913–918. doi: 10.1038/nn.2344. [DOI] [PMC free article] [PubMed] [Google Scholar]
- Klausberger T, Somogyi P. Neuronal diversity and temporal dynamics: the unity of hippocampal circuit operations. Science. 2008;321:53–57. doi: 10.1126/science.1149381. [DOI] [PMC free article] [PubMed] [Google Scholar]
- Klausberger T, Magill PJ, Marton LF, Roberts JD, Cobden PM, Buzsáki G, Somogyi P. Brain-state- and cell-type-specific firing of hippocampal interneurons in vivo. Nature. 2003;421:844–848. doi: 10.1038/nature01374. [DOI] [PubMed] [Google Scholar]
- Kubota D, Colgin LL, Casale M, Brucher FA, Lynch G. Endogenous waves in hippocampal slices. J Neurophysiol. 2003;89:81–89. doi: 10.1152/jn.00542.2002. [DOI] [PubMed] [Google Scholar]
- Kudrimoti HS, Barnes CA, McNaughton BL. Reactivation of hippocampal cell assemblies: effects of behavioral state, experience, and EEG dynamics. J Neurosci. 1999;19:4090–4101. doi: 10.1523/JNEUROSCI.19-10-04090.1999. [DOI] [PMC free article] [PubMed] [Google Scholar]
- Le Van Quyen M, Staba R, Bragin A, Dickson C, Valderrama M, Fried I, Engel J. Large-scale microelectrode recordings of high-frequency gamma oscillations in human cortex during sleep. J Neurosci. 2010;30:7770–7782. doi: 10.1523/JNEUROSCI.5049-09.2010. [DOI] [PMC free article] [PubMed] [Google Scholar]
- Lee AK, Wilson MA. Memory of sequential experience in the hippocampus during slow wave sleep. Neuron. 2002;36:1183–1194. doi: 10.1016/s0896-6273(02)01096-6. [DOI] [PubMed] [Google Scholar]
- Leinekugel X, Khazipov R, Cannon R, Hirase H, Ben-Ari Y, Buzsáki G. Correlated bursts of activity in the neonatal hippocampus in vivo. Science. 2002;296:2049–2052. doi: 10.1126/science.1071111. [DOI] [PubMed] [Google Scholar]
- Leopold DA, Murayama Y, Logothetis NK. Very slow activity fluctuations in monkey visual cortex: implications for functional brain imaging. Cereb Cortex. 2003;13:422–433. doi: 10.1093/cercor/13.4.422. [DOI] [PubMed] [Google Scholar]
- Li XG, Somogyi P, Ylinen A, Buzsáki G. The hippocampal CA3 network: an in vivo intracellular labeling study. J Comp Neurol. 1994;339:181–208. doi: 10.1002/cne.903390204. [DOI] [PubMed] [Google Scholar]
- Liotta A, Caliskan G, Haq RU, Hollnagel JO, Roesler A, Heinemann U, Behrens CJ. Partial disinhibition is required for transition of stimulus-induced sharp wave-ripple complexes to recurrent epileptiform discharges in rat hippocampal slices. J Neurophysiol. 2011;105:172–187. doi: 10.1152/jn.00186.2010. [DOI] [PubMed] [Google Scholar]
- Lubenov EV, Siapas AG. Decoupling through synchrony in neuronal circuits with propagation delays. Neuron. 2008;58:118–131. doi: 10.1016/j.neuron.2008.01.036. [DOI] [PubMed] [Google Scholar]
- Maier N, Nimmrich V, Draguhn A. Cellular and network mechanisms underlying spontaneous sharp wave-ripple complexes in mouse hippocampal slices. J Physiol. 2003;550:873–887. doi: 10.1113/jphysiol.2003.044602. [DOI] [PMC free article] [PubMed] [Google Scholar]
- Mann EO, Suckling JM, Hajos N, Greenfield SA, Paulsen O. Perisomatic feedback inhibition underlies cholinergically induced fast network oscillations in the rat hippocampus in vitro. Neuron. 2005;45:105–117. doi: 10.1016/j.neuron.2004.12.016. [DOI] [PubMed] [Google Scholar]
- McClelland JL, McNaughton BL, O'Reilly RC. Why there are complementary learning systems in the hippocampus and neocortex: insights from the successes and failures of connectionist models of learning and memory. Psychol Rev. 1995;102:419–457. doi: 10.1037/0033-295X.102.3.419. [DOI] [PubMed] [Google Scholar]
- Memmesheimer RM. Quantitative prediction of intermittent high-frequency oscillations in neural networks with supralinear dendritic interactions. Proc Natl Acad Sci U S A. 2010;107:11092–11097. doi: 10.1073/pnas.0909615107. [DOI] [PMC free article] [PubMed] [Google Scholar]
- Mitra PP, Bokil H. Observed brain dynamics. Cambridge, UK: Oxford UP; 2007. [Google Scholar]
- Mitra PP, Pesaran B. Analysis of dynamic brain imaging data. Biophys J 1999. 1999;76:691–708. doi: 10.1016/S0006-3495(99)77236-X. [DOI] [PMC free article] [PubMed] [Google Scholar]
- Mitzdorf U. Current source-density method and application in cat cerebral cortex: investigation of evoked potentials and EEG phenomena. Physiol Rev. 1985;65:37–100. doi: 10.1152/physrev.1985.65.1.37. [DOI] [PubMed] [Google Scholar]
- Mizuseki K, Sirota A, Pastalkova E, Buzsáki G. Theta oscillations provide temporal windows for local circuit computation in the entorhinal-hippocampal loop. Neuron. 2009;64:267–280. doi: 10.1016/j.neuron.2009.08.037. [DOI] [PMC free article] [PubMed] [Google Scholar]
- Mölle M, Yeshenko O, Marshall L, Sara SJ, Born J. Hippocampal sharp wave-ripples linked to slow oscillations in rat slow-wave sleep. J Neurophysiol. 2006;96:62–70. doi: 10.1152/jn.00014.2006. [DOI] [PubMed] [Google Scholar]
- Mölle M, Eschenko O, Gais S, Sara SJ, Born J. The influence of learning on sleep slow oscillations and associated spindles and ripples in humans and rats. Eur J Neurosci. 2009;29:1071–1081. doi: 10.1111/j.1460-9568.2009.06654.x. [DOI] [PubMed] [Google Scholar]
- Montgomery SM, Buzsáki G. Gamma oscillations dynamically couple hippocampal CA3 and CA1 regions during memory task performance. Proc Natl Acad Sci U S A. 2007;104:14495–14500. doi: 10.1073/pnas.0701826104. [DOI] [PMC free article] [PubMed] [Google Scholar]
- Montgomery SM, Sirota A, Buzsaki G. Theta and gamma coordination of hippocampal networks during waking and rapid eye movement sleep. J Neurosci. 2008;28:6731–6741. doi: 10.1523/JNEUROSCI.1227-08.2008. [DOI] [PMC free article] [PubMed] [Google Scholar]
- Montgomery SM, Betancur MI, Buzsáki G. Behavior-dependent coordination of multiple theta dipoles in the hippocampus. J Neurosci. 2009;29:1381–1394. doi: 10.1523/JNEUROSCI.4339-08.2009. [DOI] [PMC free article] [PubMed] [Google Scholar]
- Mukovski M, Chauvette S, Timofeev I, Volgushev M. Detection of active and silent states in neocortical neurons from the field potential signal during slow-wave sleep. Cereb Cortex. 2007;17:400–414. doi: 10.1093/cercor/bhj157. [DOI] [PubMed] [Google Scholar]
- Nadasdy Z, Hirase H, Czurko A, Csicsvari J, Buzsáki G. Replay and time compression of recurring spike sequences in the hippocampus. J Neurosci. 1999;19:9497–9507. doi: 10.1523/JNEUROSCI.19-21-09497.1999. [DOI] [PMC free article] [PubMed] [Google Scholar]
- Nakashiba T, Buhl DL, McHugh TJ, Tonegawa S. Hippocampal CA3 output is crucial for ripple-associated reactivation and consolidation of memory. Neuron. 2009;62:781–787. doi: 10.1016/j.neuron.2009.05.013. [DOI] [PMC free article] [PubMed] [Google Scholar]
- Nguyen DP, Kloosterman F, Barbieri R, Brown EN, Wilson MA. Characterizing the dynamic frequency structure of fast oscillations in the rodent hippocampus. Front Integr Neurosci. 2009;3:11. doi: 10.3389/neuro.07.011.2009. [DOI] [PMC free article] [PubMed] [Google Scholar]
- Nokia MS, Penttonen M, Wikgren J. Hippocampal ripple-contingent training accelerates trace eyeblink conditioning and retards extinction in rabbits. J Neurosci. 2010;30:11486–11492. doi: 10.1523/JNEUROSCI.2165-10.2010. [DOI] [PMC free article] [PubMed] [Google Scholar]
- O'Keefe J, Nadel L. The hippocampus as a cognitive map. Cambridge, UK: Oxford UP; 1978. [Google Scholar]
- O'Neill J, Senior T, Csicsvari J. Place-selective firing of CA1 pyramidal cells during sharp wave/ripple network patterns in exploratory behavior. Neuron. 2006;49:143–155. doi: 10.1016/j.neuron.2005.10.037. [DOI] [PubMed] [Google Scholar]
- O'Neill J, Senior TJ, Allen K, Huxter JR, Csicsvari J. Reactivation of experience-dependent cell assembly patterns in the hippocampus. Nat Neurosci. 2008;11:209–215. doi: 10.1038/nn2037. [DOI] [PubMed] [Google Scholar]
- Pais I, Hormuzdi SG, Monyer H, Traub RD, Wood IC, Buhl EH, Whittington MA, LeBeau FE. Sharp wave-like activity in the hippocampus in vitro in mice lacking the gap junction protein connexin 36. J Neurophysiol. 2003;89:2046–2054. doi: 10.1152/jn.00549.2002. [DOI] [PubMed] [Google Scholar]
- Papatheodoropoulos C, Koniaris E. a5GABA(A) receptors regulate hippocampal sharp wave-ripple activity in vitro. Neuropharmacology. 2010;60:662–673. doi: 10.1016/j.neuropharm.2010.11.022. [DOI] [PubMed] [Google Scholar]
- Papatheodoropoulos C, Kostopoulos G. Spontaneous, low frequency (approximately 2–3 Hz) field activity generated in rat ventral hippocampal slices perfused with normal medium. Brain Res Bull. 2002;57:187–193. doi: 10.1016/s0361-9230(01)00738-9. [DOI] [PubMed] [Google Scholar]
- Pikovsky A, Rosenblum M, Kurths J. Synchronization: a universal concept in nonlinear sciences. Cambridge, UK: Cambridge UP; 2001. [Google Scholar]
- Ponomarenko AA, Li JS, Korotkova TM, Huston JP, Haas HL. Frequency of network synchronization in the hippocampus marks learning. Eur J Neurosci. 2008;27:3035–3042. doi: 10.1111/j.1460-9568.2008.06232.x. [DOI] [PubMed] [Google Scholar]
- Ramadan W, Eschenko O, Sara SJ. Hippocampal sharp wave/ripples during sleep for consolidation of associative memory. PloS One. 2009;4:e6697. doi: 10.1371/journal.pone.0006697. [DOI] [PMC free article] [PubMed] [Google Scholar]
- Reichinnek S, Künsting T, Draguhn A, Both M. Field potential signature of distinct multicellular activity patterns in the mouse hippocampus. J Neurosci. 2010;30:15441–15449. doi: 10.1523/JNEUROSCI.2535-10.2010. [DOI] [PMC free article] [PubMed] [Google Scholar]
- Sakata S, Harris KD. Laminar structure of spontaneous and sensory-evoked population activity in auditory cortex. Neuron. 2009;64:404–418. doi: 10.1016/j.neuron.2009.09.020. [DOI] [PMC free article] [PubMed] [Google Scholar]
- Schmitz D, Schuchmann S, Fisahn A, Draguhn A, Buhl EH, Petrasch-Parwez E, Dermietzel R, Heinemann U, Traub RD. Axo-axonal coupling. a novel mechanism for ultrafast neuronal communication. Neuron. 2001;31:831–840. doi: 10.1016/s0896-6273(01)00410-x. [DOI] [PubMed] [Google Scholar]
- Siapas AG, Wilson MA. Coordinated interactions between hippocampal ripples and cortical spindles during slow-wave sleep. Neuron. 1998;21:1123–1128. doi: 10.1016/s0896-6273(00)80629-7. [DOI] [PubMed] [Google Scholar]
- Singer AC, Frank LM. Rewarded outcomes enhance reactivation of experience in the hippocampus. Neuron. 2009;64:910–921. doi: 10.1016/j.neuron.2009.11.016. [DOI] [PMC free article] [PubMed] [Google Scholar]
- Sirota A, Csicsvari J., Buhl D, Buzsáki G. Communication between neocortex and hippocampus during sleep in rats and mice. Proc Natl Acad Sci U S A. 2003;100:2065–2069. doi: 10.1073/pnas.0437938100. [DOI] [PMC free article] [PubMed] [Google Scholar]
- Skaggs WE, McNaughton BL. Replay of neuronal firing sequences in rat hippocampus during sleep following spatial experience. Science. 1996;271:1870–1873. doi: 10.1126/science.271.5257.1870. [DOI] [PubMed] [Google Scholar]
- Staba RJ, Wilson CL, Bragin A, Fried I, Engel J., Jr Quantitative analysis of high-frequency oscillations (80–500 Hz) recorded in human epileptic hippocampus and entorhinal cortex. J Neurophysiol. 2002;88:1743–1752. doi: 10.1152/jn.2002.88.4.1743. [DOI] [PubMed] [Google Scholar]
- Steriade M, Nuñez A, Amzica F. A novel slow (<1 Hz) oscillation of neocortical neurons in vivo: depolarizing and hyperpolarizing components. J Neurosci. 1993;13:3252–3265. doi: 10.1523/JNEUROSCI.13-08-03252.1993. [DOI] [PMC free article] [PubMed] [Google Scholar]
- Suzuki SS, Smith GK. Spontaneous EEG spikes in the normal hippocampus. I. Behavioral correlates, laminar profiles and bilateral synchrony. Electroencephalogr Clin Neurophysiol. 1987;67:348–359. doi: 10.1016/0013-4694(87)90123-4. [DOI] [PubMed] [Google Scholar]
- Tass P, Rosenblum MG, Weule J, Kurths J, Pikovsky AS, Volkmann J, Schnitzler A, Freund HJ. Detection of n:m phase locking from noise data: application to magnetoencephalography. Phys Rev Lett. 1998;81:3291–3294. [Google Scholar]
- Taxidis J, Coombes S, Mason R, Owen MR. Modeling sharp wave-ripple complexes through a CA3-CA1 network model with chemical synapses. Hippocampus. 2011 doi: 10.1002/hip.20930. [DOI] [PubMed] [Google Scholar]
- Traub R, Bibbig A. A model of high frequency ripples in the hippocampus based on synaptic coupling plus axon-axon gap junctions between pyramidal neurons. J Neurosci. 2000;20:2086–2093. doi: 10.1523/JNEUROSCI.20-06-02086.2000. [DOI] [PMC free article] [PubMed] [Google Scholar]
- Traub RD. Fast Oscillations and Epilepsy. Epilepsy Curr. 2003;3:77–79. doi: 10.1046/j.1535-7597.2003.03301.x. [DOI] [PMC free article] [PubMed] [Google Scholar]
- Traub RD, Draguhn A, Whittington MA, Baldeweg T, Bibbig A, Buhl EH, Schmitz D. Axonal gap junctions between principal neurons: a novel source of network oscillations, and perhaps epileptogenesis. Rev Neurosci. 2002;13:1–30. doi: 10.1515/revneuro.2002.13.1.1. [DOI] [PubMed] [Google Scholar]
- Wang XJ. Neurophysiological and computational principles of cortical rhythms in cognition. Physiol Rev. 2010;90:1195–1268. doi: 10.1152/physrev.00035.2008. [DOI] [PMC free article] [PubMed] [Google Scholar]
- Whittington MA, Cunningham MO, LeBeau FE, Racca C, Traub RD. Multiple origins of the cortical gamma rhythm. Dev Neurobiol. 2011;71:92–106. doi: 10.1002/dneu.20814. [DOI] [PubMed] [Google Scholar]
- Wilson MA, McNaughton BL. Reactivation of hippocampal ensemble memories during sleep. Science. 1994;265:676–679. doi: 10.1126/science.8036517. [DOI] [PubMed] [Google Scholar]
- Wittner L, Henze DA, Zaborszky L, Buzsáki G. Three-dimensional reconstruction of the axon arbor of a CA3 pyramidal cell recorded and filled in vivo. Brain Struct Funct. 2007;212:75–83. doi: 10.1007/s00429-007-0148-y. [DOI] [PMC free article] [PubMed] [Google Scholar]
- Wolansky T, Clement EA, Peters SR, Palczak MA, Dickson CT. Hippocampal slow oscillation: a novel EEG state and its coordination with ongoing neocortical activity. J Neurosci. 2006;26:6213–6229. doi: 10.1523/JNEUROSCI.5594-05.2006. [DOI] [PMC free article] [PubMed] [Google Scholar]
- Wu C, Asl MN, Gillis J, Skinner FK, Zhang L. An in vitro model of hippocampal sharp waves: regional initiation and intracellular correlates. J Neurophysiol. 2005;94:741e753. doi: 10.1152/jn.00086.2005. [DOI] [PubMed] [Google Scholar]
- Ylinen A, Bragin A, Nadasdy Z, Jando G, Szabo I, Sik A, Buzsáki G. Sharp wave-associated high-frequency oscillation (200 Hz) in the intact hippocampus: network and intracellular mechanisms. J Neurosci. 1995;15:30–46. doi: 10.1523/JNEUROSCI.15-01-00030.1995. [DOI] [PMC free article] [PubMed] [Google Scholar]