

Abstract
Endonuclease III (EndoIII) is a base excision repair glycosylase that targets damaged pyrimidines and contains a [4Fe-4S] cluster. We have proposed a model where BER proteins that contain redox-active [4Fe-4S] clusters utilize DNA charge transport (CT) as a first step in the detection of DNA lesions. Here, several mutants of EndoIII were prepared to probe their efficiency of DNA/protein charge transport. Cyclic voltammetry experiments on DNA-modified electrodes show that aromatic residues F30, Y55, Y75 and Y82 help mediate charge transport between DNA and the [4Fe-4S] cluster. Based on circular dichroism studies to measure protein stability, mutations at residues W178 and Y185 are found to destabilize the protein; these residues may function to protect the [4Fe-4S] cluster. Atomic force microscopy studies furthermore reveal a correlation in the ability of mutants to carry out protein/DNA CT and their ability to relocalize onto DNA strands containing a single base mismatch; EndoIII mutants that are defective in carrying out DNA/protein CT do not redistribute onto mismatch-containing strands, consistent with our model. These results demonstrate a link between the ability of the repair protein to carry out DNA CT and its ability to relocalize near lesions, thus pointing to DNA CT as a key first step in the detection of base damage in the genome.
With millions of DNA bases encountering more than 10,000 oxidative lesions per day (1), DNA repair proteins are charged with the daunting task of searching an entire genome to detect and repair these multiple sites of damage (2, 3). Our laboratory has proposed that DNA repair proteins search for DNA lesions by exploiting DNA/protein charge transport (CT). DNA CT occurs over long molecular distances but is remarkably sensitive to DNA lesions (4, 5, 6). Endonuclease III (EndoIII) and MutY are base excision repair (BER) proteins in Escherichia coli that contain [4Fe-4S] clusters which, when bound to DNA, are activated toward one electron oxidation (7,8). EndoIII and MutY homologues are found in many species, ranging from bacteria to humans, and their structural biology and enzymatic properties have been studied in great detail by both crystallography (9–14) and mutagenesis-based enzymology (7, 13, 15–22). Both enzymes are present in low copy number in vivo (~30 copies per cell of MutY and ~500 copies per cell of EndoIII) (3), making their ability to find and repair DNA lesions all the more remarkable. MutY has also drawn attention from the biomedical community because patients with mutations in its human homologue, MUTYH, are predisposed towards developing colorectal cancer (23–27).
Despite these extensive studies, two features of the BER family of enzymes remain intriguing to consider. First, what is the role of the [4Fe-4S] cluster? The [4Fe-4S] cluster does not participate in base excision in either enzyme, nor is it necessary for MutY to fold properly (7), although it is essential for MutY to bind DNA. Secondly, how are these proteins able to scan the vast amount of DNA present in a cell in order to detect their substrate lesions? Although the excision step in repair by these BER glycosylases has been well characterized, the answer to these questions has not been resolved.
Our laboratory has proposed a model in which MutY and EndoIII cooperatively scan the genome for DNA lesions using their [4Fe-4S] clusters to participate in DNA-mediated redox signaling (28–31). DNA mediates CT very efficiently owing to the π-stacking of the aromatic, heterocyclic base pairs within the helix (5, 32, 33). CT through proteins occurs through a variety of mechanisms (34–39). These CT mechanisms could permit charge to travel from the DNA into a bound protein, and then through the protein to a redox-active cofactor, such as a [4Fe-4S] cluster. In this model, under oxidative stress, oxidation of some DNA-bound protein occurs by a nearby guanine radical, taking the [4Fe-4S] cluster from the 2+ form to 3+. DNA-mediated CT to another distally DNA-bound protein would lead to its reduction and dissociation. This CT process relies on proper π-stacking of the bases between the donor protein and the distal acceptor protein, however (28); if the π-stack is perturbed by a lesion, DNA-mediated CT will not proceed. Thus this signaling serves as a scan for the integrity of the intervening DNA as the first step in damage detection, promoting the dissociation of repair proteins away from unmodified DNA and leading to their relocalization in the vicinity of damage (Figure 1).
Figure 1. Model for the first step in damage detection by BER proteins.

Given two repair proteins of similar potential (red and blue), CT can proceed through well-matched unmodified DNA (top). Stimulated through oxidation by guanine radicals (yellow) formed under oxidative stress, DNA CT occurs between DNA-bound repair proteins, promoting the dissociation of reduced protein. DNA CT does not occur (bottom), however, in the presence of an intervening mismatch or lesion (red X); repair proteins are not reduced, do not dissociate, and instead remain bound in the vicinity of the lesion. On a slower timescale, the proteins can then processively move to the lesion site for repair. This process leads to the redistribution of proteins in the vicinity of the lesion.
One question that remains is how charge is transported from the DNA, through the protein, to the [4Fe-4S] cluster of MutY or EndoIII. Specifically, which amino acids in these proteins facilitate CT between the DNA helix and the protein metal cluster? One EndoIII mutant, Y82A, has already been shown to be deficient in CT activity, implicating Y82 as a crucial residue in the CT pathway of EndoIII (28). The current study builds on this result by characterizing several novel mutants of EndoIII to discover other residues that mediate protein/DNA CT. Several categories of mutants were prepared, including five additional mutants at or near the Y82 position, to better assess the types of amino acid side chains that are CT proficient in EndoIII. Mutations were also made targeting other aromatic residues in the protein because aromatic amino acids have been shown to mediate CT in other systems (35–39). A third category of mutations were made near the [4Fe-4S] cluster, assuming that amino acids close to this redox-active moiety would likely lie along the CT pathway. All of the mutants were characterized by cyclic voltammetry on DNA-modified electrodes, glycosylase assays, and some by circular dichroism (CD) spectroscopy. These experiments helped us identify several amino acids that facilitate CT between the DNA helix and the [4Fe-4S] cluster.
Upon characterization of EndoIII mutants, we then applied them in atomic force microscopy (AFM) studies to examine this first step of lesion detection. AFM is a valuable technique that allows for visualization of single-molecule protein/DNA interactions (40– 42). AFM requires very low concentrations of DNA and protein for measurements and relies on cationic interactions for DNA/surface contact rather than chemical modifications. AFM images can be used to pinpoint the position of proteins on DNA, and hence the statistical distribution of proteins along the strand (43, 44). Here, then AFM may be used to test our model of protein redistribution on DNA in the vicinity of a lesion that interferes with CT. Indeed we find a correlation between the ability of mutants to carry out DNA/protein CT and their ability to relocate near a single base mismatch.
MATERIALS AND METHODS
Preparation of DNA and protein samples for electrochemistry experiments
Redmond Red (RR) is a redox active probe used to quantify the amount of DNA on the electrode surface (45). The sequences used for electrochemistry experiments were SH-(C6H12)-(RR)-5′-GA GAT ATA AAG CAC GCA-3′ and complement, and SH-(C6H12)-5′-AGT ACA GTC ATC GCG-3′ annealed to 5′-CGC GAT GAC TGT ACT-3′-RR. Redmond Red was connected to the oligonucleotide via a pyrrolidinyloxy linker. Redmond Red-labeled DNA was prepared according to established methods (4). Briefly, all DNA sequences were prepared using standard phosphoramidite chemistry on an Applied Biosystems 3400 DNA synthesizer. Phosphoramidites were purchased from Glen Research. For thiolated strands, the 5′ end was modified with the Thiol Modifier C6 S-S phosphoramidite using standard protocols from Glen Research, Inc. DNA modified with Redmond Red on the 3′ terminus was prepared on Epoch Redmond Red CPG columns from Glen Research with ultramild phosphoramidites and reagents. DNA modified with Redmond Red attached to the thiol was prepared with Epoch Redmond Red phosphoramidite from Glen Research with ultramild phosphoramidites and reagents.
Deprotection, purification, chemical modification of DNA, annealing, and preparation of the DNA-modified Au electrode were performed as described previously ( 6, 46–48). Au substrates were purchased from Agilent Technologies. Each experiment used 50 μL of 50–100 μM EndoIII in protein buffer (20 mM NaH2PO4 pH 7.5, 100 mM NaCl, 5% glycerol, 1 mM EDTA). The protein concentration was quantified using ε410= 17,000 M−1cm−1 (49).
Cyclic Voltammetry
All cyclic voltammetry experiments were performed as described previously (28–30). A Au on mica (Molecular Imaging) electrode was assembled and incubated with thiol-modified DNA duplex for 24–36 hours in the absence of Mg2+; under these conditions, the DNA is loosely packed on the surface and protein can diffuse through the monolayer. The electrode was then backfilled with 1 mM mercaptohexanol, rinsed in DNA buffer (50 mM NaCl, 5 mM NaH2PO4 pH 7.5), and then rinsed in protein buffer before protein samples were added to the surface. The DNA-modified Au electrode served as the working electrode, a Pt wire served as the auxiliary electrode, and the reference was either a Ag/AgCl electrode modified with an agarose tip or a 66-EE009 Ag/AgCl reference electrode (ESA Biosciences). All scans were taken at a rate of 50 mV/s on a CH Instruments 760 potentiostat. To begin an experiment, a protein sample was placed on an electrode surface and successive scans were taken every five minutes until the signal stabilized. Protein concentrations used were those required to saturate binding to the surface as determined by titration (29,30). It should be noted that interfacial electron transfer rates redox moieties bound to DNA on these DNA-modified surfaces are limited by tunneling through the alkane-thiol linker based on measurements of peak widths as a function of scan rate (4).
To determine the relative CT efficiencies of EndoIII mutants, the signal intensity of the proteins was normalized to DNA concentration using the intensity of the Redmond Red signal and compared one to another on the same surface. For each comparison, the protein samples were measured consecutively on the same electrode surface. Thus, to compare the CT signal strength of each mutant relative to WT EndoIII, the peak under the reductive and/or oxidative cyclic voltammogram curve (consistently for different proteins on a given surface) was measured using the linear baseline correction of CH Instruments’ Electrochemical Workstation software program. After each measurement of a protein sample, the electrode surface was rinsed, and the measurement was repeated for the Redmond red signal. The intensity measured for each mutant was divided by that of the Redmond-red signal measured on the rinsed electrode immediately following the mutant scan. This ratio was also tabulated for wild-type EndoIII on each electrode. The final ratios reported are those of the Redmond-red corrected mutant value divided by the Redmond-red corrected wild-type value. This procedure provides a correction for the variability in surface coverage associated with individual DNA-modified surfaces. Surface coverages were typically 5 pmole/Å2 but variations of ~50% were apparent for different electrodes on different days.
Preparation of EndoIII over-expression construct
The nth gene that encodes EndoIII was cloned using the Failsafe System with Buffer G (Epicentre Biotechnologies) and plasmid pBBR1MCS-4 (50) which contains the nth gene as a template. (This construct was originally prepared by cloning the nth gene from Escherichia coli chromosomal DNA). Primers used were 5′-CGC CCGCG GTGGT ATG AAT AAA GCA AAA GCG CTG– 3′ and 5′-CGC GGATCC TCA GAT GTC AAC TTT CTC TTT- 3′. PCR products were purified on a 1% agarose gel and then excised using the QIAquick gel extraction kit (Qiagen). These fragments were ligated into the BamHI and SacII sites of the pET11-ubiquitin-His vector, which expresses hexahistidine and ubiquitin tags at the N-terminus of the insertion site. This vector was derived from the pET11 vector (Novagen), but the ubiquitin gene and hexahistidine tag were engineered into the vector by the laboratory of S. Mayo, from whom this vector was a kind donation. The ligation reaction was used to transform both DH5α E. coli (Invitrogen) for sub-cloning, and BL21star(DE3)pLysS E. coli (Invitrogen) for over-expression. Transformants resistant to ampicillin and chloramphenicol were selected and the plasmids were isolated using the QIAPrep MiniPrep kit (Qiagen). After the size of the insert was verified by restriction digestion, plasmids from positive transformants were submitted for sequencing (Laragen). Freezer stocks of transformants containing the correct EndoIII sequence were prepared and stored at −80°C.
Purification of EndoIII and mutants
WT EndoIII and Y82A samples used for AFM experiments were prepared as described previously (28). Protein samples for other experiments and all other mutants were prepared as described here. Freezer stocks of BL21star(DE3)pLysS containing pET11-ubiquitin-His with the nth gene were used to inoculate 10 mL of LB media containing 100 μg/mL ampicillin and 30 μg/mL chloramphenicol. Each 10 mL culture was incubated at 37°C overnight and then used to inoculate 1 L of LB/ampicillin/chloramphenicol. Each 1 L flask was grown to OD600 = 0.6 at 37°C and then isopropyl β-D-1-thiogalactopyranoside was added to a total concentration of 0.3 mM. Cells were incubated at 30°C for 3.5 hours and harvested by centrifugation (5000 rpm, 10 minutes). Pellets were stored at −80°C. For lysis, pellets were dissolved in 25 mL lysis buffer (50 mM Tris-HCl, pH 8, 5% glycerol, 250 mM NaCl, 5 mM DTT, 1 mM phenylmethylsulfonyl fluoride) and lysed by sonication. Cell lysate was fractionated by centrifugation (7000 rpm, 10 minutes). The supernatant was filtered, and then loaded onto a 5 mL HisTrap HP column (GE Healthcare) pre-equilibrated with binding buffer (20 mM sodium phosphate, 0.5 M NaCl, 20 mM imidazole, 1 mM DTT, pH 7.4) at a flow rate of ~ 1mL/min. The column was washed with binding buffer until the UV baseline was stable. The fusion protein was eluted using a gradient of 0–100% elution buffer (20 mM sodium phosphate, 0.5 M NaCl, 500 mM imidazole, 1 mM DTT, pH 7.4) over 10–20 column volumes on an AKTA FPLC (GE Healthcare). Fractions containing protein (determined by their yellow color) were pooled and loaded onto a Superose 12 column (GE Healthcare) that had been pre-equilibrated with Superose 12 Buffer (50 mM NaH2PO4, 0.15 M NaCl, pH 7.0). The tagged EndoIII, His6-ubiquitin- EndoIII, eluted after ~ 12 mL. Fractions containing EndoIII were pooled and dialyzed overnight into protein storage buffer (20 mM sodium phosphate pH 7.5, 0.5 mM EDTA, 100 mM NaCl, 20% glycerol). Aliquots of 50–70 μL EndoIII were prepared, frozen in dry ice, and stored at −80°C. Protein purity was assessed by SDS-PAGE, and concentration was measured using ε410= 17,000 M−1cm−1 (49).
Site-directed mutagenesis
Mutations were encoded on the pET-11 based EndoIII overexpression plasmid using the Quikchange Site-Directed Mutagenesis Kit (Stratagene). Primers used are listed in the supporting material, where uppercase letters indicate the encoded mutation. DNA primers were purchased from Integrated DNA Technologies. All mutagenized plasmids were sequenced (Laragen) to verify accurate mutagenesis before being used for protein over-expression.
Instrumentation
All protein samples were examined using a Beckman DU 7400 spectrophotometer. Protein concentration was measured using ε410 = 17,000 M−1cm−1 (49).
Circular Dichroism
Samples were measured at a concentration of ~ 5 μM at ambient temperature on a Model 62A DS Circular Dichroism Spectrometer (AVIV, Lakewood, NJ). For thermal denaturation experiments, the temperature was varied from 20°C to 60°C. Each trace shown is the average of at least three independent experiments.
DNA glycosylase assay
This protocol was adapted from methods described previously (15). DNA strands synthesized were 5′-TGT CAA TAG CAA GXG GAG AAG TCA ATC GTG AGT CT- 3′ where X = 5-hydroxyuracil, and the complement with G opposite X. DNA was prepared using standard phosphoramidite chemistry with reagents purchased from Glen Research. Prior to annealing, single-strand DNA was purified using reversed-phased HPLC and the substrate-containing strand was 5′-radiolabeled using 32P-ATP (51) with polynucleotide kinase purchased from Roche.
Glycosylase activity was determined by monitoring nick formation in the hydroxyuracil-containing duplex using denaturing gel electrophoresis (16). For this assay, 100 nM radiolabeled duplex was incubated with EndoIII or a variant at a range of concentrations (10 nM, 100 nM or 1 μM) in reaction buffer (10 mM Tris pH = 7.6, 1 mM EDTA, 50 mM NaCl) for 15 minutes at 37°C. The reactions were quenched upon addition of NaOH to a final concentration of 100 nM. Samples were dried, counted by scintillation, and diluted with loading buffer (80% formamide, 10 mM NaOH, 0.025% xylene cyanol, 0.025% bromophenol blue in Tris-Borate-EDTA buffer) to normalize the radioactivity. Samples were then heated at 90°C for five minutes prior to loading and then separated by denaturing PAGE. Glycosylase activity was determined by quantifying the amount of 14-mer product visualized in the gel relative to the total amount of DNA present.
Mismatched (C:A) Strand Synthesis
Four primers with the following sequences were synthesized using standard phosphoramidite chemistry:
5′-GTACAGAGTTCAGTCGGCATCCGCTTACAGACAAGC-3′ (forward),
5′-CCGGTAACTATCGTCTTGAGTCC-3′ (reverse),
5′-GACTGAACTCTGTACCTGGCACGACAGGTTTCCCG-3′ (forward),
5′-GACTGAACTCTATACCTGGCACGACAGGTTTCCCG-3′ (forward)
The underlined bases highlight the location of a 2′-O-methyl residue (Glen Research). Primers were phosphorylated using 5 U PNK, 10% PNK buffer, 0.5 mM ATP for 5 hrs at 37 °C. Primers were purified using phenol-chloroform extraction followed by ethanol precipitation (52). After being dried in vacuo, primers were redissolved in 20 μL water and used in separate PCR reactions (53) using pUC19 as a template to generate two duplexes 1610 bp, 2157 bp (matched), or 3767 bp (mismatched) long and each containing one 14-nucleotide single-strand overhang. Each 100 μL PCR reaction contained 50 pmol of each of two primers, 1X Taq buffer (100 mM Tris-HCl, 15 mM MgCl2, 500 mM KCl, pH 8.3, 0.2 mM each dNTP, 1 ng plasmid template pUC19 and 3 U Taq polymerase (Roche). A typical step program for PCR was as follows: After incubation at 94°C for 10 minutes, 34 cycles were performed as follows: 94°C for 1 minute, (52°C for primers 1+2, 54°C for primers 2+3 or 2+4), for 1 min, and 72°C for 3 minutes. The PCR product was then suspended in 50 mM NaCl/5mM phosphate buffer and quantitated. Separate duplexes were annealed at 65 °C for 8 min in 10 mM Tris buffer, then cooled to 20 °C during 2 h. A total of 15 units of T4 DNA ligase (New England Biolabs) and 10% T4 ligase buffer were added (total reaction volume ~20 μL) and incubated overnight at 16 °C, followed by deactivation for 10 min at 65 °C. We did not bring the ligation reaction to completion, so as to obtain a mixture of DNA samples that were equivalent other than the presence of the mismatch at the ligation site. The DNA duplexes (ligated and unligated) were then analyzed by 0.6% agarose gel electrophoresis.
AFM Experiments
The protocol used was similar to that reported previously (28). Briefly, mica surfaces were freshly cleaved with tape. EndoIII (0.4 μM) (28), stored in 20 mM phosphate, 20 mM NaCl, 20% glycerol, 1 mM EDTA was added to the stock DNA solution containing 50 –100 ng of total DNA composed of the mixture of ligated 3.8-kbp duplexes and the two unligated duplexes (1.6 and 2.2 kb) in 6 mM MgCl2/Tris-EDTA buffer. This protein/DNA solution was incubated at 4 °C overnight and deposited (5–10 μL) on the mica surface for 1–2 min, rinsed with 2 mL of water, and dried under argon. Two of the five WT EndoIII samples analyzed were deposited onto the mica surface in 5 ng quantities, followed by immediate addition of 3.7 μM EndoIII (1 μL volume). This difference in deposition conditions did not result in any significant differences in the trends observed. Mutant protein (Y82A) was added to a stock solution of 50 ng DNA for a final protein concentration of 0.4 μM. After incubation at 4 °C overnight, deposition conditions were identical to that for WT EndoIII- DNA samples. For Y82F EndoIII, W178A EndoIII, or Y75A EndoIII mutants(0.6 μM), stored in 20 mM sodium phosphate, pH 7.5, 100 mM NaCl, 20% glycerol, and 0.5 mM EDTA, protein/DNA complexes were formed with DNA solution containing ~200 ng of the mixture of ligated PCR product as well as the two non-ligated duplexes with overhangs (~6 μM DNA) in 6 mM MgCl2/Tris-EDTA buffer at 4°C overnight. The reaction mixture was then deposited (5–10 μL) on the mica surface for 1–2 minutes, rinsed with 2 mL water and dried under argon.
AFM Instrumentation
Silicon AFM Probes purchased from Nanoscience Instruments (BudgetSensors), with a spring constant of 3 N/m and a resonance frequency of 75 kHz, were used in a Digital Instruments Multimode SPM. Images were captured in air with scan areas of 2×2 μm2 or 3×3 μm2 in tapping mode, at an amplitude of 0.54–2.00 V, and at a scan rate of 3.05 Hz. Scan rates of 3.05 Hz were used in order to obtain images of higher quality.
Binding Density Ratio Calculations
WSxM software was used to measure general DNA contour lengths and height profiles of the proteins as described previously (28, 54). For each data set, images from at least three independent samples were analyzed, compared, and pooled (>200 long or short strands). Distinguishable strands and proteins were counted by hand. The binding density ratio, r, is defined as the ratio of the proteins bound on long strands divided by proteins bound on short strands. The ratio is normalized for length by dividing by 1.9 kbp, which is the average length of the short strands. The uncertainty was determined through the total number of proteins observed.
RESULTS
Electrochemistry on DNA-modified electrodes
The CT capabilities of several mutants of EndoIII were investigated on DNA-modified electrode surfaces passivated with mercaptohexanol (Figure 2). This strategy has been used previously to measure the DNA-bound electrochemical properties of proteins containing [4Fe-4S] clusters (28, 30). In this study, the thiolated DNA duplex was also modified with Redmond Red, a redox probe whose signal intensity can be used to measure the amount of DNA on a given electrode surface (45). The Redmond Red was positioned so that it could contact the Au surface and be directly reduced without requiring DNA-mediated reaction.
Figure 2. Quantitative cyclic voltammetry of EndoIII variants on DNA- modified electrodes.

(A) Schematic of DNA-modified electrochemistry. A Au surface is treated with thiol-modified DNA and then backfilled with mercaptohexanol. The covalent Redmond Red redox probe, (red oval), is used to quantify the amount of DNA on the surface. Each protein mutant was allowed to bind DNA on such a surface, and the [4Fe-4S] cluster was measured by cyclic voltammetry. The protein was then rinsed from surface and WT was measured on the same surface. (B) Representative cyclic voltammogram of Y82S (brown) compared to WT EndoIII (blue). Y82S exhibits a weaker electrochemical signal. For reference, a scan taken in the absence of protein (buffer only) is also shown (gray). (C) Representative cyclic voltammogram of W178A (orange) compared to WT EndoIII (blue) and a buffer-only scan (gray). (D) The CT capability of each mutant was quantified based on the area under its redox peak. Each mutant’s signal intensity was normalized to the intensity of the signal for WT measured on the same surface.
For each EndoIII sample, the electrochemical signal grew in over 30–45 minutes. Scan rate dependence measurements on the protein signal showed a linear relationship between the peak current and the square root of scan rate, indicative of a diffusion-limited process (55). These same experiments showed a linear relationship between the peak current of Redmond Red and scan rate, indicative of a surface-bound species. Thus, while the modified DNA is surface bound, the protein freely diffuses to the DNA. Figures 2B and 2C show typical cyclic voltammograms of two separate surfaces, with two peaks evident, one from the [4Fe-4S] cluster of the DNA-bound protein and one from the Redmond Red probe. When compared on these surfaces, all mutants exhibited midpoint potentials of 80 (±30) mV vs. NHE, and all were within error of that of WT (Table 1). While the DNA-bound potential for these mutants was seen to be invariant, significant variations in redox signal intensity were observed (Table 1 and Figure 2D). The signal strength of each mutant was quantified and normalized to the amount of DNA covalently bound on the electrode. To compare the signal strength of each mutant relative to that of WT, these signals were then normalized to the Redmond Red-corrected signal strength of WT EndoIII measured on the same surface. This normalization accounts for the variability in surface coverage associated with different electrodes.
Table 1.
DNA Electrochemistry of EndoIII Mutants a
| EndoIII | Midpoint potential (mV vs. NHE)b | Mutant/WT Ratio (RR corrected) |
|---|---|---|
| WT | 78 | |
| F30A | 97 | 0.88 ± 0.03 |
| Y55A | 97 | 0.7 ± 0.1 |
| Y75A | 88 | 0.6 ± 0.2 |
| L81C | 84 | 1.1 ± 0.2 |
| Y82C | 92 | 0.8 ± 0.6 |
| Y82F | 91 | 1.2 ± 0.4 |
| Y82S | 91 | 0.4 ± 0.2 |
| Y82W | 92 | 1.4 ± 0.4 |
| H140Ac | 71 | 1.0 ± 0.2 |
| W178A | 83 | 3.5 ± 2.3 |
| Y185A | 85 | 2.2 ± 1.2 |
Experimental conditions are described in materials and methods. Each experiment used 50 μL of 50–100 μM EndoIII in protein buffer (20 mM NaH2PO4 pH 7.5, 100 mM NaCl, 5% glycerol, 1 mM EDTA).
Measurements have an uncertainty of ± 30 mV
This sample was not measured using Redmond Red-modified DNA, although extra trials were performed to verify the midpoint potential and signal strength ratio that are shown.
Among the first samples to be examined were mutants relevant to colorectal cancer research, those at positions L81 and Y82. Y82F and Y82W exhibit signal strengths within error of that of WT, suggesting that other aromatic residues at position 82 confer CT capabilities equivalent to those of the native tyrosine. By contrast, Y82S exhibits a very weak electrochemical signal relative to WT (Figure 2B, 2D). The signal intensity from Y82C is on average the same as that of WT, although highly variable, possibly due to the ability of cysteine to facilitate electron transfer in certain contexts (34, 56, 57), albeit through the formation of an unstable radical.
After the experiments with Y82 mutants established the importance of aromatic residues for DNA/protein CT, other aromatic amino acids in EndoIII were targeted for mutagenesis studies. F30A, Y55A, Y75A, and H140A were examined. The first three of these mutants all displayed a CT deficiency relative to WT EndoIII (Figure 2D). In the protein structure, Y75, Y55, and F30 are relatively close to Y82, and form a line along one side of the protein (10, 12, 14). These residues may comprise a pathway of aromatic amino acids through which electrons can travel efficiently. Such aromatic “π-ways” have been found in other peptides (38, 39). The H140A mutant, by contrast, proved CT-proficient in the experiments performed here so no conclusions can be made about its electrochemical properties. However, this residue was found to be enzymatically important (Table 2).
Table 2.
Summary of Glycosylase Assay Results with EndoIII Mutantsa
| EndoIII | % Activity relative to WT at 1μM concentration |
|---|---|
| F30A | 93.7 ± 2.6 |
| Y55A | 96.7 ± 1.0 |
| Y75A | 99.8 ± 4.0 |
| L81C | 99.2 ± 0.6 |
| Y82C | 99.2 ± 0.5 |
| Y82F | 99.4 ± 1.1 |
| Y82S | 99.4 ± 1.6 |
| Y82W | 98.1 ± 3.6 |
| H140A | 39.1 ± 6.8 |
| W178A | 98.2 ± 1.7 |
| Y185A | 97.3 ± 0.6 |
Experimental conditions are described in materials and methods. Experiments were conducted using 1 μM protein and 100 nM annealed duplex in reaction buffer (10 mM Tris pH = 7.6, 1 mM EDTA, 50 mM NaCl) for 15 minutes at 37°C. The reactions were quenched upon addition of NaOH to a final concentration of 100 nM. Samples were dried, counted by scintillation, and diluted with loading buffer (80% formamide, 10mM NaOH, 0.025% xylene cyanol, 0.025% bromophenol blue in Tris-Borate-EDTA buffer) to normalize the radioactivity. Samples were then heated at 90°C for five minutes prior to loading and then separated by denaturing PAGE Glycosylase activity was determined by comparing the amount of 14-mer produced to the total amount of DNA. The glycosylase activity of each mutant as a percentage of WT is shown. Most mutants have activity within error of that of WT.
The final category of EndoIII mutants examined were W178A and Y185A, substitutions involving aromatic residues close to the [4Fe-4S] cluster. These mutants were expected to produce weak electrochemical signals because of their proximity to the metallocluster, but they instead produced signals that were large and highly variable relative to WT (Figure 2C, 2D). One explanation for this phenomenon is protein aggregation, as denatured samples can produce large and erratic signals on DNA-modified electrodes (data not shown). However, because the midpoint potentials of these mutants are within error of those produced by other EndoIII samples, it is unlikely that the [4Fe-4S] cluster degraded in W178A and Y185A, given that [3Fe-4S] clusters have different potentials (58–60) than the [4Fe-4S] cluster. These results with W178A and Y185A prompted further experiments, described below, that suggest these residues may help protect the [4Fe-4S] cluster from exposure to solvent.
Enzymatic assays of mutant glycosylase activity
The glycosylase activity of each mutant was measured according to established methods (15, 28). Briefly, 35-mer strands of DNA were synthesized with 5-hydroxyuracil (5-OH-dU), an EndoIII substrate analogue, incorporated into the sequence. The sequence was 5′-radiolabeled with 32P-ATP and annealed to its complement. Solutions of 100 nM DNA were incubated with 1 μM enzyme. Active enzymes will remove 5-OH-dU from the DNA backbone, leaving an abasic site whose phosphodiester bonds are cleaved with 1 M NaOH. This cleavage produces a 14-mer strand, which can be visualized by denaturing PAGE and autoradiography (Figure S1). The amount of 14-mer relative to the total quantity of DNA was used to assess enzymatic activity. Mutants that are glycolytically active bind DNA comparably to WT, while mutants that bind DNA poorly show diminished glycolytic activity (15–17). Consequently, this experiment is an important complement to the electrochemical studies, as it verifies that any weak cyclic voltammetry signals produced by mutants stem from a CT deficiency and not an inability to bind DNA.
Of the eleven mutants examined, most were found to exhibit glycosylase activity within error of that of WT EndoIII (Table 2). The exceptions were F30A and H140A. F30A was slightly impaired in its glycolytic activity, possibly because F30 is located near the substrate binding pocket of EndoIII (10, 12, 14), so mutations at this position may impede DNA binding. H140A is deficient in glycosylase activity relative to WT. In earlier crystallographic studies, the H140 residue was identified as possibly increasing DNA binding by providing a positively charged histidine (12). The enzymatic activity results presented here are consistent with that hypothesis.
Circular dichroism to examine the structural stability of EndoIII mutants
While most of the mutants examined gave electrochemical signals with intensities weaker than or within error of those of WT EndoIII, the mutants W178A and Y185A were exceptions to this trend. Consequently, CD experiments were performed to examine the secondary structure of W178A and Y185A. The CD spectra of WT EndoIII and several mutants were examined for both fully folded and thermally denatured protein (Figure 3A). All folded samples exhibited similar spectral shapes.
Figure 3. Circular dichroism of EndoIII.

(A) Comparison of fully folded and denatured spectra of EndoIII. Samples were measured at room temperature at a concentration of ~5 μM. WT spectra are shown, although all mutants displayed a similar trend with denatured samples (gray) consistently displaying less ellipticity than fully folded samples (blue). The spectra shown are the average of three trials. (B) Circular dichroism thermal denaturation of select EndoIII variants. Samples were measured at concentrations of ~ 5 μM. Each trace shown is the average of at least three independent experiments. The graphs show the fractional change in ellipticity for each variant measured, where the fully folded protein was given a value of 0 and the denatured form was given a value of 1, consistent with previous secondary structure studies (7). The variants WT (dark blue) and Y82F (pale blue) display more structural stability than W178A (orange) and Y185A (black).
In order to examine the stability of W178A and Y185A relative to WT EndoIII, thermal denaturation experiments were performed. In these experiments, the protein sample was heated gradually and its ellipticity was measured as a function of temperature. The ellipticity of all variants measured decreased with increasing temperature, but W178A and Y185A denatured at a lower temperature than WT EndoIII and a CT proficient mutant, Y82F (Figure 3B). These data indicate that W178A and Y185A are less stable than WT EndoIII.
Experimental strategy using AFM to probe protein redistribution
We tested our model for protein redistribution stimulated by DNA CT by preparing DNA strands containing a single base mismatch, a modification that inhibits CT, and DNA strands containing no mismatches. Our model would predict the redistribution of proteins onto the mismatched strands. To distinguish the strands by AFM, we made mismatched strands >1000 base pairs longer than the matched strands. We employed AFM to obtain a snapshot of repair proteins bound to DNA as they search for damage (Figure 4).
Figure 4. Atomic force microscopy to visualize protein.

Tapping mode AFM images of DNA and EndoIII protein on mica imaged in air. The mixture of mismatched and matched strands (A) or fully matched long and short strands (B) and protein (dots) are visible on the surface. Images were acquired with a scan size of 2 × 2 μm2 or 3 × 3 μm2, at a rate of 3.05 Hz with a data scale of 10 nm/0.5 V. In C is shown a zoomed-in image of a DNA strand with a bound protein subjected to height profiling to distinguish protein; the profile of the strand, to the right of the zoomed-in image, shows the height of DNA ranges from 1–2 nm, with a much higher protein peak. In D is an AFM image taken of the DNA in the absence of protein.
Long (3.8 kilobase) DNA duplexes containing a site-specific CA mismatch and short (2.2 and 1.6 kilobases) well-matched duplexes of the same total sequence were therefore constructed. To prepare these DNA samples, pUC19 plasmid was amplified with primers incorporating a 2′ O-methyl residue to yield two short duplexes containing 14-nucleotide single-strand overhangs. Upon ligation of these two duplexes, 3.8 kbp strands contain only one CA mismatch in the middle of the strand (Figure S2). The ligation reaction was not taken to completion so as to have a mixture of well-matched short and mismatched long strands for protein distribution studies.
Although a CA mismatch effectively inhibits DNA CT (61), it is not a lesion that is preferentially bound by EndoIII. Gel shift assays on 21-mers with and without a central CA mismatch show no detectable differences in EndoIII binding (data not shown). Therefore, any differences in protein distribution can be attributed to nonspecific association.
We determined the proper biochemical conditions for protein/DNA deposition by varying the volume of reaction mixture deposited onto the mica surface (5–10 μL) and the concentration of Mg2+ cation in the adsorption buffer (5–10 mM MgCl2). To insure that proteins were not attracted to the mica surface, DNA/protein complexes were formed in solution one day prior to deposition. Some unbound proteins were observed on the mica surface although the concentration of DNA (6 μM) was much higher than that of the protein (0.4–0.6 μM) so as to reach binding saturation. Protein assignments were verified through analysis of their 3–5 nm heights in the images. In samples prepared without protein, features of this dimension were not observed, although some larger heights (> 7 nm) were noted and attributed to salt precipitates. Only clearly identifiable long or short strands and bound proteins were counted.
Atomic force microscopy of EndoIII mutants
AFM images of DNA-bound protein complexes are represented in Figure 4. As observed, protein bound to DNA (Figure 4A/B) can be easily distinguished based on strand height profiles of tapping mode images (Figure 4C). Images of DNA with/without (Figure 4D) protein were acquired with a scan size of 2 × 2 μm2 or 3 × 3 μm2 at a scan rate of 3.05 Hz. Since biomolecule surface density varied between samples, >200 long and short strands were counted in at least three independent trials. Error was calculated based on the total number of proteins counted. Previously, we found that WT EndoIII showed a significant preference for the longer strands containing a CA mismatch (28). The ratio of protein binding densities, r, for (long/short) was 1.6 with 5.6% error (total proteins counted=318). If instead we examined the distribution of EndoIII on long versus short strands, where all strands were matched, we saw a small preference for the short strands; with r (long/short)=0.9. Based on the DNA CT length and/or the length of the DNA over which proteins can diffuse, we would expect a ratio of 1 if there were an equal distribution of proteins on matched and mismatched strands.
Note that these micrographs also provide a measure of relative binding affinity of the mutants for DNA. All mutants examined in these trials showed similar total amounts of proteins bound per base pair, although variations were found in relative distributions on the long and short strands.
In order to probe the CT role of aromatic residues at the 82 position, Y82F (0.6 μM) and DNA complexes were examined with AFM. Y82F EndoIII, a mutant with CT activity comparable to that of WT (Table 1), shows a redistribution onto long mismatched strands with a binding density ratio, r (long/short) of 1.4 ± 0.09 (total proteins counted=212), similar to that of WT protein. We observed 0.15 proteins per kilobase of long strand and 0.10 proteins per kilobase of short strand upon counting 260 long mismatched strands and 346 shorter matched strands. Matched controls were found from counting 250 long matched strands and 313 shorter matched strands. We had earlier tested Y82A, which shows diminished CT efficiency (50% ± 13%) relative to WT EndoIII (28). For Y82A, r (long/short) is 0.9 ± 0.1, within error of wild type EndoIII bound to fully matched long versus short strands. These results led us to mutate other aromatic residues potentially involved in the DNA-protein CT pathway.
Y75A EndoIII mutant exhibits a signal that is 58 ± 20% smaller than that of WT EndoIII (Table1). Significantly, similar to Y82A, examination of the distribution of Y75A on mismatched and matched strands by AFM shows no preference for the mismatched strand. Upon counting 303 long strands and 497 short strands with 5% error, there is no preference for the mismatched strands; Y75A exhibits a protein binding density ratio, r (long/short) of 1.1 ± 0.05 (total proteins counted=495) in mismatched samples, which is within error of fully matched (221 long strands and 296 short strands) density ratio r (long/short) of 0.94 ± 0.06 for protein binding for fully matched strands (221 long strands and 296 short strands). Thus this mutant that is also deficient in DNA CT also does not redistribute in our AFM assay. Though the [4Fe-4S] cluster is intact and the protein maintains glycolytic activity, it cannot search for damage efficiently.
In order to probe residues near the [4Fe-4S] cluster, residues W178 and Y185 were mutated to alanines. Both mutants displayed DNA-bound electrochemical signals significantly greater than that of WT EndoIII (Table 1). When W178A/DNA complexes were studied by AFM, interestingly, they exhibit a very high protein binding density ratio r (long/short) of 1.9 ± 0.09 (total proteins counted=393). More strands were counted in W178A samples than with other proteins: 303 long mismatched strands and 395 short matched strands. 499 long matched strands and 505 short matched strands were counted for controls with <5% error. We observed 0.25 proteins per kilobase long strand and 0.14 proteins per kilobase short strand in mismatched samples. There are ~2 fold more proteins bound to the longer strands containing one single base mismatch in 3.8kb compared to the well-matched strands. Upon performing comparisons for the three individual samples from both long matched and long mismatched strand images, all measurements are within error of one another. W178A redistributes to an even greater extent than WT EndoIII. This redistribution clearly cannot be explained by binding specificity of EndoIII for the mismatch. Note that all mutant/DNA complexes display heights and strand lengths within error of WT EndoIII/DNA complexes (Figure 5A). Figure 5B shows binding density ratio comparisons for WT EndoIII and mutants: Y82A, Y75A, Y82F, and W178A. These data indicate a strong correlation between the ability of EndoIII to carry out DNA CT and its localization in the vicinity of mismatches in AFM studies.
Figure 5. EndoIII mutant binding density ratio comparisons.

(A) Representative AFM images of DNA strands incubated overnight with Y82F EndoIII. (B) Quantitation of protein density ratios (<10% uncertainty) where CA indicates a mismatch is contained in long strands. The unmarked bars show the control measurements of for fully matched long and short strands. Y82A and Y75A, both CT deficient, do not show a redistribution onto the mismatched strand. Y82F and W178A, both CT proficient, redistribute similarly to WT.
DISCUSSION
Biochemical characterization of EndoIII Mutants
Eleven mutants of EndoIII were prepared and characterized biochemically in order to identify residues important for protein/DNA CT. They were selected based on several criteria including sequence conservation, aromatic character, and possible association with cancer. Additionally, mutations were made in several different regions of the protein to ascertain CT characteristics of different domains (Figure 6). When assayed by cyclic voltammetry on DNA-modified electrodes, all of the mutants display midpoint potentials within error of that of WT EndoIII, indicating an intact [4Fe-4S] cluster, irrespective of the mutation. Thus our focus shifted to monitoring changes in signal intensity as a function of mutation, reflecting differences in coupling along the path for DNA/protein CT. The electrochemical studies coupled with AFM experiments provide a measure of CT function: the ability to redistribute repair proteins in the vicinity of a base lesion.
Figure 6. Crystal Structure of DNA-bound Endonuclease III.
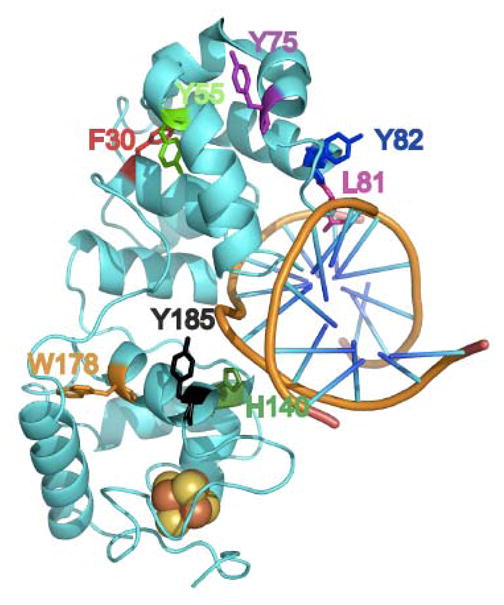
The structure shown was adapted from references (10, 14) and formatted using PyMol (75). Residues targeted for mutagenesis studies are emphasized in color.
It is therefore remarkable to see the clear correlation between electrochemical signal and the ability of the repair proteins to redistribute in the vicinity of lesions (Figure 7). First this correlation provides some confidence that electrochemical signal strength on the DNA-modified electrodes is a useful measure of protein/DNA coupling. But more importantly, this correlation provides a direct link between DNA CT activity and lesion detection, between protein/DNA coupling and function. We can therefore consider various mutants we have prepared in the context of protein/DNA CT.
Figure 7. Plot of protein binding density ratio versus electrochemical signal.

EndoIII mutants (Y82A (green), Y75A (purple), WT (red), Y82F (blue), W178A (orange)) binding density ratios obtained for the mixture of mismatched and matched strands are plotted against electrochemical signals. Mutants that are CT-deficient show low binding density ratios and do not redistribute onto the mismatched strand, while those with particularly high coupling to the DNA electrochemically (albeit with a high uncertainty in the measurement) show high binding density ratios. For Table of Contents Use Only Mutants of the Base Excision Repair Glycosylase, Endonuclease III: DNA CT as a First Step in Lesion Detection Christine A. Romano, Pamela A. Sontz, and Jacqueline K. Barton*
Variations at the protein-DNA interface
L81 and Y82 are both residues whose MUTYH equivalents exhibit mutations in cancer patients (25), and Y82 is well conserved. Additionally, L81 and Y82 are extremely close to the DNA interface in bound EndoIII. This proximity is important when the CT properties of DNA are considered. DNA is able to mediate CT by means of π-stacking, or the overlap of aromatic nucleotides whose many π-bonds provide an efficient conduit for electron flow (5, 31, 32, 62–66). L81 and Y82 may be able to intercalate into the DNA helix (9). L81 and Y82 would thus join the network of π-bonds in DNA that facilitate electron flow. Consequently, L81 and Y82 were seen as potentially important residues for mediating CT. Earlier research from our laboratory confirmed this hypothesis by establishing that Y82A is CT deficient relative to WT EndoIII (28). To follow up on these experiments, additional mutants were made at L81 and Y82 to assess, in more detail, the characteristics of CT-proficient amino acids in EndoIII. L81C is CT-proficient, so no definite conclusions can be made about the electrochemical properties of L81. The mutant Y82S is electrochemically deficient relative to WT EndoIII, whereas Y82F and Y82W are CT proficient, indicating that aromatic amino acids are important mediators of CT at the Y82 position. This CT proficiency with an aromatic residue at position 82 is reinforced by our AFM study where Y82F shows an ability to relocalize onto the mismatched strand that is comparable to WT.
It is interesting to consider mutations at these positions in the context of colorectal cancer and DNA repair. EndoIII bears structural similarity MUTYH. When MUTYH acquires certain mutations, it is no longer able to repair damage in the adenomatous polyposis coli (APC) gene, which regulates the proliferation of colonic cells (25, 67). APC is thought to be particularly susceptible to MUTYH activity because it contains 216 “GAA” codons in which a G:C → T:A transversion would result in a stop codon. Genes associated with other cancers do not contain as many such sites (25). Several MUTYH mutations have been detected in colorectal cancer patients, including those at positions Y114 and Y166 (25). These residues align with F30 and Y82 in EndoIII, respectively. Since certain mutations at Y82 are deficient in CT activity but not enzymatic activity, perhaps the MUTYH mutants are similarly deficient in CT. According to our BER search model, these mutants would be less effective at detecting DNA damage, allowing mutations to accumulate in the APC gene that could lead to colorectal cancer.
Consideration of pathways for DNA-mediated CT
Crystal structures of DNA-bound EndoIII place the [4Fe-4S] cluster and DNA roughly 14 Å apart at their closest (10, 12, 14). At this distance, CT could proceed by either a single-step tunneling process or a multi-step tunneling process, also called hopping, in which amino acids act as “stepping stones” for the electron as it travels through the protein (35, 36, 68–70). In hopping systems, many of the amino acids through which electrons hop are aromatic residues (36, 68). With this information in mind, additional mutations were made at aromatic residues closer to the interior of EndoIII to find residues that could be part of a CT pathway. Emphasis was placed on aromatic residues near Y82, as this tyrosine has already been established as CT-active. F30, Y55, and Y75 all display weaker electrochemical signals than WT EndoIII, suggesting they participate in a CT pathway. The distances covered are 9 Å from Y82 to Y75, 8 Å from Y75 to Y55, and 6 Å from Y55 to F30, which are reasonable distances to consider in the context of hopping (35). It is interesting to see the effects of mutations at Y75 both electrochemically and by AFM. Y75 is clearly biochemically active as a glycosylase. However, functionally, both in carrying out DNA/protein CT and in redistributing in the vicinity of a mismatch, Y75 is defective. These results support the idea that Y75 is part of a hopping pathway from the cluster to DNA interface. Time-resolved spectroscopy will be necessary to distinguish these pathways. Tunneling efficiency is exponential with distance (69), so even a slight reduction in tunneling distance can increase CT rates significantly.
Beyond F30, the remainder of the CT pathway was not probed for several reasons. First, many residues in the region between F30 and the [4Fe-4S] cluster are part of the helix-hairpin-helix motif of EndoIII, a well conserved motif in DNA-binding proteins (14, 71) that helps these proteins interact with their substrates. Mutations in this region could render the protein unstable and/or unable to bind DNA. Second, mutations in this region of the protein may not exhibit a detectable CT deficiency even if the targeted residues are able to facilitate CT, because multiple CT pathways could be present, as is often the case in redox-active proteins (70). In ribonucleotide reductase, for example, electrons are known to find alternative pathways between two redox centers if a primary pathway is impeded by mutagenesis or incorporation of a non-natural amino acid (36, 37). Similar phenomena could occur in EndoIII, especially given that all of the mutants examined display at least a partial signal, and that the degree of attenuation lessens as the mutations are made further from the DNA. The signal from Y82A is 50 % ± 13 % that of WT (28), whereas the signal from F30A is 88 % ± 3 % that of WT. These values suggest that protein/DNA CT may involve Y82, but that it could circumvent F30. Third, mutations very close to the [4Fe-4S] cluster could compromise the stability of this cluster, as may have been the case with the mutants W178A and Y185A.
Characterization of EndoIII mutants with large electrochemical signals
After establishing that mutations in aromatic residues are more likely to impede CT in EndoIII, the mutants W178A and Y185A were expected to produce weak cyclic voltammetry signals. However, their CT activity is unexpectedly high, larger even than that of WT EndoIII. It is more remarkable still that AFM results support this higher coupling of the protein with DNA for CT. This increase in protein/DNA coupling may be attributed to structural changes near the [4Fe-4S] cluster of the protein. The loss of the bulky, aromatic residues could increase the conformational flexibility of EndoIII, allowing water molecules to access the protein and accelerate CT to the [4Fe-4S] cluster (72, 73).
One question that could be raised by this result is why alanine is not present at positions 178 and 185 in the native protein since it permits more efficient CT than tryptophan and tyrosine at these positions. A possible answer to this question is presented by the circular dichroism data. W178A and Y185A are found to be less stable structurally than WT, and the resulting instability or flexibility could affect the nearby [4Fe-4S] cluster. Aromatic residues could play a protective role as well. Given the proximity of W178 and Y185 to the [4Fe-4S] cluster of EndoIII, it is also possible that these aromatic residues shield the cluster from solvent exposure under physiological conditions. However, these mutants still exhibit WT level enzymatic activity, indicating that the structural perturbations are probably localized.
DNA-mediated search for damage within the genome
DNA CT provides a solution to the problem of how these BER proteins can effectively scan the E. coli genome despite the low copy number and poor specificity of the repair proteins. In fact, CT through DNA with transfer over only a few hundred base pairs is sufficient to decrease the genome scanning time significantly (28). Here, AFM is utilized to probe this model of genome scanning by following the redistribution of proteins near lesions. It is interesting to note that in our AFM experiments only 1–4 proteins are bound to the long (3.8 kbp) strands, suggesting that DNA CT is occurring over distances much greater (>500 bp) than those we have measured electrochemically (4).
Moreover, here, using mutagenesis, electrochemistry and AFM, we have probed possible electronic pathways between DNA and the [4Fe-4S] cluster of the repair protein. Significantly, Y82 has already been established as a cancer-relevant aromatic residue located at the protein/DNA binding surface (28). Is Y82 the moiety that captures electrons from the DNA: the protein’s “toe in the water”? Mutation of W178, interestingly, results in both an increase in DNA CT and efficient redistribution in AFM assays. Likely here, as in other proteins, W178 serves to shield the EndoIII [4Fe-4S] cluster, protecting the cluster from solvent and reaction with water and oxygen (74). These results certainly support the idea that mutations in repair proteins that alter DNA CT influence the search for damage.
Importantly, the requirement for a rapid, comprehensive search for damage is not a process limited to BER glycosylases. DNA-binding proteins that contain [4Fe-4S] clusters with no obvious functional role have been increasingly ubiquitous (31). The results presented here elucidate a possible pathway through which charge can travel between the DNA and the iron sulfur cluster of EndoIII. Moreover these results demonstrate that the ability of the protein to perform DNA CT directly correlates with its function as a first step in damage detection. Consequently, these results add further support to the possibility that DNA-bound proteins communicate in vivo by means of DNA-mediated long-range signaling.
Supplementary Material
Acknowledgments
We are grateful to the NIH (GM49216) for their support and to NDSEG and the Rosen fund for fellowship support to C.A.R.
The authors gratefully acknowledge H.B. Gray, D.K. Newman, A.K. Boal, and J.C. Genereux for helpful discussions. T.J. Ge and A. Parisian provided technical assistance, and E.D. Olmon helped prepare figures. We are also grateful to the Beckman Institute MMRC for AFM instrumentation.
Abbreviations
- EndoIII
Endonuclease III
- CT
charge transport
- BER
base excision repair
- WT
wild type
- CD
Circular Dichroism
- AFM
atomic force microscopy
Footnotes
Supporting Information Available: Primers used for protein site-directed mutagenesis; a representative glycosylase assay gel; a schematic synthesis of the DNA with a site-specific C:A mismatch. This material is available free of charge via the Internet at http://pubs.acs.org
Contributor Information
Christine A. Romano, Email: cromano@caltech.edu.
Pamela A. Sontz, Email: psontz@caltech.edu.
Jacqueline K. Barton, Email: jkbarton@caltech.edu.
References
- 1.Ames BN, Shigenaga MK, Hagen TM. Oxidants, antioxidants, and the degenerative diseases of aging. Proc Natl Acad Sci USA. 1993;90:7915–7922. doi: 10.1073/pnas.90.17.7915. [DOI] [PMC free article] [PubMed] [Google Scholar]
- 2.David SS, O’Shea VL, Kundu S. Base-excision repair of oxidative DNA damage. Nature. 2007;447:941–950. doi: 10.1038/nature05978. [DOI] [PMC free article] [PubMed] [Google Scholar]
- 3.Demple B, Harrison L. Repair of oxidative damage to DNA: enzymology and biology. Annu Rev Biochem. 1994;63:915–948. doi: 10.1146/annurev.bi.63.070194.004411. [DOI] [PubMed] [Google Scholar]
- 4.Slinker JD, Muren NB, Renfrew SE, Barton JK. DNA charge transport over 34 nm. Nat Chem. 2011;3:230–235. doi: 10.1038/nchem.982. [DOI] [PMC free article] [PubMed] [Google Scholar]
- 5.Nunez ME, Hall DB, Barton JK. Long Range Oxidative Damage to DNA: Effects of Distance and Sequence. Chemistry and Biology. 1999;6:85–97. doi: 10.1016/S1074-5521(99)80005-2. [DOI] [PubMed] [Google Scholar]
- 6.Boon EM, Livingston AL, Chmiel NH, David SS, Barton JK. DNA-mediated charge transport for DNA repair. Proc Natl Acad Sci USA. 2003;100:12543–12547. doi: 10.1073/pnas.2035257100. [DOI] [PMC free article] [PubMed] [Google Scholar]
- 7.Porello SL, Cannon MJ, David SS. A substrate recognition role for the [4Fe-4S]2+ cluster of the DNA repair glycosylase MutY. Biochemistry. 1998;37:6465–6475. doi: 10.1021/bi972433t. [DOI] [PubMed] [Google Scholar]
- 8.Lukianova OA, David SS. A role for iron-sulfur clusters in DNA repair. Curr Opin Chem Biol. 2005;9:145–151. doi: 10.1016/j.cbpa.2005.02.006. [DOI] [PubMed] [Google Scholar]
- 9.Fromme JC, Banerjee A, Huang SJ, Verdine GL. Structural basis for removal of adenine mispaired with 8- oxoguanine by MutY adenine DNA glycosylase. Nature. 2004;427:652. doi: 10.1038/nature02306. [DOI] [PubMed] [Google Scholar]
- 10.Fromme JC, Verdine GL. Structure of a trapped endonuclease III- DNA covalent intermediate. The EMBO Journal. 2003;22:3461–3471. doi: 10.1093/emboj/cdg311. [DOI] [PMC free article] [PubMed] [Google Scholar]
- 11.Guan Y, Manuel RC, Arvai AS, Parikh SS, Mol CD, Miller JH, Lloyd RS, Tainer JA. MutY catalytic core, mutant and bound adenine structures define specificity for DNA repair enzyme superfamily. Nature Structural Biology. 1998;5:1058–1064. doi: 10.1038/4168. [DOI] [PubMed] [Google Scholar]
- 12.Kuo C-F, McRee DE, Fisher CL, O’Handley SF, Cunningham RP, Tainer JA. Atomic Structure of the DNA Repair [4Fe-4S] Enzyme Endonuclease III. Science. 1992;258:434–440. doi: 10.1126/science.1411536. [DOI] [PubMed] [Google Scholar]
- 13.Manuel RC, Hitomi K, Arvai AS, House PG, Kurtz AJ, Dodson ML, McCullough AK, Tainer JA, Lloyd RS. Reaction Intermediates in the Catalytic Mechanism of Escherichia coli MutY DNA Glycosylase. Journal of Biological Chemistry. 2004;279:46930–46939. doi: 10.1074/jbc.M403944200. [DOI] [PubMed] [Google Scholar]
- 14.Thayer MM, Ahern H, Xing D, Cunningham RP, Tainer JA. Novel DNA binding motifs in the DNA repair enzyme endonuclease III crystal structure. The EMBO Journal. 1995;14:4108–4120. doi: 10.1002/j.1460-2075.1995.tb00083.x. [DOI] [PMC free article] [PubMed] [Google Scholar]
- 15.Watanabe T, Blaisdel JO, Wallace SS, Bond JP. Engineering Functional Changes in Escherichia coli Endonuclease III Based on Phylogenetic and Structural Analyses. Journal of Biological Chemistry. 2005;280:34378–34384. doi: 10.1074/jbc.M504916200. [DOI] [PubMed] [Google Scholar]
- 16.Messick TE, Chmiel NH, Golinelli MP, Langer MR, Joshua-Tor L, David SS. Noncysteinyl Coordination to the [4Fe-4S]2+Cluster of the DNA Repair Adenine Glycosylase MutY Introduced via Site-Directed Mutagenesis. Structural Characterization of an Unusual Histidinyl-Coordinated Cluster. Biochemistry. 2002;41:3931–3942. doi: 10.1021/bi012035x. [DOI] [PubMed] [Google Scholar]
- 17.Livingston AL, Kundu S, Pozzi MH, Anderson DW, David SS. Insight into the Roles of Tyrosine 82 and Glycine 253 in Escherichia coli Adenine Glycoslyase MutY. Biochemistry. 2005;44:14179–14190. doi: 10.1021/bi050976u. [DOI] [PubMed] [Google Scholar]
- 18.Golinelli M-P, Chmiel NH, David SS. Site- Directed Mutagenesis of the Cysteine Ligands to the [4Fe- 4S] Cluster of Escherichia coli MutY. Biochemistry. 1999;38:6997–7007. doi: 10.1021/bi982300n. [DOI] [PubMed] [Google Scholar]
- 19.Chmiel NH, Golinelli M-P, Francis AW, David SS. Efficient recognition of substrates and substrate analogs by the adenine glycosylase MutY requires the C-terminal doman. Nucleic Acids Research. 2001;29:553–564. doi: 10.1093/nar/29.2.553. [DOI] [PMC free article] [PubMed] [Google Scholar]
- 20.Bai HB, Jones S, Guan X, Wilson TM, Sampson JR, Cheadle JP, Lu AL. Functional characterization of two human MutY homolog (hMYH) missense mutations (R227W and V232F) that lie within the putative hMSH6 binding domain and are associated with hMYH polyposis. Nucleic Acids Research. 2005;33:597–604. doi: 10.1093/nar/gki209. [DOI] [PMC free article] [PubMed] [Google Scholar]
- 21.Bai HB, Grist S, Gardner J, Suthers G, Wilson TM, Lu AL. Functional characterization of human MutY homolog (hMYH) missense mutation (R231L) that is linked with hMYH-associated polyposis. Cancer Lett. 2007;250:74–81. doi: 10.1016/j.canlet.2006.09.016. [DOI] [PMC free article] [PubMed] [Google Scholar]
- 22.Chepanoske CL, Lukianova OA, Lombard M, Cohen M-PG, David SS. A Residue in MutY Important for Catalysis Identified by Photocross- Linking and Mass Spectrometry. Biochemistry. 2004;43:651–662. doi: 10.1021/bi035537e. [DOI] [PubMed] [Google Scholar]
- 23.Chmiel NH, Livingston AL, David SS. Insight into the Functional Consequences of Inherited Variants of hMYH Adenine Glycosylase Associated with Colorectal Cancer: Complementation Assays with hMYH Variants and Pre-stead-state Kinetics of the Corresponding Mutated E. Coli Enzymes. J Mol Biol. 2003;327:431–443. doi: 10.1016/s0022-2836(03)00124-4. [DOI] [PubMed] [Google Scholar]
- 24.Al-Tassan N, Chmiel NH, Maynard J, Fleming N, Livingston AL, Williams GT, Hodges AK, Davies DR, David SS, Cheadle JP. Inherited variants of MYH associated with somatic G:C --> T:A mutations in colorectral tumors. Nature Genetics. 2002;30:227. doi: 10.1038/ng828. [DOI] [PubMed] [Google Scholar]
- 25.Cheadle JP, Sampson JR. MUTYH- associated polyposis- From defect in base excision repair to clinical genetic testing. DNA Repair. 2007;6:274–279. doi: 10.1016/j.dnarep.2006.11.001. [DOI] [PubMed] [Google Scholar]
- 26.Sampson JR, Jones S, Dolwani S, Cheadle JP. MutYH (MYH) and colorectal cancer. Biochem Soc T. 2005;33:679–683. doi: 10.1042/BST0330679. [DOI] [PubMed] [Google Scholar]
- 27.Kundu S, Brinkmeyer MK, Livingston AL, David SS. Adenine removal activity and bacterial complementation with the human MutY homologue (MUTYH) and Y165C, G382D, P391L and Q324R variants associated with colorectal cancer. DNA Repair (Amst) 2009;8:1400–1410. doi: 10.1016/j.dnarep.2009.09.009. [DOI] [PMC free article] [PubMed] [Google Scholar]
- 28.Boal AK, Genereux J, Sontz P, Gralnick JA, Newman DK, Barton JK. Redox signaling between DNA Repair Proteins for efficient lesion detection. Proc Natl Acad Sci USA. 2009;106:15237–15242. doi: 10.1073/pnas.0908059106. [DOI] [PMC free article] [PubMed] [Google Scholar]
- 29.Boal AK. Thesis in Chemistry. California Institute of Technology; Pasadena, CA: 2008. DNA-mediated Charge Transport in DNA Repair. [Google Scholar]
- 30.Boal AK, Yavin E, Lukianova OA, O’Shea VL, David SS, Barton JK. DNA- Bound Redox Activity of DNA Repair Glycosylases Containing [4Fe- 4S] Clusters. Biochemistry. 2005;44:8397–8407. doi: 10.1021/bi047494n. [DOI] [PubMed] [Google Scholar]
- 31.Genereux JC, Boal AK, Barton JK. DNA-Mediated Charge Transport in Redox Sensing and Signaling. J Am Chem Soc. 2010;132:891–905. doi: 10.1021/ja907669c. [DOI] [PMC free article] [PubMed] [Google Scholar]
- 32.Genereux JC, Barton JK. Mechanisms for DNA Charge Transport. Chemical Reviews. 2010;110:1642–1662. doi: 10.1021/cr900228f. [DOI] [PMC free article] [PubMed] [Google Scholar]
- 33.Merino EJ, Boal AK, Barton JK. Biological contexts for DNA charge transport chemistry. Current Opinion in Chemical Biology. 2008;12:229–237. doi: 10.1016/j.cbpa.2008.01.046. [DOI] [PMC free article] [PubMed] [Google Scholar]
- 34.Giese B, Wang M, Gao J, Stoltz M, Muller P, Graber M. Electron Relay Race in Peptides. J Org Chem. 2009;74:3621–3625. doi: 10.1021/jo900375f. [DOI] [PubMed] [Google Scholar]
- 35.Shih C, Museth AK, Abrahamsson M, Blanco-Rodriguez AM, Di Bilio AJ, Sudhamsu J, Crane BR, Ronayne KL, Towrie M, Vlcek A, Richards JH, Winkler JR, Gray HB. Tryptophan-accelerated electron flow through proteins. Science. 2008;320:1760–1762. doi: 10.1126/science.1158241. [DOI] [PubMed] [Google Scholar]
- 36.Stubbe J, Nocera DG, Yee CS, Chang MCY. Radical Initiation in the Class I Ribonucleotide Reductase: Long- Range Proton- Coupled Electron Transfer? Chemical Reviews. 2003;103:2167– 2202. doi: 10.1021/cr020421u. [DOI] [PubMed] [Google Scholar]
- 37.Chang MC, Yee CS, Nocera DG, Stubbe J. Site-specific replacement of a conserved tyrosine in ribonucleotide reductase with an aniline amino acid: a mechanistic probe for a redox-active tyrosine. J Am Chem Soc. 2004;126:16702–16703. doi: 10.1021/ja044124d. [DOI] [PubMed] [Google Scholar]
- 38.Giese B, Graber M, Cordes M. Electron transfer in peptides and proteins. Curr Opin Chem Biol. 2008;12:755–759. doi: 10.1016/j.cbpa.2008.08.026. [DOI] [PubMed] [Google Scholar]
- 39.Cordes M, Kottgen A, Jasper C, Jacques O, Boudebous H, Giese B. Influence of amino acid side chains on long-distance electron transfer in peptides: Electron hopping via “Stepping Stones”. Angew Chem Int Edit. 2008;47:3461–3463. doi: 10.1002/anie.200705588. [DOI] [PubMed] [Google Scholar]
- 40.Sun HB, Yokota H. MutS-Mediated Detection of DNA Mismatches Using Atomic Force Microscopy. Anal Chem. 2000;72:3138–3141. doi: 10.1021/ac991263i. [DOI] [PubMed] [Google Scholar]
- 41.Sorel I, Piétrement O, Hamon L, Baconnais S, Le Cam E, Pastré D. The EcoRI-DNA Complex as a Model for Investigating Protein-DNA Interactions by Atomic Force Microscopy. Biochemistry. 2006;45:14675–14682. doi: 10.1021/bi060293u. [DOI] [PubMed] [Google Scholar]
- 42.Pastré D, Hamon L, Sorel I, Le Cam E, Curmi PA, Piétrement O. Specific DNA-Protein Interactions on Mica Investigated by Atomic Force Microscopy. Langmuir. 2010;26:2618–2623. doi: 10.1021/la902727b. [DOI] [PubMed] [Google Scholar]
- 43.Hansma HG. Surface Biology of DNA by Atomic Force Microscopy. Annu Rev Phys Chem. 2001;52:71–92. doi: 10.1146/annurev.physchem.52.1.71. [DOI] [PubMed] [Google Scholar]
- 44.Allen S, Rigby-Singleton SM, Harris H, Davies MC, O’Shea P. Measuring and visualizing single molecular interactions in biology. Biochem Soc Trans. 2003;31:1052–1057. doi: 10.1042/bst0311052. [DOI] [PubMed] [Google Scholar]
- 45.Buzzeo MC, Barton JK. Redmond Red as a Redox Probe for the DNA-Mediated Detection of Abasic Sites. Bioconjugate Chem. 2008;19:2110–2112. doi: 10.1021/bc800339y. [DOI] [PMC free article] [PubMed] [Google Scholar]
- 46.Kelley SO, Boon EM, Barton JK, Jackson NM, Hill MG. Single-base mismatch detection based on charge transduction through DNA. Nucleic Acids Research. 1999;27:4830–4837. doi: 10.1093/nar/27.24.4830. [DOI] [PMC free article] [PubMed] [Google Scholar]
- 47.Kelley SO, Jackson NM, Hill MG, Barton JK. Long-Range Electron Transfer through DNA Films. Angew Chem Int Ed. 1999;38:941–945. doi: 10.1002/(SICI)1521-3773(19990401)38:7<941::AID-ANIE941>3.0.CO;2-7. [DOI] [PubMed] [Google Scholar]
- 48.Boon EM, Salas JE, Barton JK. An electrical probe of protein-DNA interactions on DNA-modified surfaces. Nature Biotech. 2002;20:282–286. doi: 10.1038/nbt0302-282. [DOI] [PubMed] [Google Scholar]
- 49.Cunningham RP, Asahara H, Bank JF, Scholes CP, Salerno JC, Surerus K, Münck E, McCracken J, Peisach J, Emptage MH. Endonuclease III Is an Iron- Sulfur Protein. Biochemistry. 1989;28:4450–4455. doi: 10.1021/bi00436a049. [DOI] [PubMed] [Google Scholar]
- 50.Kovach ME, Elzer PH, Hill DS, Robertson GT, Farris MA, II, RMR, Peterson KM. Four new derivatives of the broad- host- range cloning vector pBBR1MCS carrying different antibiotic- resistance cassettes. Gene. 1995;166:175–176. doi: 10.1016/0378-1119(95)00584-1. [DOI] [PubMed] [Google Scholar]
- 51.Sambrook J, Russell DW. Molecular cloning: A Laboratory Manual. Cold Spring Harbor Laboratory Press; Cold Spring Harbor: 2001. [Google Scholar]
- 52.Davis RW, Botstein D, Roth JR. Advanced Bacterial Genetics: A Manual for Genetic Engineering. Cold Spring Harbor: Cold Spring Harbor Laboratory Press; 1980. [Google Scholar]
- 53.Donahue WF, Turczyk BM, Jarrell KA. Rapid gene cloning using terminator primers and modular vectors. Nucleic Acids Res. 2002;30:e95. doi: 10.1093/nar/gnf094. [DOI] [PMC free article] [PubMed] [Google Scholar]
- 54.Horcas I, et al. WSXM: a software for scanning probe microscopy and a tool for nanotechnology. Rev Sci Instrum. 78:013705. doi: 10.1063/1.2432410. [DOI] [PubMed] [Google Scholar]
- 55.Bard AJ, Faulkner LR. Electrochemical Methods: Fundamentals and Applications. John Wiley & Sons, Inc; Hoboken, NJ: 2001. [Google Scholar]
- 56.Wang M, Gao J, Muller P, Giese B. Electron Transfer in Peptides with Cysteine and Methionine as Relay Amino Acids. Angew Chem Int Edit. 2009;48:4232–4234. doi: 10.1002/anie.200900827. [DOI] [PubMed] [Google Scholar]
- 57.Bhattacharjee S, Deterding LJ, Jiang J, Bonini MG, Tomer KB, Ramirez DC, Mason RP. Electron transfer between a tyrosyl radical and a cysteine residue in hemoproteins: Spin trapping analysis. J Am Chem Soc. 2007;129:13493–13501. doi: 10.1021/ja073349w. [DOI] [PubMed] [Google Scholar]
- 58.Camba R, Armstrong FA. Investigations of the oxidative disassembly of Fe-S clusters in Clostridium pasteurianum 8Fe ferredoxin using pulsed-protein-film voltammetry. Biochemistry. 2000;39:10587–10598. doi: 10.1021/bi000832+. [DOI] [PubMed] [Google Scholar]
- 59.Beinert H. Iron-sulfur proteins: ancient structures, still full of surprises (vol 5, pg 2, 2000) J Biol Inorg Chem. 2000;5:409–409. doi: 10.1007/s007750050002. [DOI] [PubMed] [Google Scholar]
- 60.Beinert H. Iron- Sulfur Clusters: Nature’s Modular, Multipurpose Structures. Science. 1997;277:653–658. doi: 10.1126/science.277.5326.653. [DOI] [PubMed] [Google Scholar]
- 61.Boon EM, Ceres DM, Drummond TG, Hill MG, Barton JK. Mutation detection by electrocatalysis at DNA-modified electrodes. Nature Biotechnology. 2000;18:1096–1100. doi: 10.1038/80301. [DOI] [PubMed] [Google Scholar]
- 62.Giese B. Long-distance electron transfer through DNA. Annu Rev Biochem. 2002;71:51–70. doi: 10.1146/annurev.biochem.71.083101.134037. [DOI] [PubMed] [Google Scholar]
- 63.Kelley SO, Barton JK. Electron Transfer Between Bases in Double Helical DNA. Science. 1999;283:375–381. doi: 10.1126/science.283.5400.375. [DOI] [PubMed] [Google Scholar]
- 64.Kelley SO, Holmlin RE, Stemp EDA, Barton JK. Photoinduced Electron Transfer in Ethidium- Modified DNA Duplexes: Dependence on Distance and Base Stacking. J Am Chem Soci. 1997;119:9861–9870. [Google Scholar]
- 65.Holmlin RE, Dandliker PJ, Barton JK. Charge transfer through the DNA base stack. Angew Chem Int Edit. 1997;36:2715–2730. [Google Scholar]
- 66.Giese B. Electron transfer in DNA. Current Opinion in Chemical Biology. 2002;6:612–618. doi: 10.1016/s1367-5931(02)00364-2. [DOI] [PubMed] [Google Scholar]
- 67.Fearnhead NS, Britton MP, Bodmer WF. The ABC of APC. Hum Mol Genet. 2001;10:721–733. doi: 10.1093/hmg/10.7.721. [DOI] [PubMed] [Google Scholar]
- 68.Gray HB, Winkler JR. Long-range electron transfer. P Natl Acad Sci USA. 2005;102:3534–3539. doi: 10.1073/pnas.0408029102. [DOI] [PMC free article] [PubMed] [Google Scholar]
- 69.Gray HB, Winkler JR. Electron tunneling through proteins. Q Rev Biophys. 2003;36:341–372. doi: 10.1017/s0033583503003913. [DOI] [PubMed] [Google Scholar]
- 70.Onuchic JN, Beratan DN, Winkler JR, Gray HB. Pathway Analysis of Protein Electron-Transfer Reactions. Annu Rev Bioph Biom. 1992;21:349–377. doi: 10.1146/annurev.bb.21.060192.002025. [DOI] [PubMed] [Google Scholar]
- 71.Doherty AJ, Serpell LC, Ponting CP. The helix-hairpin-helix DNA-binding motif: A structural basis for non-sequence-specific recognition of DNA. Nucleic Acids Research. 1996;24:2488–2497. doi: 10.1093/nar/24.13.2488. [DOI] [PMC free article] [PubMed] [Google Scholar]
- 72.Berghuis AM, Guillemette JG, Smith M, Brayer GD. Mutation of Tyrosine-67 to Phenylalanine in Cytochrome-C Significantly Alters the Local Heme Environment. J Mol Biol. 1994;235:1326–1341. doi: 10.1006/jmbi.1994.1086. [DOI] [PubMed] [Google Scholar]
- 73.Casimiro DR, Richards JH, Winkler JR, Gray HB. Electron-Transfer in Ruthenium-Modified Cytochromes-C - Sigma-Tunneling Pathways through Aromatic Residues. J Phys Chem-Us. 1993;97:13073–13077. [Google Scholar]
- 74.Bertini I, Gray HB, Stiefel EI, Valentine JS, editors. Biological Inorganic Chemistry Structure and Reactivity. University Science Books-California; 2007. [Google Scholar]
- 75.The PyMOL Molecular Graphics System, Version 1.2r3pre. Schrödinger, LLC; [Google Scholar]
Associated Data
This section collects any data citations, data availability statements, or supplementary materials included in this article.