

Abstract
We describe the mechanical behavior of isotropic fibrin networks at the macroscopic scale in terms of the nanoscale force response of fibrin molecules that are its basic building blocks. We show that the remarkable extensibility and compressibility of fibrin networks have their origins in the unfolding of fibrin molecules. The force-stretch behavior of a single fibrin fiber is described using a two-state model in which the fiber has a linear force-stretch relation in the folded phase and behaves like a worm-like-chain in the unfolded phase. The nanoscale force-stretch response is connected to the macro-scale stress-stretch response by means of the eight-chain model. This model is able to capture the macroscopic response of a fibrin network in uniaxial tension and appears remarkably simple given the molecular complexity. We use the eight-chain model to explain why fibrin networks have negative compressibility and Poisson’s ratio greater than one due to unfolding of fibrin molecules.
Keywords: blood clots, Poisson’s ratio, constitutive model, viscoelasticity, nanomechanics, hemostasis and thrombosis
1 Introduction
Blood clots and thrombi are built of porous networks of branching fibrin fibers made from the large precursor protein fibrinogen. In vivo, the mechanical properties of protective (hemostatic) fibrin clots are critical for prevention of bleeding and for wound healing, and the properties of obstructive clots, called thrombi, determine the course of pathological conditions, such as coronary heart disease, and the response to treatments. For the maintenance of health, the structure and mechanical properties of fibrin must be optimized in such a way that they are able to prevent bleeding and yet be porous enough in order to be digestable by enzymes. Thrombi that are not dissolved in a timely manner can cease blood flow and cause strokes and heart attacks [1]. Indeed, the mechanical properties of clots, which determine their response to stress induced by blood flow, are directly related to the risk of thromobosis. In spite of this vital importance, the origins of clot viscoelasticity and relation to clot structure remain poorly understood.
In this paper we use a recently developed constitutive model [2] to show that force-induced (or mechanical) protein unfolding results in high extensibility, unusually high Poisson’s ratios and negative compressibilities in purified fibrin networks. We also predict the dependence of the mechanical behavior of the network on structural properties of fibrin at the nanoscale, such as the length of the folded polypeptide chains that make up a fibrin monomer. Our constitutive model is an enriched version of the eight-chain model of Arruda and Boyce [3, 4] modified to account for large volume changes due to unfolding of proteins. The model of Arruda and Boyce connects the microscopic mechanics of the fibers making up a network to the macroscopic behavior of the network by constructing a cube, each of whose eight vertices is connected to the body center through a fiber (see figure 1(a)). The strain energy density of the cube can be explicitly written in terms of the energy stored in the eight deformed fibers, allowing us to connect the macroscopic network parameters to the microscopic behavior of the fibers. Even though this model is not based on the actual microscopic structure of the network, it has been shown to accurately describe random networks, such as those of actin filaments [5], mussel byssus threads [6] and many rubbers [3, 7]. Experiments on these materials have also been interpreted by the more physically realistic full network model like those of Storm et al. [8] and others. We will not discuss the full network model here and instead refer the reader to our recent paper [2] where we have given a detailed account of the application of this model to fibrin networks.
Figure 1.
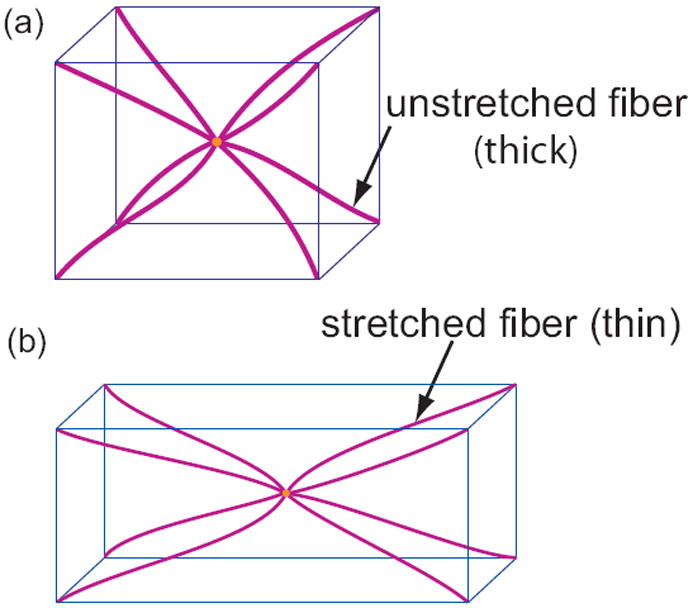
Models for isotropic networks. (a) In the eight-chain model eight chains (or fibers) connect the vertices of cube to the body center. The strain energy density of the cube is computed by summing the energy stored in the deformation of each of the fibers. This model is an improvement over the three-chain model and has been successfully applied to many isotropic networks. (b) An eight-chain cube in a deformed state in which there is stretching in the longitudinal direction and contraction along the other two orthogonal directions. Note that the fiber diameters in the deformed configuration are smaller than those in the undeformed configuration.
Excellent accounts of the long history of the network models described above can be found in Wu and van der Giessen [9], Beatty [10] and Miehe et al. [11]. Here we give a short summary to place our work in context and to point out how we will build upon the research already done over the last few decades. Studies of constitutive models for polymers began in the 1940s, when it was recognized that the elasticity of rubber has its origins in the changing configurational entropy of stretched chains. In particular, it was found that the response of an isotropic network of n randomly oriented chains per unit volume is identical to that of n/3 single chains in three orthogonal directions [12]. Four-chain models, similar to their three- and eight-chain cousins, were proposed by Wang and Guth [13], Flory and Rehner [14] and Treloar [15]. The three- and four-chain models were in widespread use until the early 1990s, when Arruda and Boyce found that these models were unable to capture the deformation dependence of strain-hardening in some polymers. Arruda and Boyce [3] then proposed the eight-chain model which gave much better agreement with experiments and has since been used to interpret experiments on biopolymer networks. The full network model of Storm et al. has also been used to interpret experiments on biopolymer networks. This model depends on a knowledge of the spatial distribution of chain orientations as in Wu and van der Giessen [9] and numerous earlier works including those of Treloar[16] and Treloar and Riding [17]. A detailed study comparing these models has determined that approximations based on the three- and eight-chain models agree very well with the predictions of the full network model over the entire range of strains [9]. In fact, some approximations of the full network model of Wu and van der Geissen lead to a constitutive equation of the same form as the equivalent eight-chain model even though they assume no specific cell morphology [10]. Furthermore, the constitutive equations of the eight-chain model are also obtained as a result of minimizing the macroscopic free energy of a non-affine network model of unconstrained chains as shown by Miehe et al.[11]. For these reasons, we derive most of our results using a modified version of the eight-chain model that can account for large volume changes. In particular, we obtain a macroscopic stored energy function W(I1, I3) that depends on the first and third invariants of the right Cauchy-Green strain tensor. This assumes that fibrin networks are isotropic in their stress-free state. We obtained experimental evidence for isotropy through scanning electron microscopy studies of fibrin networks (see section 3.1). We show experimentally that the probability of finding a fiber oriented in any given direction is uniform for physically unperturbed in vitro networks. Stored energy functions of this general form have been derived earlier [7, 18], but those models result in constitutive behaviors where the compressibility is always positive. The stored energy function derived in this paper represents an unusual constitutive response characterized by negative compressibility and Poisson’s ratios greater than 1.
2 Eight-chain model
In the eight-chain model of Arruda and Boyce [3, 4], each chain or fiber extends from the center of the cube to one of its vertices (see figure 1(a)). The reference (undeformed) length of each fiber is L and the side of the undeformed cube is a, so that . Due to applied stresses, this cube becomes a cuboid in the principal coordinates of the deformed configuration (see figure 1(b)) along which the principal stretches are λ1, λ2 and λ3. Hence, the length of each fiber after deformation is λcL where
| (1) |
Let the strain-energy stored in each fiber due to the deformation be G(λc)L, where G(λc) is the strain energy per unit reference length of the fiber. The strain energy per unit reference volume of the cube is then given by
| (2) |
where ν is the number of fibers per unit reference volume and g(λ1λ2λ3) is the stored energy density due to volume changes. Now, let be the deformation gradient tensor, where y is the deformed position of a particle whose reference position is x. Then the right Cauchy-Green strain tensor is defined as C = FT F. The Cauchy stress σ is given by . Hence, the components of the Cauchy stress are:
| (3) |
where is the force-stretch relation of a single fiber, f (p) = g′(p) and the shear stresses are zero because we are working in principal coordinates. The first Piola-Kirchhoff stress P = det (F)σF−T. For a uniaxial tension test on a cylindrical specimen where the force fap is applied along the e1 direction, we set σ22 = σ33 = 0 and λ2 = λ3 = λ* in the expressions above. This immediately shows that
| (4) |
and,
| (5) |
If the radius of the cylinder in the reference configuration is R0, then its deformed radius is λ*R0 and the applied force is given by
| (6) |
where . In an experiment, λ1 and λ* can both be measured as a function of the applied force fap. The initial radius R0 of the specimen, the initial number of fibers per unit volume ν, and the average length of the fiber L between branch points is known. Hence, we can determine the force-stretch (or stress-stretch) relation of a network specimen if F(λc), the force-stretch relation of a fiber, is given. For a fiber, we will use a force-stretch relation based on a two-state model that is suitable when the constituent proteins of the fiber unfold at large forces. Such models have been used in conjunction with the eight-chain model to understand the response of mussel byssus threads [6] and other biological materials with folded domains [4]. In contrast to the work presented in this paper, these studies were computational and did not have a large volume change associated with network extension.
Given the large volume changes observed with fibrin networks, we can also calculate the compressibility and Poisson’s ratio function for the network. The compressibility is defined as
| (7) |
where V is the current volume of the network and P is the pressure. For uniaxial tension experiments, where σ11 is the Cauchy stress calculated above. Recognizing that , we see that . Lastly, the Poisson ratio function is defined as in Beatty and Stalnaker [19]
| (8) |
We now turn to the force-stretch relations for fibrin fibers that can unfold under large forces. Under the assumption of equilibrium (see the section on ‘Experimental foundations of the model’ where we give evidence for this assumption) at each step of the tensile loading process, we write
| (9) |
where nf and nu are the fractions of folded and unfolded proteins, E is the Young’s modulus of single fibrin fiber in the folded phase, A is the cross-sectional area of a fiber in the folded phase, is the ratio of fully unfolded to fully folded contour lengths of a fibrin monomer, ξp is the persistence length of the fully unfolded polypeptide chain making up a fibrin monomer, N is the number of protofibrils in the cross-section of a fibrin fiber, kB is the Boltzmann constant and T is the absolute temperature. We have assumed here that a worm-like chain model describes the force-stretch behavior of a protofibril in the unfolded phase as was recently demonstrated by Houser et al. [20] in atomic force microscopy experiments on single fibrin fibers. The worm-like chain model fits the mechanical data quite well even though the unfolded chains are likely bundled together. We have also assumed that a single unfolded protofibril carries a force . Concrete evidence for this comes from atomic force microscopy forced unfolding studies of 1,2,3 and more protein chains in parallel – as arranged in fibrin fibers – that obey these types of relations, with unfolding forces that are simply proportional to the number of chains [21]. The fractions nf and nu of folded and unfolded protein are given by
| (10) |
where Δ∏ is the difference in free energy between wells corresponding to the fully unfolded and the fully folded states and Δz is the distance between these wells along a direction aligned with the force. These two parameters are difficult to measure and would depend on the structure of fibrin at the nanoscale, which varies depending on the animal species of fibrin. The quantity is also such a parameter. We will discuss these parameters at greater length in the ‘Results and discussion’ section. The large volume changes in stretched fibrin networks were shown to follow the following equation [2]:
| (11) |
where C3 is the ratio of network (fiber + solvent) volumes in the fully folded and fully unfolded configurations. We can combine this equation with to get the following cubic equation for λ1:
| (12) |
Note that nf and nu can be written in terms of λc through F. C3 can be inferred from the experimental data and hence the above is an equation for λ1, which can be solved by Cardan’s method. λ* can then be determined from (11). Cardan’s solution to α3+qα+r = 0 are the three numbers
| (13) |
For determining λ1, we substitute and r = 2(nf+C3nu).
It is useful to have expressions for the stored energy density per unit reference volume of the network. It is easy to write down the respective expressions in the fully folded and fully unfolded states of the network. Noting that and , we have
| (14) |
We recall here that I1 is a measure of the deformation of a line element (or fiber) in the network, while I3 is a measure of the deformation of a volume element in the network. Theories of rubber elasticity typically give a logarithmic dependence of W on I3 that results in large positive bulk-moduli [7, 18]. But, here I3 is intimately connected with the fraction of proteins unfolded. And, stress induced protein unfolding is a structural change that we interpret as a phase transition that ultimately gives rise to negative compressibility. This is very different from the constitutive behaviors described earlier. In fact, it is easy to see that (11) can be rearranged to get the fraction of folded (or unfolded) proteins as
| (15) |
Now we use the rule of mixtures and say that for 0 < nf < 1, W1(I1, I3) = nfWf + nuWu, where Wf = W1(I1, I3)∣nf=1 and Wu = W1(I1, I3)∣nf=0 as written above. But, this does not account for the energetic termW2 (or g) in (2) corresponding to large volumetric deformations. However, this term is difficult to determine analytically and we only give an outline of the calculation here. To begin we note that (10) can be rearranged to give
| (16) |
which when combined with (15) shows that F(λc) can be written entirely in terms of I3. Thus λc can be written entirely in terms I3 through (9) and λ1 can be written entirely in terms of I3 through (13). Hence, can now be obtained in terms of I3 using (4). This gives us a first order ordinary differential equation that can be integrated to yield W2.
3 Experimental foundations of the model
3.1 Detecting fibrin network isotropy
Isotropy of fibrin networks is one of the two major assumptions underlying the proposed constitutive model of fibrin mechanics. To test the hypothesis of uniformity of the fibrin network in all directions, we analyzed scanning electron microscopy (SEM) images of unstretched fibrin clots, which allowed us to visualize and quantify the arrangment of fibrin fibers. Fibrin samples were prepared from purified human fibrinogen (1 mg/ml) by mixing with human factor XIII (20 μg/ml), and human thrombin (0.5 U/ml) in the presence of calcium ions (10 mM CaCl2). The clots were allowed to form at room temperature for two hours. Scanning electron microscopy experiments were carried out on the mechanically unperturbed clots after preparation of samples with the procedure that we found best preserves structure, which includes fixation, dehydration, critical point drying and sputter-coating with gold-palladium as described previously [22]. Specimens were examined in a Phillips/FEI XL20 scanning electron microscope. Images were representative of 10 locations randomly visualized on a clot. To measure fiber orientation using Adobe Photoshop CS2, a line was drawn tracing each fiber, the angle from an arbitrary axis (0° −360°) was measured, and the frequency of fibers at each 30° interval was plotted on polar coordinates (see figure 2). The radar histogram presented in figure 2B clearly shows that in the unstretched clot the frequency of fibers oriented at any one angle was about the same as that of any other angle, which is characteristic of structural uniformity and, hence, isotropy.
Figure 2.
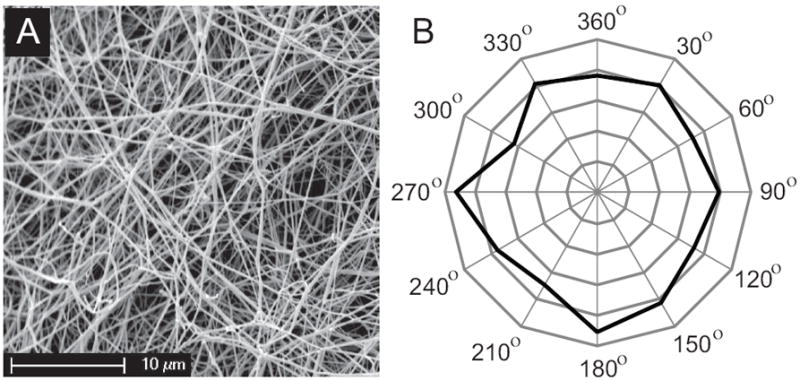
Isotropy of network formed by fibrin fibers. A. Representative scanning electron micrograph of the unstretched fibrin network. Magnification bar = 10μm. B. Quantitative analysis of fiber orientation using scanning electron microscopy images presented as a radar histogram. The angles (0° − 360°) formed by fibrin fibers with an arbitrary axis were measured (n=1085). The frequency (%) of fibers at each 30° interval displayed a roughly symmetrical distribution.
3.2 Detecting protein unfolding in stretched clots
Force induced molecular unfolding of fibrin is another major assumption of the proposed model which needs to be verified. There is a number of methodological approaches capable of detecting a shift from α to β structures during fibrin stretching and unfolding. Indeed, early wide angle x-ray scattering (WAXS) measurements of fibrin clots give evidence of a transition from α to β structures [23]. While WAXS remains the “gold standard” for this kind of studies and is planned to be employed in the future, there are other techniques, such as stain polarimetry, circular dichroism or Fourier Transform infrared spectroscopy (FTIR) that are widely used to study formation of β-sheets in proteins.
We used Congo red staining to detect the formation of β structures in stretched fibrin networks. Congo red is an aromatic dye that is sensitive to the β-strands of the stacked β-sheets that come from different protein structures and align perpendicular to the axis of the fibril [24]. Congophilic β-sheet structures cause multi-color birefringence when viewed in a polarized microscope. Congo red staining was successfully used to reveal α-to-β transition induced by force in keratin-like intermediate filaments [25].
Unstretched and stretched 2mm-cylindrical fibrin clots were made from purified human fibrinogen as described in the section 3.3 and stained with Congo red using the alkaline method [26]. Briefly, clots were first incubated in the alkaline alcohol to reduce non-specific staining and then in freshly filtered Congo red solution. After washing in distilled water the stained clots were mounted on a glass slide and analyzed in a polarized microscope Olympus BH-2 equipped with a photo registration system. The unstretched clots displayed a uniform red color all over the clot (figure 3, top image). The clots that were stretched 3-fold had qualitatively different color regions in polarized light. The peripheral parts of a clot adjacent to the clamps, where stretching is the highest and the fibers diverge from the axis of stretching, displayed a complex color pattern with prevalence of pink and purple (figure 3, bottom image). This phenomenon is called metachromasia and reflects the interaction of Congo red with newly formed structures that appear in stretched fibrin, presumably the β-sheets.
Figure 3.
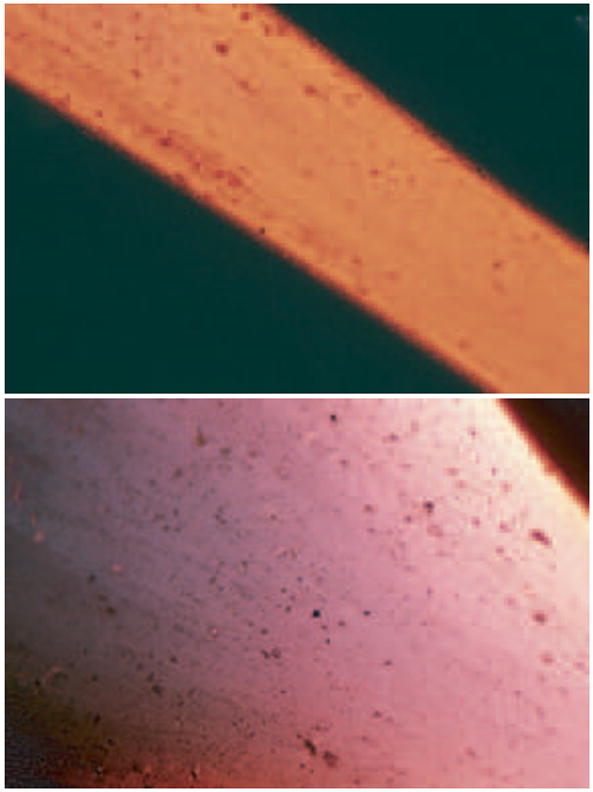
Polarized microscopy of unstretched (upper image) and 3-fold stretched (lower image) fibrin clots stained with Congo red. The change in color reveals protein unfolding followed by formation of β-structures.
3.3 Tensile testing
The model described in this paper was compared with experimental measurements of the static mechanical properties of whole fibrin clots using tensile testing (see figure 4).
Figure 4.
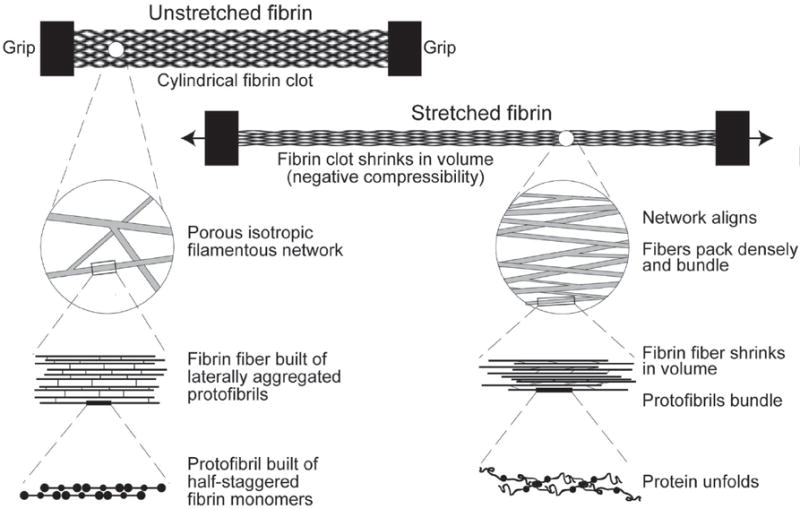
Cylindrical fibrin clot 2mm or 4mm in diameter and a few centimeters long is held in grips and extended in uniaxial tension. The initial network is randomly oriented, highly porous and is filled with water in the voids. Each fibrin fiber is about 200nm in diameter and consists of multiple laterally aggregated protofibrils, consisting of fibrin monomers that are arranged in a regular double-stranded lattice with a spacing of about 22.5nm. The diagram shows the structural changes that occur upon stretching the fibrin clot at different scales, including macroscopic volume shrinkage, network rearrangement, and protein unfolding [2].
Fibrin samples were prepared from 10mg/ml purified human fibrinogen in 50mM Tris-HCl buffer, pH 7.4 containing 150mM NaCl, 10mM CaCl2 by mixing with 10μg/ml of a precursor of blood plasma transglutaminase, factor XIII, and 0.5U/ml (final concentration) human thrombin. Cylindrical clots were prepared in a 4×60 mm or a 2×50 mm plastic tube whose barrel was lubricated with a thin layer of a non-ionic detergent to facilitate removal of the clots from the tubes. The clots were allowed to form for 3-5 hours at room temperature and then kept overnight at 4°C to ensure the enzymatic cross-linking. Then, these clots were removed from the tube and used for experiments. Covalent factor XIIIa-mediated cross-linking of the clots was confirmed by γ-γ-chain band and α-chain polymers revealed in SDS-PAGE of reduced samples (not shown). Extensive covalent cross-linking is key to giving mechanically stable and resilient fibrin gels. Tensile testing was performed with the clots gently clamped between rubber pads in the grips of a strain-controlled Instron tensile tester equipped with a 2.5 N load cell. Samples were stretched at 10 mm per minute while monitoring the load. To determine the strain in the center of the sample independent of any effects of clamping, graphite powder was used to make fiducial marks on the clots, then imaged using a digital camera. NIH ImageJ software was used to track the size and location of the fiducial marks in the center of the sample over the course of the stretching experiments and these marks were used to calculate the longitudinal stretch λ1 and the transverse stretch λ*. The data were used to create the experimental plots presented in various figures and to extract parameters used in the calculations.
We also ensured that the rate of straining was slow enough that the force-stretch curves obtained from the tensile test agreed with the static (or relaxed) force-stretch response of the network with no rate dependence. To do so, we applied strains on the network in small increments and allowed the force to relax to its equilibrium value for each strain increment, as shown in figure 5(b). The relaxed value of the force agreed with those obtained from the slow (10 mm per minute) straining experiments for all strains as can be seen in figure 5(a). The static force-stretch response of the network was also found to be reversible with some hysteresis. In order to establish reversibility we unloaded the specimen in the slow straining experiments and stretched it again. The resulting force-stretch curve for the second stretch was close to the original as seen in figure 5(b). The hysteresis could have originated from inelastic deformation in the fibers/network during stretching. These experiments suggest that we are measuring the elastic part of the constitutive behavior of fibrin clots in our slow straining experiments even though the overall material behavior is more complex.
Figure 5.
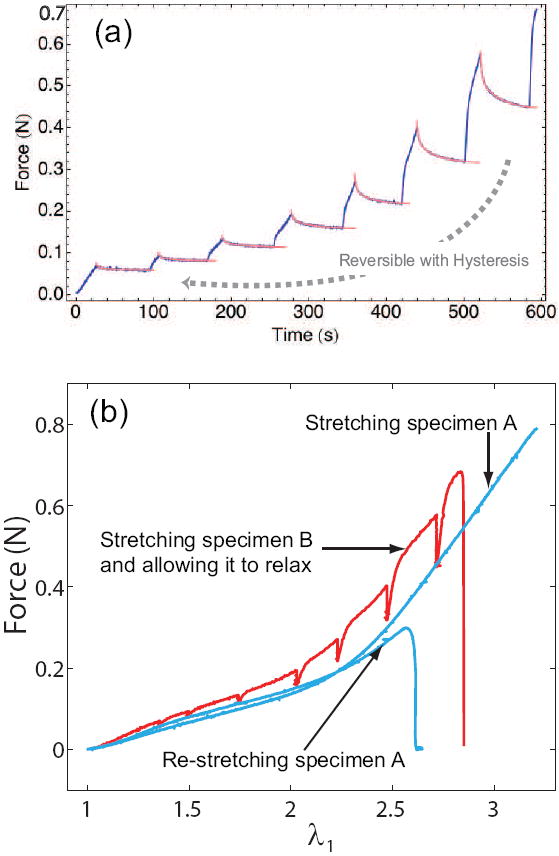
Force-relaxation curves for successive strain increments on a fibrin clot. (a) Relaxation trajectories for the force are shown for each strain increment. The blue curves are experimental data. The red curves are fits with double exponentials. The relaxed values of the force obtained from the double exponential fits agree with those for the corresponding strain in the constant strain rate (10 mm per minute) experiments. The force-stretch response of the network is reversible with some hysteresis. (b) The blue curve represents specimen A which is stretched at 10 mm per minute, then relaxed, and stretched again at 10 mm per minute. Notice that the two force-stretch curves are close to each other, suggesting that the stretching process is reversible. The red curve is obtained by successively straining specimen B in increments, followed by relaxation after each increment. The relaxed value of the force is close to that obtained by stretching specimen A at 10 mm per minute.
4 Results and discussion
In order to get insights into the structural basis for fibrin mechanics, we compared quantitative experimental data from forced elongation of fibrin clots with theoretically predicted stress-stetch values obtained from our eight-chain model. The input parameters in our calculations were extracted from a number of independent sources, such as scanning electron microscopy of fibrin networks [2], forced unfolding of individual fibrinogen molecules using atomic force microscopy [27], nanomechanical manipulations of individual fibrin fibers by optically trapped latex particles [28] as well as biochemical experiments with different concentrations of fibrinogen and various thrombin activities to change fibrin diameter and density [29]. We take fiber diameter to be 185nm, L = 20 μm which is the average distance between branch points, E = 14.5MPa, , and ξp = 0.8nm. The fiber density ν is assumed to be 5 × 10⁻¹ μm−3 and the initial radius, R0, of the specimens is about 1mm, so that (see eqn.(6)). Experimental deformation of fibrin clots was accompanied by dramatic volume shrinkage. Thus, the volume of the fully unfolded network is about 10% of the volume in the reference configuration, so that C3 ≈ 0.1. We estimated N ≈ 1200 based on the diameter and packing of the protofibrils in fibrin fibers. The parameters Δ∏ and Δz were selected to fit the force-stretch data and volume change data obtained from experiments. For the particular species of fibrin used in our experiments, Δ∏ = 16.5kBT and Δz = 19.2nm provided good fits to the data as can be seen from figure 6. Figure 6(a) and the inset to figure 6(b) show that network stiffness is very small for strains smaller than 0.1, is higher for strains up to 0.5, and increases rapidly thereafter. The reasons for this trend in the network stiffness are explained in the next paragraph. Figure 6(b) shows that the cross-sectional area of the clot shrinks rapidly till a strain of about 1.7 (in parallel with the decrease in the fraction of folded protein, see figure 8(a)) and decreases slowly thereafter (since the clot is almost incompressible after most of the proteins have unfolded, see figure 8(b)).
Figure 6.
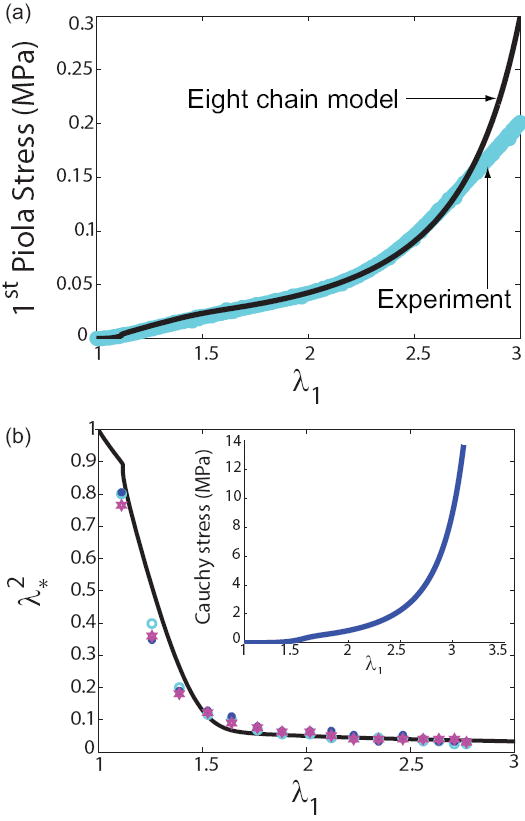
Results of the eight-chain model. (a) The stress-stretch data is reasonably fit with the eight-chain model assuming that a single fibrin fiber behaves linearly (folded state) for low strains and as a WLC (unfolded state) for large strains. We plot the first Piola-Kirchhoff stress which is the force per unit initial cross-sectional area of the clot. The parameters used in our model are based on a knowledge of the Young’s modulus in the folded state [28] and the persistence length of fibrin molecules [27] in the unfolded state. (b) The quantity is the ratio of current to initial cross-sectional area. The symbols (in both plots) are based on experimental data reported in Brown et al. [2]. The curve is generated assuming where nf and nu are the fraction of folded and unfolded fibrin molecules. Fibrin seems to behave like an ultra-compressible material due to protein unfolding. The inset shows the Cauchy stress (force per unit current cross-sectional area). The Cauchy stress is much larger than the Piola stress due to dramatic shrinkage of the clot volume and cross-sectional area. The compressibility as a function of stretch is shown in figure 8.
Figure 8.
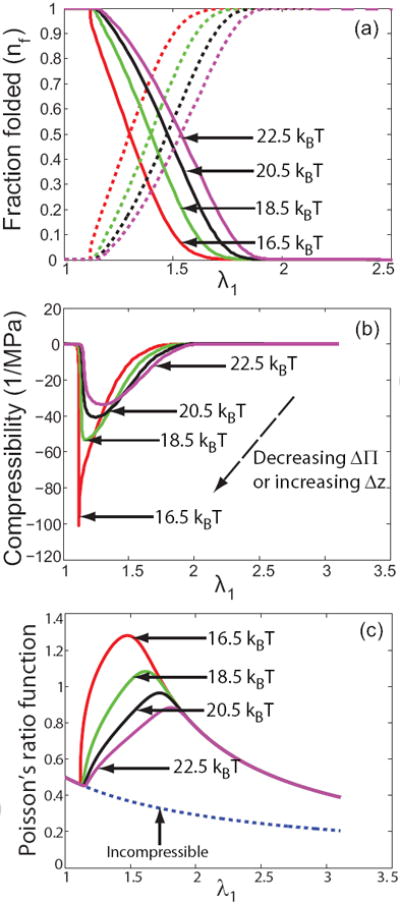
The effects of changing Δ∏. The Δ∏ values for each curve appear in the figure next to the arrows. (a) Unfolding occurs at higher stretches (or higher tension) as Δ∏ is increased. This is in agreement with intuition. The solid lines represent the fraction of folded fibrin molecules nf and the dashed lines are the corresponding unfolded fractions nu = 1 − nf. (b) Compressibility as a function of the stretch and Δ∏. The red curve is a fit to the experimental data of Brown et al. [2]. Compressibility is zero in the fully folded and unfolded states but peaks and negative values characteristic of phase transitions are observed as the fibrin molecules unfold. The phase transition from the folded to the unfolded state becomes less sharp as Δ∏ is increased. Similar trends are observed if Δz is decreased while keeping Δ∏ fixed. (c) Poisson’s ratios greater than 1 are seen during unfolding of fibrin molecules. This is unusual but consistent with negative compressibility and shows that the fibrin gel is an ultra-compressible material.
The stiffness of the network for strains lower than about 0.1 is very small even though the Young’s modulus of the fibers is in the range of 15MPa. The reason for this pliability is that the early stages of tensile deformation are mostly accomodated by alignment of the fibers along the loading direction as shown earlier in the order parameter plots in [2]. As the strain is increased further, the network stiffness remains low even for strains up to 0.5 because of a combination of fiber alignment and unfolding of proteins. The unfolded protein chains respond according to the worm-like-chain model which displays low stiffness for small values of the stretch and force and this contributes to low network stiffness for strains below 0.5. As the strain is increased even further, more of the proteins unfold and the fibers are mostly aligned with the loading direction. For strains larger than 1.0 the tensile deformation is accomodated by chain stretching. The stiffness of the network increases because the stiffness in the worm-like-chain model of entropic elasticity increases with force. These mechanisms for network pliability at low strains and stiffening at high strains are consistent with the single fiber and network studies of Hudson et al. [30].
The parameters Δ∏ and Δz obtained above and used in the remainder of the paper deserve some explanation. Δz is large because it is the distance between two wells representing the folded and unfolded states of an entire repeating unit in a protofibril which is several nanometers long. Δ∏ is large for the same reason. These parameteres are very difficult to estimate a priori since it is not clear (a) which part (or parts) of the fibrin molecule unravels in response to large forces [31], and (b) what are the interactions between the unfodled chains (for instance, figure 3 suggests that stacks of β-sheets may have formed in the stretched state of the network). For this reason we leave them as parameters to be extracted from fitting the macroscopic stress-stretch data, but check if similar numbers for these and other parametes can reproduce features in the atomic force microscopy force-extension experiments on fibrin oligomers [27] and fibers [20]. We use discrete versions of (9) and (10) adapted to an oligomer of fibrin molecules connected in series and write [32]:
| (17) |
| (18) |
where [q] means that we round-off to the integer smaller than q (recall that the monomers unfold as a whole leading to precipitous drops in the force), x is the end-to-end distance of the oligomer, F is the force applied on it by the atomic force microscope, Lf and Lu are the contour lengths in the folded and unfolded states respectively, ξf and ξu are the persistence lengths in the folded and unfolded states respectively, Nf and Nu are the number of folded and unfolded monomers in the oligomer chain, and N is the total number of monomers in the chain. We chose parameters – N = 2, Lf = 17nm, Lu = 50nm, ξf = 1.6nm, ξu = 0.8nm, kBT = 4.1pNnm at room temperature, Δ∏ = 22.5kBT and Δz = 12.2nm. All these numbers are within the range of parameters used elsewhere in this paper. The ratio of contour lengths in the unfolded state to that in the folded state is about 2.94 which is not far from the values estimated by Houser et al. [20] from their experiments on single fibrin fibers. To simulate the atomic force microscopy experiment, we initialize x = 14nm and Nu = 0, and increment x in 2nm steps and solve for F and Nf at each step. Note that the velocity of pulling or the rate of unfolding and refolding do not enter this calculation since the expressions above are written assuming that equilibrium is established after each increment (a quasi-static process). The result of this relatively simple simulation is summarized in figure 7. This figure shows that we have qualitatively reproduced the saw-tooth pattern observed in the atomic force microscopy experiments of [27] with the distance between peaks about 24nm. But, the peak forces are smaller than those in [27], likely because of loading rate-effects – in the atomic force microscopy experiments the proteins were stretched at rates of 1μm per second, whereas we have performed an equilibrium calculation that assumes no rate-dependence. Our peak forces are comparable to the peak force-per-monomer estimates obtained from atomic force microscopy experiments on single fibrin fibers by Houser et al. [20] who argue that the unstructured part of the αC region is primarily responsible for the high extensibility and strain stiffening of the fibrin fibers. Note that the smooth stress-strain curves for single fibers obtained from experiments by Houser et al. [20] are a result of having many protofibrils in parallel, each with a saw-tooth force-stretch curve, as shown in Qi et al. [4]. In summary, the calculation above suggests that the values of the parameters, especially Δ∏ and Δz, that we use are not inconsistent with atomic force microscopy experiments.
Figure 7.
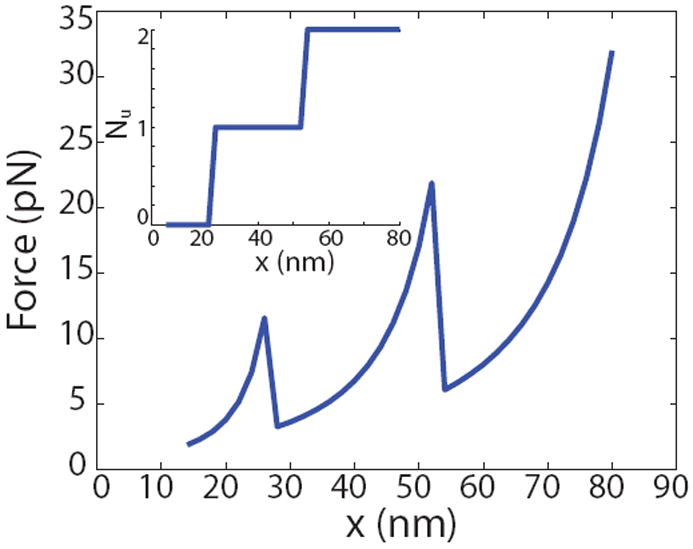
Simulating an atomic force microscopy experiment on fibrin oligomers using a discrete version of our model and paramters on the same order as those extracted from fitting macroscopic stress-stretch data. The saw-teeth in the force-extension curves and the distance between peaks are qualitatively similar to the experiments of Brown et al. [27]. The peak forces are smaller because the experiments were conducted at pulling rates of 1μm per second while our calculations assume equilibrium with no rate-dependence. The inset shows the number of unfolded monomers Nu as a function of the end-to-end distance x.
Since, Δ∏ and Δz are fitting parameters, we try to understand their effect on the constitutive behavior of the network by plotting how various quantities change with increasing Δ∏ or decreasing Δz while all other parameters are kept fixed. The summary is in figure 8. We note from figure 8(a) that unfolding occurs at higher stretches (or higher forces) as Δ∏ is increased. This is in agreement with our intuition. In figure 8(b) we plot the compressibility of the network as a function of the stretch. Note that the network is incompressible in the fully folded or fully unfolded state, but has negative compressibility [33, 34], when the unfolding process is only partially complete. Compressibility being negative here implies that when unfolding is in progress fibrin networks are stretch densifying. The volume of the network decreases when positive tension is applied, as opposed to a regular elastic solid where the volume increases when positive tension is applied. Negative compressibilities during unfolding might seem surprising but are not inconsistent with thermodynamics, which requires that compressibilities of materials with homogeneous properties be non-negative, because partially unfolded samples are inhomogeneous. A possible reason for the negative compressibility in this case is that the exposed hydrophobic residues in the unfolded fibrin molecules attract each other when they are brought closer in the transverse direction due to stretching in the longitudinal direction. This is opposite of the behavior expected of a regular solid where two neighboring atoms repel each other when they are brought closer in the same manner. Interestingly, we find that the Poisson’s ratio during unfolding is much larger than 1 (see figure 8(c)), again very different from a regular solid whose Poisson’s ratio is always smaller than 0.5 for small strains. For large deformation of incompressible polymers, the Poisson’s ratio function still remains smaller than 0.5. Such large Poisson’s ratios are rather unexpected, given that the Poisson’s ratio of isotropic linear solids is bounded, −1 ≤ ν ≤ 0.5. Most materials have Poisson’s ratios between 0.0 and 0.5; auxetic materials, such as re-entrant foams, have negative Poisson’s ratios [35], but initially isotropic materials with Poisson’s ratio greater than 0.5 have, to the best of our knowledge, not been reported. Yet, this is exactly what we observed in our experiments on fibrin clots which are mixed materials consisting of protein and water; the observed effects are thus related to a stress-induced phase separation. Indeed, the large reduction of volume upon stretching coincided with the high Poisson’s ratio regime and resulted in a negative compressibility. Hence, we can think of a fibrin gel as an ultracompressible material. Figure 8 also reveals that the phase transition (as seen from the sharp peak in negative compressibility during unfolding) is less sharp as Δ∏ is increased or Δz is decreased.
A parameter that varies depending on the animal species of fibrin(ogen) is the ratio of the unfolded to folded contour lengths Lu/Lf. Both Lu and Lf depend on the number of amino acid residues in fibrin(ogen) which varies depending on the animal species. The γ chain of fibrin(ogen) shows the least variability among vertebrate species, the Bβ chains are more variable, and the Aα chains vary considerably. Rat Aα chains are small, horse Aα chains are longer, while lamprey Aα chains are the longest known [36]. Indeed, the most likely basis for some of the interspecies variations of fibrin mechanical properties is the species-dependent difference in the length of the αC region, the unstructured C-terminal portion of the fibrin(ogen) Aα-chain. This region is remarkably important due to its specific intra- and intermolecular interactions, including covalent enzymatic cross-linking, that may determine the spacing between protofibrils in a fibrin fiber and extensibility of a fibrin fiber [37]. The αC region also influences the ratio of contour lengths of monomeric fibrin in the unfolded and folded states, and could affect the free energy difference between the folded and unfolded conformations of a fibrin molecule, which in turn affects the thermodynamic stability. For example, it is known that lamprey fibrinogen, which has the largest number of residues in the αC region, denatures at 31°C, salmon fibrinogen denatures at 45°C, while mammalian fibrinogen denatures at 56°C [38]. It has also been shown recently that the extensibility of a single fibrin fiber correlates with the length of tandem repeats in the αC region – chicken fibrin with no tandem repeats is the least extensible, while human fibrin with 128 residues in the tandem repeat region is more extensible than mouse fibrin which has 60 residues in the tandem repeat region [37].
We have determined how the parameter Lu/Lf affects the mechanical behavior while all other parameters are kept fixed. In figure 9 we show how the length of the Aα-chain of fibrinogen varies in various species. If we assume that the length of the coiled-coil remains fixed at about 23nm and that each residue in the αC region contributes about 0.36nm to the unfolded contour length, then Lu would be 296.6nm for lamprey, 163.4nm for human, 147.2nm for bovine and 127.8nm for chicken fibrinogen. We have used Lu/Lf = 2.1 for human fibrinogen to fit the macroscopic stress-stretch data, so the corresponding values of Lu/Lf for the other species would be 3.8 for lamprey, 1.9 for bovine, and 1.65 for chicken. In general, we expect that the parameters Δ∏ and Δz should also increase as the length of the αC regions increases. The reason is as follows. The unstructured region is likely in a high entropy ‘blob’ state when no forces are applied on it. In order to stretch it to a low entropy elongated state (say 0.3 times the contour length, where worm like chain behavior kicks in), we need to supply some energy. This energy is what we interpret as Δ∏ and we expect it to increase as the length of the unstructured region increases. The distance Δz between the wells corresponding to the ‘blob’ state and elongated state will also increase as the length of the unstructured region increases. The exact functional dependence of Δ∏ and Δz would be determined by a multitude of interactions, such as, electrostatics, excluded volume, confinement within the fibers, etc., and is impossible to predict. So, we cannot make quantitative predictions for stress-stretch behavior, compressibility, etc. But, we can generate qualitative trends as a function of Lu/Lf, and this is what we have done in figure 9. The results suggest that if the same stress-stretch experiment as in Brown et al. [2] was performed on fibrin from different species then (a) the stiffness at each value of the stretch will increase as length of the αC region decreases, (b) the maximum value of the stretch before rupture will increase as the length of the αC region increases (as shown in Falvo et al. [37] for a single fiber), (c) the radius of the cylindrical specimen will decrease faster as the length of the αC region decreases, and (d) the peak in negative compressibility will be sharper as the length of the αC region decreases.
Figure 9.
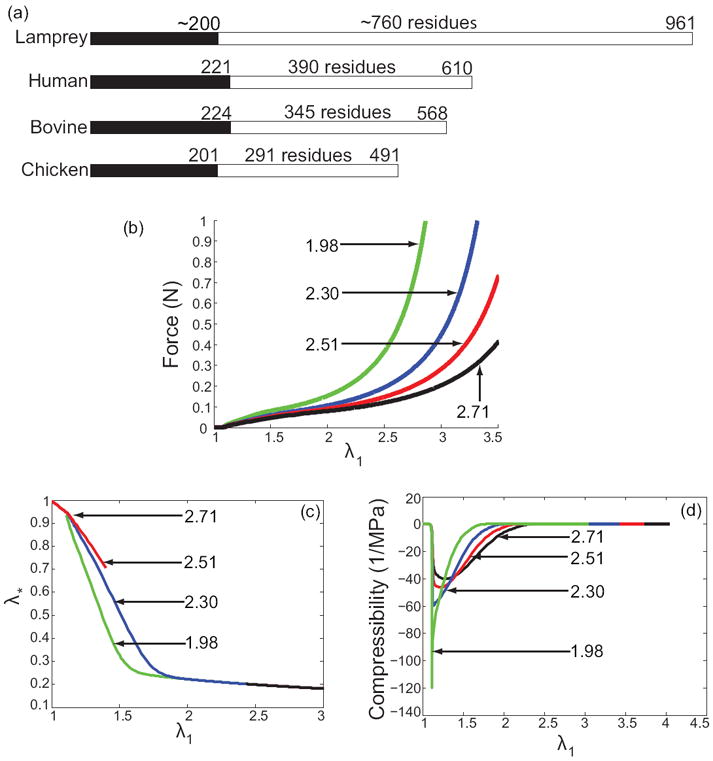
The effects of changing Lu/Lf. (a) Interspecies variability of the C-terminal part of fibrinogen’s Aα chain named the αC region. Black portion shows the α-helical segment of the Aα chain, white portion indicates the αC region. The ratio Lu/Lf could change depending on the animal species fibrin is derived from. In the figures, the values of Lu/Lf for each curve appear next to the arrows. (b) Larger stretches are seen at the same force with increasing Lu/Lf. (c) Hence, unfolding of fibrin molecules occurs at higher stretches as well. (d) The variation in fibrin network compressibility as a function of stretch with increasing Lu/Lf mirrors its variation with increasing Δ∏.
We note that figure 9 also hints at a method to control the compressibility (and Poisson’s ratio) of a fibrin network by changing the length of the fully unfolded fibrin polypeptide chains. It is noteworthy, that the αC region appears to be the most approachable target for modulation of fibrin properties, which may lead to creating new fibrin-containing materials with unique structural and mechanical properties, such as high Poisson’s ratio, high porosity, and biodegradability.
5 Conclusions
In this paper we have shown that forced unfolding of fibrin molecules at the nanometer scale leads to the unusual macroscopic response of fibrin networks. In particular, we find negative compressibilities and very large Poisson’s ratios during unfolding. We have used a modified version of the eight-chain model (which accounts for large volume changes) to interpret our experiments. We have also derived a stored energy function for fibrin networks that depends on the first and third invariants of the right Cauchy-Green strain tensor. The form of our stored energy function is different from other such functions in the literature used for polymer networks since fibrin fibers in clots undergo large stress-induced structural changes that we interpret as phase transtions. In contrast to other versions of the eight-chain model where protein unfolding is taken into account, our model can be implemented analytically. This has allowed us to perform a parameter study, which shows how the compressibility (and Poisson’s ratio) of the network might be controlled by changing the length of the fully unfolded fibrin polypeptide chains. Knowledge of the mechanical properties of this unique biomaterial is important for understanding the structural and molecular basis of its functions and pathologies. Modulation of fibrin’s properties may provide the means for interventions to prevent thrombosis and even for the development of unique new biomaterials.
Acknowledgments
A. E. X. Brown was supported by a scholarship from the Natural Sciences and Engineering Research Council of Canada. This research was partially supported by the Nano/Bio Interface Center at the University of Pennsylvania through the National Science Foundation NSEC DMR08-32802 and NIH grants HL 030954 and HL 090774.
Footnotes
Publisher's Disclaimer: This is a PDF file of an unedited manuscript that has been accepted for publication. As a service to our customers we are providing this early version of the manuscript. The manuscript will undergo copyediting, typesetting, and review of the resulting proof before it is published in its final citable form. Please note that during the production process errors may be discovered which could affect the content, and all legal disclaimers that apply to the journal pertain.
References
- 1.Weisel JW. The mechanical properties of fibrin for basic scientists and clinicians. Biophys Chem. 2004;112:267–276. doi: 10.1016/j.bpc.2004.07.029. [DOI] [PubMed] [Google Scholar]
- 2.Brown AEX, Litvinov RI, Discher DE, Purohit PK, Weisel JW. Multiscale mechanics of fibrin polymer: Gel stretching with protein unfolding and loss of water. Science. 2009;325:741–744. doi: 10.1126/science.1172484. [DOI] [PMC free article] [PubMed] [Google Scholar]
- 3.Arruda EM, Boyce MC. A three-dimensional constitutive model for the large stretch behavior of rubber elastic materials. J Mech Phys Solids. 1993;41:389–412. [Google Scholar]
- 4.Qi HJ, Ortiz C, Boyce MC. Mechanics of biomacromolecular networks containing folded domains. J Eng Mat Tech. 2006;28:509–518. [Google Scholar]
- 5.Palmer JS, Boyce MC. Constitutive modeling of the stress-strain behavior of F-actin filament networks. Acta Biomaterilia. 2008;4:597–612. doi: 10.1016/j.actbio.2007.12.007. [DOI] [PubMed] [Google Scholar]
- 6.Bertoldi K, Boyce MC. Mechanics of hysteretic large strain behavior of mussel byssus thread. J Mater Sci. 2007;42:8943. [Google Scholar]
- 7.Bischoff JE, Arruda EM, Grosh K. A new constitutive model for the compressibility of elastomers at finite deformations. Rubber Chem and Tech. 2001;74(4):541–559. [Google Scholar]
- 8.Storm C, Pastore JJ, MacKintosh FC, Lubensky TC, Janmey PA. Nonlinear elasticity in biological gels. Nature. 2005;435:191–194. doi: 10.1038/nature03521. [DOI] [PubMed] [Google Scholar]
- 9.Wu PD, van der Giessen E. On improved network models for rubber elasticity and their application to orientation hardening in glassy polymers. J Mech Phys Solids. 1993;41:427–456. [Google Scholar]
- 10.Beatty MF. An average-stretch full-network model for rubber elasticity. J Elasticity. 2003;70:65–86. [Google Scholar]
- 11.Miehe CS, Goktepe S, Lulei F. 2004. A micro-macro approach to rubber-like materials – Part 1: the non-affine micro-sphere model for rubber elasticity. J Mech Phys Solids. 2004;52:2617–2660. [Google Scholar]
- 12.James HM, Guth E. Theory of elastic properties of rubber. J Chem Phys. 1943;11:455–481. [Google Scholar]
- 13.Wang MC, Guth E. Statistical theory of networks of non-Gaussian flexible chains. J Chem Phys. 1952;20:1144–1157. [Google Scholar]
- 14.Flory PJ, Rehner J., Jr Statistical mechanics of cross-linked polymer networks: I. Rubber like elasticity. J Chem Phys. 1943;11:512–520. [Google Scholar]
- 15.Treloar LRG. The elasticity of a network of long-chain molecules– III. Trans Faraday Soc. 1946;42:83–94. [Google Scholar]
- 16.Treloar LRG. The photo-elastic properties of short-chain molecular networks. Trans Faraday Soc. 1954;50:881–896. [Google Scholar]
- 17.Treloar LRG, Riding G. A non-Gaussian theory of rubber in biaxial strain. I. Mechanical properties. Proc R Soc London Ser A. 1979;369:261–280. [Google Scholar]
- 18.Flory PJ. Principles of Polymer Chemistry. Cornell University Press; Ithaca, New York: 1953. [Google Scholar]
- 19.Beatty MF, Stalnaker DO. The Poisson function of finite elasticity. J Appl Mech. 1986;53(4):807–813. [Google Scholar]
- 20.Houser JR, Hudson NE, Ping L, O’Brien ET, III, Superfine R, Lord ST, Falvo MR. Evidence that the αC region is origin of low modulus, high extensibility, and strain stiffening in fibrin fibers. Biophys J. 2010;99:3038–3047. doi: 10.1016/j.bpj.2010.08.060. [DOI] [PMC free article] [PubMed] [Google Scholar]
- 21.Law R, Harper S, Speicher DW, Discher DE. Influence of lateral association on forced unfolding of antiparallel spectrin heterodimers. Journal of Biological Chemistry. 2004;279:16410–16416. doi: 10.1074/jbc.M313107200. [DOI] [PubMed] [Google Scholar]
- 22.Weisel JW, Nagaswami C. Computer modeling of fibrin polymerization kinetics correlated with electron microscope and turbidity observations: clot structure and assembly are kinetically controlled. Biophys J. 1992;63:111–128. doi: 10.1016/S0006-3495(92)81594-1. [DOI] [PMC free article] [PubMed] [Google Scholar]
- 23.Bailey K, Astbury WT, Rudall KM. Fibrinogen and fibrin as members of the keratin-myosin group. Nature. 1943;151:716–717. [Google Scholar]
- 24.Puchtler H, Waldrop FS, Meloan SN. A review of light, polarization and fluorescence microscopic methods for amyloid. Appl Pathol. 1985;3:5–17. [PubMed] [Google Scholar]
- 25.Fudge DS, Gardner KH, Forsyth VT, Riekel C, Gosline JM. The mechanical properties of hydrated intermediate filaments: insights from hagfish slime threads. Biophys J. 2003;85:2015–2027. doi: 10.1016/S0006-3495(03)74629-3. [DOI] [PMC free article] [PubMed] [Google Scholar]
- 26.Puchtler H, Sweat F, Levine M. On the binding of Congo red by amyloid. J Histochem Cytochem. 1962;10:355–363. [Google Scholar]
- 27.Brown AEX, Litvinov RI, Discher DE, Weisel JW. Forced unfolding of coiled-coils in fibrinogen by single-molecule AFM. Biophys J. 2007;92:L39–L41. doi: 10.1529/biophysj.106.101261. [DOI] [PMC free article] [PubMed] [Google Scholar]
- 28.Collet J-P, Shuman H, Ledger RE, Lee S, Weisel JW. The elasticity of an individual fibrin fiber in a clot. Proc Natl Acad Sci USA. 2005;102:9133–9137. doi: 10.1073/pnas.0504120102. [DOI] [PMC free article] [PubMed] [Google Scholar]
- 29.Weisel JW. Fibrinogen and fibrin. Advances in Protein Chemistry. 2005;70:247–299. doi: 10.1016/S0065-3233(05)70008-5. [DOI] [PubMed] [Google Scholar]
- 30.Hudson NE, III, Houser JR, O’Brien ET, Taylor RM, II, Superfine R, Lord ST, Falvo MR. Stiffening of individual fibers equitably distributes strain and strengthens networks. Biophys J. 2010;98:1632–1640. doi: 10.1016/j.bpj.2009.12.4312. [DOI] [PMC free article] [PubMed] [Google Scholar]
- 31.Falvo MR, Gorkun OV, Lord ST. The molecular origins of the mechanical properties of fibrin. Biophysical Chemistry. 2010;152:15–20. doi: 10.1016/j.bpc.2010.08.009. [DOI] [PMC free article] [PubMed] [Google Scholar]
- 32.Su T, Purohit PK. Mechanics of forced unfolding of proteins. Acta Biomaterialia. 2009;5:1855–1863. doi: 10.1016/j.actbio.2009.01.038. [DOI] [PubMed] [Google Scholar]
- 33.Baughman RH, Stafstrm S, Cui S, Dantas SO. Materials with negative compressibilities in one or more dimensions. Science. 1998;279:1522–1524. doi: 10.1126/science.279.5356.1522. [DOI] [PubMed] [Google Scholar]
- 34.Kornblatt A, Sirota EB, King HE, Jr, Baughman RH, Cui S, Stafstrm S, Dantas SO. Materials with negative compressibilities. Science. 1998;281:143a–143. doi: 10.1126/science.279.5356.1522. [DOI] [PubMed] [Google Scholar]
- 35.Lakes R. Foam structures with a negative Poisson’s ratio. Science. 1987;235:1038–1040. doi: 10.1126/science.235.4792.1038. [DOI] [PubMed] [Google Scholar]
- 36.Doolittle RF. The structure and evolution of vertebrate fibrinogen: A comparison of the lamprey and mammalian proteins. Adv Exp Med Biol. 1990;281:25–37. doi: 10.1007/978-1-4615-3806-6_2. [DOI] [PubMed] [Google Scholar]
- 37.Falvo MR, Millard D, O’Brien ET, III, Superfine R, Lord ST. Length of tandem repeats in fibrin’s αC region correlates with fiber extensibility. J Thromb Haemost. 2008;6:1991–1993. doi: 10.1111/j.1538-7836.2008.03147.x. [DOI] [PMC free article] [PubMed] [Google Scholar]
- 38.Gladner JA, Lewis MS, Chung SI. Molecular properties of lamprey fibrinogen. J Biol Chem. 1981;256:1772–1781. [PubMed] [Google Scholar]