

Abstract
The most direct measure of oxidative tissue metabolism is the conversion rate of oxygen to water via mitochondrial respiration. To calculate oxygen consumption from the analysis of tissue residue curves or outflow dilution curves after injection of labeled oxygen one needs realistic mathematical models that account for convection, diffusion, and transformation in the tissue. A linear, three-region, axially distributed model accounts for intravascular convection, penetration of capillary and parenchymal cell barriers (with the use of appropriate binding spaces to account for oxygen binding to hemoglobin and myoglobin), the metabolism to [15O]water in parenchymal cells, and [15O]water transport into the venous effluent. Model solutions fit residue and outflow dilution data obtained in an isolated, red blood cell-perfused rabbit heart preparation and give estimates of the rate of oxygen consumption similar to those obtained experimentally from the flow times the arteriovenous differences in oxygen contents. The proposed application is for the assessment of regional oxidative metabolism in vivo from tissue 15O-residue curves obtained by positron emission tomography.
Keywords: diffusion, convection, model, permeation, metabolic reaction, heart, myocardial blood flow, heterogeneity
The Predominant Source of energy production in the heart is oxidative metabolism, which even prevails under conditions of restricted blood flow (44). The importance of oxidative metabolism for intact myocardial function is emphasized by the rapid decrease of phosphocreatine levels and the concomitant increase of cardiac diameter during oxygen deprivation (13).
The classical view is that in the normal heart flow and function are homogeneously distributed. However, even under physiological conditions coronary perfusion exhibits a high degree of regional heterogeneity (26), ranging from one-quarter to twice the average flow. When oxygen extraction is ≥50%, this means that a low-flow region is not supplied with enough oxygen to maintain its tissues, if it requires oxygen at the average rate required by the heart. Consequently, it follows that oxygen utilization must also be at least somewhat heterogeneous. Under pathophysiological conditions, obstruction of coronary blood flow results in a decrease in regional oxygen consumption and work (23), so it is conceivable that an association between low regional consumption and low flow might be secondary to inadequate vascular supply.
Regional oxygen consumption may be a key variable in understanding the adjustment of metabolism and flow on a regional level. Because substrate metabolism of the heart greatly varies depending on the physiological state (36), a technique that determines oxygen directly has clear advantage over those using the rate constants of substrate turnover to estimate oxygen consumption indirectly. Furthermore, organs differ in their substrate preferences (for review, see Ref. 42). Thus a technique that determines oxygen consumption directly has broader and more general applicability. The development of methods that permit the assessment of oxygen consumption on a regional level seems therefore highly desirable. The feasibility of (noninvasive) assessment of regional oxygen metabolism by positron-emission tomography (PET) (16, 31) or nuclear magnetic resonance (NMR) (1) techniques has been demonstrated, but the accuracy of the methods has not been assessed.
The evaluation of NMR and PET data requires the application of mathematical models that permit the translation of raw time-concentration data into meaningful physiological dimensions. The predominant fate of molecular oxygen is its reduction by mitochondrial cytochromes, resulting in the production of water. Thus use of labeled oxygen results principally in the production of labeled water. The transport and the volumes of distribution for molecular oxygen differ remarkably from those for water (39, 40). Therefore, it should be possible to determine the regional metabolic rate of oxygen (MRO2) by measuring and modeling the regional tracer kinetics after intravascular injection of appropriately labeled oxygen. This approach should permit quantitative assessment of regional oxygen consumption by applying the principles of conservation of mass.
Oxygen models reported in the literature have a number of shortcomings that preclude their use for analysis of regional oxygen consumption. Compartmental models (16, 29, 31) most widely used in the analysis of PET data do not consider the possible effects of longitudinal (axial) diffusion gradients along the capillary length and the effects of flow heterogeneity. Furthermore, the applicability of compartmental analysis to high-temporal resolution data is limited. On the other hand, the relatively sophisticated distributed models of Groebe and Thews (20), Napper and Schubert (32), and Popel (35) mainly target oxygen transport in a steady state on the cellular and subcellular level, and their solutions are not suited for the analysis of tracer transients. The oxygen model used by Rose and Goresky (39) for studies using [18O]oxygen measured by mass spectrometry has been the best available for analyzing transients in oxygen consumption; [18O]water, however, the product of the reaction, is not distinguishable from background [18O]water and was not included in the model. For analyzing PET data to measure oxygen consumption using [15O]oxygen, this axially distributed model needs to be extended to account for the [15O]water, the permeable tracer species produced by reaction that is not distinguishable from [15O]oxygen by positron detection and imaging.
In the present study, we describe the configuration and the behavior of a mathematical model of blood-tissue exchange of oxygen and water. This model is linear and is therefore suited for the analysis of tracer fluxes in a system in steady state with respect to local oxygen partial pressures. The model 1) permits the physiologically realistic description of oxygen transport and conversion into water for tracer transients as well as for steady-state mother substrate with the use of a single parameter set that governs the kinetics of both tracer and mother substance, 2) takes the regional heterogeneity of flow and metabolism into account, 3) has an anatomically appropriate structure and provides time-domain solutions that can be fitted to residue data as well as to outflow data to provide estimates of the parameters for transport and consumption.
Finally, as an example, the model is used to fit a representative set of experimental data on tracer oxygen and water kinetics obtained in an isolated, blood-perfused rabbit heart. Both residue and outflow dilution data are used to estimate the rate of oxygen consumption; estimates for the whole heart can be evaluated against the Fick technique in isolated heart experiments. The conclusion is that this relatively simple modeling approach can provide reasonably good estimates of oxygen consumption from data of the sort obtainable from PET imaging.
Methods
Model Structure
Double capillary-tissue unit
Figure 1 summarizes the structure of the pair of three-region axially distributed models for oxygen transport, exchange, and metabolism and water transport and exchange. The three regions represented are capillary space (cap), interstitial fluid space (isf), and parenchymal cell space (pc), each with a distinct volume (V in Fig. 1) for each of both metabolites with concentration C. The regions are separated by two barriers having conductances (PS) for oxygen and water. In the capillary region, steady flow (F) is assumed. Within each region, dispersion terms (D) describe the axial (along the length of the capillary-tissue unit) dispersion of oxygen and water. Radial (perpendicular to the length of the capillary-tissue unit) diffusion equilibrium within regions is assumed to be instantaneous. Consumption of oxygen and production of water (G, gulosity or consumption, ml·g−1·min−1) are considered in the parenchymal region only. This geometry precludes the use of standard compartmental analysis, as discussed by Zierler (47). The model describes tracer exchange based on the parameters that govern the kinetics of the nontracer mother substance.
Fig. 1.
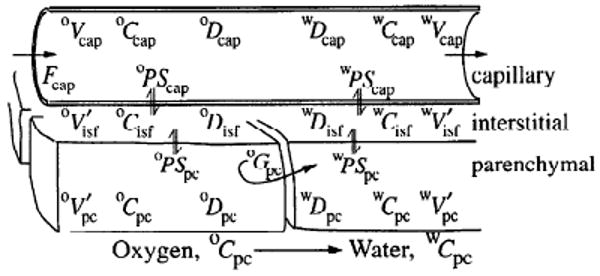
Three-region axially distributed model for blood-tissue exchange of [15O]oxygen, metabolism to form [15O]water, and tissue-blood exchange of tracer water. There are two three-region models in parallel, for oxygen and water, with the transformation occurring only in parenchymal cells governed by the gulosity (consumption) term Gpc. See text for explanation of abbreviations.
Based on a system of partial differential equations, the concentrations of oxygen (oC) and water (wC) in the three model regions are calculated as a function of time (t) and distance (x) along the length (L) of the capillary (where x varies between 0 and L). For this model, oC represents the activity or chemical potential for oxygen, equivalent to its partial pressure, in accord with the principle that gradients in partial pressure provide the driving forces for the fluxes. The model accounts for the binding within red blood cells (RBCs) and myocytes by appropriate adjustments of the effective volumes of distribution for oxygen. The concentrations for oxygen are given by the solutions to
| (1) |
for the capillary
| (2) |
for the interstitium, and
| (3) |
for the parenchymal cell.
The concentrations for water are given by the solutions to
| (4) |
for the capillary
| (5) |
for the interstitium, and
| (6) |
for the parenchymal cell.
The notation is that used in previous reports (3, 7, 28): C is mmol/ml; Fcap is capillary blood flow in ml·g−1·min−1; L, capillary length, is taken to be 0.1 cm (8); Vr is the volume of a region, in ml/g; r is a general subscript denoting region (cap, isf, or pc). , the volume of distribution in a region, is equal to the region-to-capillary partition coefficient (dimensionless) times the anatomic volume Vr (a ratio > 1 for a given region r indicates the concentration of a substance within region r, due to effective solubility compared to that in the capillary blood). Capillary transit time is Vcap/Fcap and is not influenced by the value of L, the only role of which is to define the rate of axial diffusional relaxation, D/L2. For convenience, the following volume ratios are used for oxygen and water, respectively: and .
The conductances for the solute fluxes are PS, permeability-surface area products, for the interregional exchange, in ml·g−1 min−1, equivalent to clearance terms; G, gulosity, describes the intraregional clearance by first-order reaction, in ml·g−1·min−1 (MRO2, the metabolic rate for oxygen, is considered only in the parenchymal region and is expressed as the product of Gpc·C̄pc, in mol·g−1·min−1, where C̄pc is the axially averaged Cpc); and D is axial dispersion or diffusion coefficient, in cm2/s. The velocity of plug flow in the capillary is given by oυF = FcapL/oVcap for oxygen and by wυF = FcapL/wVcap for water. In this model the velocity of convection of oxygen and water are the same. The assigned capillary volumes are equal, oVcap = wVcap. In this approach, discharge hematocrit equals microvessel hematocrit and RBC velocity is equal to plasma velocity; this failure to account for higher erythrocyte than plasma velocities is a shortcoming in the model.
Then, when consumption in the parenchymal cell is zero, the conservation equation may be written as
| (7) |
The concentric structure of the present three-region model is similar to that described by Rose et al. (40) and Kuikka et al. (28). The differences from previous models are the incorporation of a daughter product, formed in the parenchymal cell region, the transport of which is accounted for in a separate set of equations, and binding to hemoglobin (Hb) and myoglobin (Mb). The model obeys the law of conservation of mass, thus consumption of oxygen is coupled with the formation of an equivalent amount of water (½O2→H2O). For [15O]oxygen, only one oxygen atom in each oxygen molecule is labeled: the 15O-labeled oxygen is really 15O16O; this is in contrast to experiments using 18O18O or 17O17O (assayed by mass spectrometry), in which both atoms are labeled. Hence, for the present application, the disappearance of one oxygen label results in the generation of one water label. The solutions to the partial differential equations were obtained with the use of matrix techniques and the Langrangian sliding fluid element approach of Bassingthwaighte and Goresky (4) and Bassingthwaighte et al. (3). The accuracy of this numerical method has been found to be within 1% of the analytical solutions available for limiting cases without consumption or axial diffusion (3). For oxygen, oPScap represents the conductance through the series of resistances: release of oxygen from Hb, intraerythrocyte diffusion, RBC membrane permeation, intraplasma diffusion, and transport across the two membranes and cytoplasm of the endothelial cell. Likewise, other PSs summarize sequential resistances.
The volumes of distribution in the three regions are based on what may be considered the most compromising assumptions.
Large vessel and capillary hematocrits are considered identical. This allows us to consider that RBC and plasma velocities are equal. Although this assumption is not quite correct, because erythrocyte mean transit times through the coronary system are a few percent less than plasma transit times, it results in little error; most of the O2 in the blood is in the erythrocyte and is accounted for via the volume of distribution oVcap, which is the anatomic volume, so the convective velocity is correct.
Exchange occurs only in the capillary-tissue exchange unit, not in the arterioles or venules.
Within the capillary, oxygen in erythrocytes and plasma are in continuous equilibrium. This assumption is not quite correct when oxygen is being consumed but introduces almost no error because the plasma oxygen content is low compared with that in the erythrocyte. The resistance to oxygen flux from RBC to plasma is therefore accounted for as part of oPScap.
The axial diffusion terms represent phenomena in the capillary different from those in the tissue. In the tissue regions, Dr represents axial molecular diffusion. Dr can also be used to provide an approximation of the degradation of interstitial and parenchymal cell concentration gradients that occurs when neighboring capillaries have slightly different starting and ending points. This is done by using values greater than those for molecular diffusion, perhaps even as high as 10−4 cm/s. Very high values, 10−3 to 10−2 cm2/s, with L = 1 mm, flatten the axial gradients so that with Disf = 10−2 cm2/s the interstitium becomes in effect a uniform mixing chamber; such values are inappropriate and seriously distort the curve shapes.
In the capillary, Dcap represents a combination of radial molecular diffusion in the presence of a blunted parabolic velocity profile (Taylor creeping-flow diffusion) and mechanical mixing accompanying erythrocyte rotation and disturbed flow profiles (closer to Taylor turbulent diffusion) and governs the rate of axial spread of a pulse of tracer as it travels along the capillary.
The multicapillary model
The steady-state spatial distribution of regional blood flows within organs is known to be broad, having coefficients of variation of 25% or more, depending on the tissue under study and the ambient humoral, nervous, and metabolic conditions (26). To allow an appropriate description of spatial heterogeneity, the double capillary-tissue unit was incorporated into a multicapillary configuration. The blood-tissue exchange regions were composed of a set of parallel, independent capillary-tissue units. Feeding and draining these were units representing the dispersion and delay in arteries, hA(t), and veins, hV(t).
Let hcap(t) be the transport function for the set of capillary-tissue exchange units. This overall hcap(t) is the sum of the transport functions of the individual pathways, weighted for their contribution to the overall flow response
| (8) |
where fi is the relative flow (dimensionless) of pathway i as a fraction of the mean flow. The actual flow in pathway i is fi times F̄, the measured mean flow (ml·min−1·g−1). The probability of a specific flow value is described by the probability density function w(f), which is the fraction of the organ mass having a given relative flow fi. In numerical representation, wiΔfi denotes the fraction of the mass of the tissue having flow in a class centered at fi, and Δfi is the class width for the density function. The area under the density function, ΣwiΔfi, is 1.0, and the mean regional relative flow, ΣwifiΔfi also is 1. The product wifiΔfi gives the fraction of the total flow passing through the ith unit with relative flow fi.
The flow distribution underlying the modeling process can be obtained experimentally by measuring the regional deposition density of tracer microspheres for the respective experimental condition (6). These distributions can usually be fairly closely described by a mildly leptokurtic, slightly right-skewed lagged-normal density function (2) with a relative dispersion of 0.3–0.5. Relative dispersions of ∼0.5 are used to approximate the spread in relative flows expected at a spatial resolution of one to several hundred microgram volume element (voxel) sizes (5).
In series with this set of parallel, individual exchange units are the two large vessel units representing the nonexchanging conduit arteries and veins. The delay and dispersion within these nonexchanging vessel regions is described by the transport functions for the large vessel arterial segment, hA(t), and venous segment, hV(t) which were described by a dispersive vascular operator (27). Hence, the overall model transport function, ĥ(t), is given by
| (9) |
where the asterisk denotes convolution integration. The multicapillary model can be used to represent both a whole organ, as in the case of outflow-dilution data, and an individual region of interest within an organ, as is exemplified by PET or NMR data.
Choice of Parameter Values
To test the behavior of the model, a single set of realistic parameter values was used as a starting point. This data set was in agreement with published data as well as with parameter values chosen to fit residue and the outflow dilution curves after injection of 15O-labeled RBCs in an isolated heart preparation (see Table 1). Where values for a parameter were not available from the literature, known relationships to other parameters were used to constrain this parameter value. The aim was to obtain fixed values for as many parameters as possible to minimize the degrees of freedom for exploring the behavior of the model and to fit the data obtained from tracer-dilution experiments after injection of [15O]oxygen.
Table 1. Volume parameters for representative conditions with a Hct of 0.2 and arterial Po2 of 100 Torr.
| Region, Po2 | Vr, ml/g | Wr, ml/ml | Water Content, ml/g | Oxygen Content, ml O2/ml | , ml/g | , ml/g |
|---|---|---|---|---|---|---|
| Capillary, 70 Torr | 0.07 | 0.882 | 0.062 | 0.09410 | 0.07000 | 0.070 |
| ISF, 60 Torr | 0.20 | 0.800 | 0.160 | 0.00145 | 0.00309 | 0.181 |
| Parenchymal cell, 10 Torr | 0.60 | 0.800 | 0.480 | 0.00920 | 0.05870 | 0.544 |
| Arterial, 100 Torr | 0.03 | 0.882 | 0.026 | 0.0968 | 0.03087 | 0.030 |
| Venous, 25 Torr | 0.05 | 0.882 | 0.044 | 0.0454 | 0.02412 | 0.050 |
Hct, hematocrit; Vr, anatomic volume; Wr, water fraction; , virtual volume of oxygen (=oγr·oVcap); wV′r, virutal volume of water (=wγr·wVcap); ISF, interstitial fluid space. See text for explanation of symbols. Wcap = Hct·WRBC + (1 − Hct) Wp, where WRBC = 0.65, Wp = 0.94. With Vvasc (nonexchanging blood) = 0.08 ml/g, the tabulated values give Wheart = 0.78 ml/g (18, 46) or 0.82 ml/ml tissue using 1.063 as specific gravity of myocardium. CMbpc = 0.5 mM, P50 Mb = 2.5 Torr. CHb RBC = 5.3 mM, P50Hb = 26 Torr. PScap: oxygen, 2 ml·g−1·min−1; water, 5 ml·g−1·min−1. PSpc: oxygen, 10 ml·g−1·min−1; water, 1 ml·g−1·min−1. Vvein/Vvasc = 0.625; Vart/Vvasc = 0.375, where Vvein and Vart are venous and arterial volume, respectively.
Mean capillary flow was set at 1 ml·g−1·min−1 except when experimental data was modeled, in which case the experimentally measured flow was used. The capillary volume of the blood-tissue exchange unit was set at 0.07 ml/g from anatomic estimates (8, 18, 46), taking into account mass balance in blood content, hematocrit, and water contents of RBCs, plasma, and whole tissue. The volume of the large vessel segments and tubing was constrained by the transport function for a purely intravascular indicator (indocyanine green). These parameters were identical for modeling the kinetics of oxygen and water.
Virtual volumes
The virtual volume of the capillary was estimated according to the following equation
| (10) |
where oVcap and are the anatomic and the virtual capillary volumes for oxygen in ml/g; CHb is the molar Hb concentration in blood; 22.4 is liters of gaseous oxygen per mole at STP; fHb is four, to account for the four oxygen molecules or equivalents of oxygen bound to Hb [to form Hb(O2)4], in mol/mol; SHb is the oxygen saturation of Hb (expressed as a fraction of 1); α′ describes the solubility of oxygen in water, 3.03 × 10⁻⁵ ml O2·ml−1·Torr−1 (which, divided by 22.4 l/mol, is 1.35 × 10⁻⁶ mol·l−1·Torr−1); Po2 is the oxygen partial pressure in Torr; Hct is the hematocrit; WRBC is 0.65, the fractional water content of RBCs; and Wp is 0.94, the plasma water fraction.
SHb can be calculated two ways, with the Hill equation or with the Adair approximation. The Hill expression for the fractional saturation of Hb is
| (11) |
where Po2 is in Torr and the Hill exponent n is 2.7 (Hill's approximation before it was known that there were four binding sites). We used an oxygen tension at which Hb is 50% saturated with oxygen (P50) of 26 Torr. The Adair approximation for human blood, an excellent descriptor, is better (35)
| (12) |
where x is Po2 in Torr, α1 = 0.01524, α2 = 7.1 × 10⁻⁵; α3 = 0 (for human), and α4 = 2.7 × 10⁻⁶, all at a P50 of 26 Torr. (The dependency on P50 is accounted for in these empirical expressions: α1 = (P50)−0.4948 × 10−1.117; α2 = (P50)0.7473 × 10−5.207; α3 = 0; α4 = (P50)−3.955 × 100.0238. The Hill expression gives values of SHb a little too high for Po2 < P50 and too low for Po2 > P50, whereas the Adair expression gives more precise fits to data (35), and we used the latter for the calculations.
At a Hct of 0.45, the overall blood Hb concentration, CHb, is the molar RBC Hb concentration, CHb RBC, times Hct, or 5.3 mM × 0.45 or 2.4 mM. For a capillary Po2 of 100 Torr, SHb is 0.99, fHb is 4, and α′ is 1.35 × 10⁻⁶ M/Torr at 37°C, is 87.3, and at Hct of 0.2 the ratio is 36 (11). (At a capillary Po2 of 50 Torr, is 155, and at 500 Torr it is 17.9.)
In the model the anatomic capillary volumes for oxygen and water were made identical, 0.07 ml/g, so that in Eqs. 1 and 4 oxygen and water would have identical velocities (and transit times) along the capillary, to reemphasize that in this model the RBCs and plasma have equal velocities. The virtual volumes in the extravascular regions were the anatomic volumes times the equilibrium ratios of oxygen or water concentrations (total, not free) in the extravascular space relative to that in the vascular space. These ratios necessarily depend on Hct and CHb RBC, normally ∼35 g/100 ml or 5.3 mM. The general description for the volume of distribution in tissue region r is a calculation from its true anatomic volume Vr, taking into account the virtual volume in the capillary, and binding of the solute (oxygen or water) in the region
| (13) |
For a capillary volume of 0.07 ml/g, a Hct of 20%, a capillary Po2 of 100 Torr, an interstitial Po2 of 30 Torr, and a cell Po2 of 2.5 Torr, the calculated virtual volumes for oxygen in the interstitial region and the parenchymal cell region are 1.5 and 0.38 μl/g, respectively, assuming no binding in these regions. To account for the effects of Mb on the volume of distribution inside the parenchymal cell region, the was calculated
| (14) |
where fMb = 1 because one oxygen binds to one molecule Mb, and CMb is the myocyte concentration of Mb, ∼0.5 mM. The last term of the equation is SMb, the fractional saturation of Mb; the 50% saturation of Mb occurs at Po2 pc equal to P50 Mb, ∼2.5 Torr. The calculated value for , 5.6 μl O2/ml cell or 0.25 mM when CMb = 0.5 mM, is then used in Eq. 13. Vpc is the anatomic and is the virtual parenchymal cell volume, in ml/g. In the absence of Hb in the vascular space, and with a Po2 in the myocyte of 2.5 Torr, giving half-saturation of Mb, the calculated is 1.19 ml/g, which is twice ; Vpc is 0.60 ml/g with a water fraction of 0.8. With Hct = 0.2, the volume of distribution , because it is relative to , becomes much smaller: ml/g at a cell Po2 of 2.5 Torr, with capillary Po2 still at 100 Torr. (See Table 1 for representative conditions.)
The concept illustrated by Eqs. 13 and 14 is that the effective volumes of distribution for tracer are dependent on the ambient concentrations of oxygen in each of the regions. The reason for emphasizing these volumes of distribution is that the mean transit time for a permeating tracer is the mean transit time for an indicator restricted to remain in the vascular spaces multiplied by its total volume of distribution in the tissue divided by the volume of the vascular space. The values change significantly with changes in arterial Po2 and Hct, which influence delivery, and with changes in cellular Po2 and oxygen consumption, which govern intracellular content and clearance. For example, with an arterial Po2 of 150 Torr, a Hct of 10%, and no oxygen consumption, as with cyanide administration, and become 0.014 and 0.171 ml/g, respectively. With capillary Po2 at 25 Torr, a Hct of 10%, cellular Po2 at 2.5 Torr, and a CMb of 0.5 mM, the ratio of total intracapillary oxygen to dissolved oxygen is 33 (normally ∼84 at a Po2 of 100 Torr and Hct of 0.45) and is 0.147 ml/g. Thus is higher with high cellular Po2, high CMb, low Hct, and low capillary Po2.
Diffusion coefficients
The bulk diffusion constant for oxygen in the capillary space is determined by the rates of diffusion in the plasma and the RBCs. The diffusion constant of oxygen in plasma is 2.18 × 10⁻⁵ cm2/s (17). There are three equivalent ways of calculating a bulk diffusion coefficient, D̄, inside RBC for the estimation of the diffusive flux of a solute that binds and unbinds instantaneously to a mobile site: the particular D̄ may be applied to the concentration of free solute, to that of bound solute, or to that of the total (free and bound) solute. All are equivalent for tracer diffusion when the solute-ligand binding achieves instantaneous equilibration and when there are no spatial gradients in the concentration of the solute or ligand. Inside erythrocytes the total flux Jtot by diffusion is via the diffusion of oxygen in the cytosolic water plus that of bound oxygen with Hb
| (15) |
where oCRBC, the concentration of free oxygen inside the erythrocyte, is WRBC·α′·Po2, CHbO2, the concentration of bound oxygen in RBC, is 22.4·CHb RBC·fHb·SHb, oD̄RBC and are defined by the last two expressions, and oDRBC and DHb are diffusion constants inside RBC for oxygen and for Hb, 0.95 × 10⁻⁵ and 0.014 × 10⁻⁵ cm2/s (10, 38), respectively. The aqueous oxygen diffusion occurs only in the water fraction of the cell; WRBC is 0.65. Oxy-Hb and reduced Hb have the same diffusion coefficient. The equation accounts for facilitation due to diffusion of Hb-bound oxygen, whose molar concentration is high (35). For Po2 of 100 and 25 Torr and a CHb RBC of 5.3 mM, the bulk diffusion constants (oD̄RBC) were 0.0179 × 10⁻⁵ and 0.0154 × 10⁻⁵ cm2/s at these two Po2 levels. Consider the free oxygen concentration oCRBC as the driving force, the effective diffusion coefficient and, for a capillary Po2 = 70 Torr, .
We assume that RBCs and plasma are spaced as plasmatic gaps and RBC plugs in series within the capillary region, an assumption previously followed by Hellums (22). Then the axial diffusional resistance of a capillary (Rcap) may be approximated by
| (16) |
where RRBC and Rp are the diffusional resistances in RBC and plasma regions weighted for the Hct. Assuming that the diffusional resistance is inversely related to the diffusion constant in each region, that erythrocyte membrane permeability is infinite, and using and assuming that the free oxygen concentration within the erythrocyte oCRBC equals oCP, the oxygen concentration in plasma, one obtains
| (17) |
With this approach the calculated bulk capillary diffusion constant oD̄cap at a Po2 of 70 mmHg and Hct of 20% was 2.49 × 10⁻⁵ cm2/s, which must be an overestimate. At the other extreme arrangement, RBC and plasma diffusion in parallel oD̄cap would be 2.87 × 10⁻⁵ cm2/s, which is also an exaggeration, because the RBC does not form a continuum.
The calculation for the overall diffusion coefficient using the approach of Safford et al. (41) accounts for diffusion in series and in parallel and for permeation on all erythrocyte surfaces; with the use of this, with Hct = 0.2 and a permeability of 0.01 cm/s, the estimated oD̄cap was 1.67 × 10⁻⁵ cm2/s, using a RBC volume of 9 × 10⁻¹¹ cm3. This is the best way to estimate oD̄cap; the method is summarized in the appendix.
The average steady state intraparenchymal cell diffusion constant (oD̄pc) was calculated after
| (18) |
where oCpc = Wpc·α′·Po2 pc,CMbO = 22.4(CMb·SMb), with SMb = Po2 pc/(Po2 pc + P50 Mb) and oDpc and DMb are the diffusion constants for free oxygen and for Mb [1.16 × 10⁻⁵ and 0.08 × 10⁻⁵ cm2/s (12, 24)]. Note that Eqs. 15,17 and 18 are for tracer diffusion coefficients, not for the net flux of oxygen nontracer down its gradient. For a Mb concentration CMb of 500 μM and half saturation of Mb at a Po2 of 2.5 Torr, a bulk intracellular oxygen diffusion constant of 0.092 × 10⁻⁵ cm2/s was obtained. This considers oCpc + CMbO to be the driving force and reflects a sixfold increase of diffusional flux due to mobility of Mb.
Permeabilities and consumption
The PS value for the capillary was taken to be 2 ml·g−1·min−1, based on the analysis by Rose and Goresky (39). The ratio for oPSpc/oPScap was set to 10 to account for the difference in surface area between parenchymal cell membranes and vascular wall (33, 34, 45). Consumption of oxygen is assumed to occur only in the parenchymal region, where the cellular clearance rate of oxygen, oGpc, was a free parameter, and consumption is oGpc × oC¯pc, where oC¯pc is the average oCpc over the axial length of the capillary-tissue unit.
Because the conductances oPScap, oPSpc, and oGpc are in series, there is reciprocal interaction among them. The estimates of consumption are quite insensitive to error in the conductances. An erroneously high estimate of oPS (oPScap, oPSpc, or both) is compensated for by underestimation of oGpc, because high PS values lead to high values of oCpc, with the result that the flux due to consumption, oGpc·oCpc, is estimated with little error. The robustness of the estimates of flux despite other errors is due to the model's demand to fit the area of the [15O]oxygen curves and the clear separation of the [15O] oxygen curve from the [15O]water curve.
Parameters for [15O]water
The volumes of distribution for the different regions were set to those known for the water spaces [0.181 and 0.544 ml/g for the interstitial and parenchymal regions, respectively (4)], giving a total water space of 0.772 ml/g. The diffusion constant for water in the capillary space (1.36 × 10⁻⁶ cm2/s) was taken from Redwood et al. (37) for a Hct of 20%. The diffusion constants for water in the interstitium and the parenchymal space were set to 0.52 and 0.66 × 10⁻⁵ cm2/s from the estimates of Safford et al. (41) for the cat heart. The PS values for water used were 5.0 and 1.0 ml·g−1·min−1 for the capillary and parenchymal cell barriers, respectively (40). With the use of this parameter set as a starting point, we evaluated the effects of the input function, the volume of distribution, the regional barriers, substrate consumption, flow/consumption ratio, and flow heterogeneity on the time concentration curves for the venous effluent and the residue.
Volumes of the arteries, veins, and capillaries chosen in accord with the total vascular volumes measured by Gonzalez and Bassingthwaighte (18) constrain the total vascular volume to between 0.12 and 0.15 ml/g, including Vcap. With 0.03 for the volume of the arterial systems, 0.07 for the volume of the capillaries used, and 0.05 for the volume of the veins, a total of 0.15 ml/g is obtained (Table 1). Intravascular dispersion is accounted for in the vascular operators (27) by a ratio of the standard deviation of the dispersion to the mean transit time of 0.2.
Experimental Setup
Experiments using injections of 15O-labeled RBCs in isolated blood-perfused rabbit hearts provided data for testing the model for oxygen metabolism in the heart. The overall system is diagrammed in Fig. 2. Blood of the same Hct containing ∼20 mg/l indocyanine green dye was preequili-brated with [15O]oxygen in an oxygenator system. This pre-equilibrated blood was used to fill an injection loop upstream to the heart, and the flow was switched to go through the loop to inject tracer and dye into the inflow.
Fig. 2.
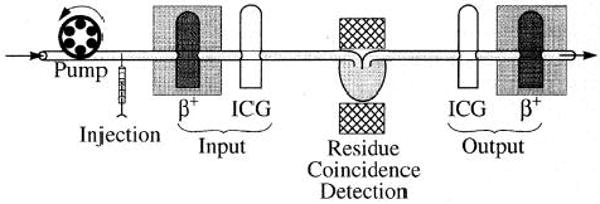
Experimental setup for isolated blood-perfused heart studies. β+, positron-detecting plastic scintillator probes; ICG, indocyanine green detectors. NaI coincidence γ-detecting crystals are on opposite sides of heart (center).
Hearts were perfused at a constant flow rate with a modified Krebs-Ringer buffer containing washed human erythrocytes at a Hct of 20%, a Po2 of 200 Torr, and a temperature of 37°C. Coronary flow rate (typically 0.7–1.0 ml·g−1·min−1) was adjusted to keep coronary perfusion pressure of this “nonworking,” spontaneously beating (110–130 beats/min) preparation at 50 mmHg. The coronary venous effluent perfusate exited via a catheter and advanced into the right ventricle via the pulmonary artery.
To obtain the transport function for the experimental setup, flow-through densitometers were placed on the coronary inflow and outflow cannulae to measure the concentration-time curves for indocyanine green (2). The dye curves defined the inflow for the dye, which is bound to plasma albumin and has the same shape as the inflow curves for the [15O]oxygen. The outflow curve defined the transit time for a purely vascular indicator. The inflow and outflow dilution curves for [15O]oxygen were obtained with use of a positron-detecting, plastic scintillator, flow-through detector similar to those described by Lerch et al. (30), Iida et al. (25), and Weinberg et al. (43). The residue function of the whole heart was obtained with two thallium-activated NaI detectors used in coincidence mode and positioned to give maximal recovery of the annihilation events occurring in the heart (21). Analog and digital data were collected on-line using ASYST (Keithley Asyst), a PC-based program. Sampling rates were 1 Hz for the 15O tracer and 30 Hz for the dye curves. After appropriate correction for baseline and radioactive decay, the data were transferred to a UNIX-based SUN workstation for model analysis.
The modeling analysis was performed using the SIMCON (simulation control) interface provided by the National Simulation Resource at the University of Washington. For data fitting, both manual and automated parameter adjustment were used, the latter with sensitivity analysis now available as a sensitivity function-based optimizer (9) under SIMCON. With the use of a Sparcstation 1+ (1.7 Mflops), computer time required for generation and display of model solutions (for [15O]oxygen and [15O]water simultaneously) for fitting data of 2-min duration after the injection took ∼20 s. For automated optimization, the display of solutions is turned off; the time required for convergence was 1–4 min to obtain estimates of oGpc · oCpc.
Results
General Appearance of Residue and Outflow Curves
In Fig. 3, model calculations are shown for the residue and outflow dilution curves of oxygen and water, assuming a bolus injection of oxygen into the inflow cannula. The residue curve is the convolution (denoted by the asterisk) of the input function, Cin(t), with R(t) the time domain residue function that would be obtained with an impulse input. Likewise, Cout(t) = Cin(t)*h(t), where h(t) is the response at the outflow to a unit impulse input. For the input function a lagged-normal density curve with a mean transit time of 4 s, a relative dispersion of 0.5, and a skewness of 0.9 was used. Coronary flow rate was set to 1 ml·g−1·min−1, large-vessel volumes were set to 0.08 ml/g, and capillary volumes were set to 0.07 ml/g. The oxygen-specific parameters were interstitial and parenchymal cell virtual volumes (0.006 and 0.018 ml/g, respectively); capillary and parenchymal cell PS values were 2 and 20 ml·g−1·min−1, respectively; and parenchymal cell clearance, oGpc, was 2 ml·g−1·min−1. A single-path capillary-tissue model with 30 axial segments was used in series with an artery and a vein, if not otherwise stated. These parameter values were used throughout this manuscript.
Fig. 3.
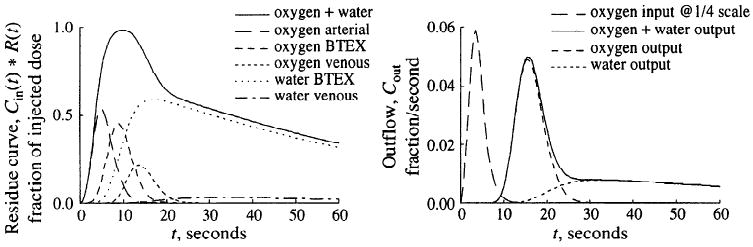
Residue and outflow dilution curves for oxygen/water model in response to a dispersed pulse input. Left: simulated residue 15O signal represents weighted sum of tracer concentrations in several regions in either form, [15O]oxygen or [15O]water. With parameters chosen, average oxygen extraction was 62%. Note that whereas the oxygen signal dominates the early peak of residue curve, the water signal forms the tail and the contribution of [15O]water in venous volume is small. Right: flow-through signal simulated for two β+ detectors located on inflow and outflow tubing. For the example shown, outflow signal is dominated by the fraction of unmetabolized oxygen at early time points; later than 30 s, however, [15O]water dominates almost exclusively. Arterial, nonexchanging arterial vessel segments; BTEX, blood-tissue exchange unit; venous, nonexchanging venous vessel segments; Cin(t), input function; R(t), time domain residue function; input, beginning of arterial vessel segment; output, end of venous vessel segment, Cout, outflow.
As shown in Fig. 3, oxygen appeared first in the nonexchanging arterial vessel segment and thereafter reached the blood-tissue exchange unit, where one fraction, leaving the capillary region, entered the parenchymal cell region to be largely metabolized to water. Another fraction, not metabolized, appeared at the capillary end after a mean capillary transit time of 4.2 s. The metabolic product water slowly escaped from the blood-tissue exchange unit, as indicated by the small decay rate of the residue and the retarded appearance of water in the capillary outflow. At early time points, the total tissue residue curve was largely influenced by the oxygen fraction passing through the nonexchanging large vessel segment and the blood-tissue exchange unit, whereas later than 30 s after bolus injection the total tissue residue was virtually identical to the water residue.
To estimate steady-state oxygen extraction [(arterial concentration – venous concentration)/arterial concentration] and the MRO2, a constant input equivalent to an arterial oxygen concentration of 4.2 M was used. With this input and the set of parameter values described above, the model solution exhibited an oxygen extraction of 62% and a MRO2 of 2.55 μmol·g−1·min−1 (Table 2).
Table 2. Effects of capillary flow rate and parenchymal cell clearance rate for oxygen on transport and metabolic rate of oxygen.
| Fcap, ml·g−1·min−1 | oGpc, ml·g−1·min−1 | Extraction, % | Parenchymal [O2], μmol/ml | MRo2, μmol·g−1·min−1 |
|---|---|---|---|---|
| 1.00 | 2.0 | 62 | 1.27 | 2.55 |
| 1.50 | 2.0 | 47 | 1.46 | 2.93 |
| 2.25 | 2.0 | 35 | 1.61 | 3.22 |
| 1.00 | 4.0 | 71 | 0.74 | 2.96 |
| 1.00 | 8.0 | 77 | 0.40 | 3.20 |
| 1.50 | 4.0 | 57 | 0.88 | 3.52 |
| 2.25 | 8.0 | 48 | 0.56 | 4.50 |
Fcap, capillary flow; oGpc, oxygen clearance (gulosity) in parenchymal cell; MRo2, metabolic rate of O2.
Effect of Input Function
The effect of the breadth of the input curve on the residues of oxygen and water is exemplified in Fig. 4 for the same model parameter set as in Fig. 3. With a narrow input (t = 2 s), the residue signal achieved a plateau, indicating that virtually all the tracer in the input had entered the organ before any had exited. Second, the curves show that by 15 s most of the residue was [15O]water, the [15O]oxygen having exited. With a broad input (t = 20 s), the oxygen and water curves are more overlapping. With a constant [15O]oxygen infusion, the ratio between total [15O]water and [15O]oxygen residues in the blood tissue exchange unit continuously increased, not reaching a steady state until after >3 min (not illustrated).
Fig. 4.
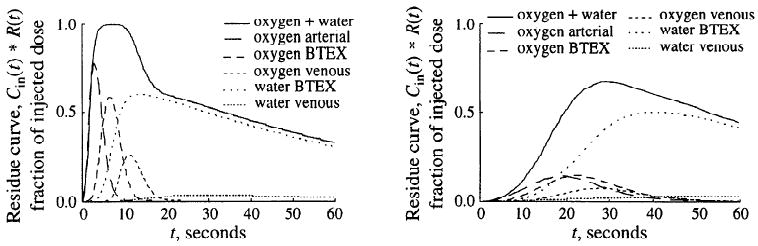
Left: effect of short (t = 2 s) input function. Right: effect of long (t = 20 s) input function on form of residue curve and its components. For abbreviations see legend to Fig. 3.
Effects of Parenchymal Cell Volume of Distribution
The effects of different volumes of distribution for oxygen were simulated with the use of the example of changing Mb and Hb concentrations. In the model, an increase in the parenchymal cell Mb concentration from 0 to 500 μM at half oxygen saturation is equivalent to changing the virtual volume of the parenchymal cell region from 0.0004 to 0.036 ml/g (Hct = 0.2, Po2 cap = 70 mmHg, and Po2 pc = 2.5 mmHg). If no Hb is present in the capillary region, the virtual volume of the parenchymal cell region would be 1.81 ml/g (Mb = 500 mM). In Fig. 5 are shown model calculations for the residues of oxygen and water of the blood-tissue exchange unit and the respective outflow curves after the usual lagged-normal density input with t = 4 s. All parameter values were those described above and used for the simulations shown in Fig. 3, except for this figure the artery and vein volumes were set to zero. As the increased, the area under the oxygen residue curve rose and the peak of the oxygen outflow dilution curve was diminished, compatible with a greater amount of oxygen entering the parenchymal cell region at early time points. The tail of the oxygen residue curve was prolonged by increasing the virtual volume of the parenchymal cell region (increased Mb concentration), and the oxygen remained longer in the organ. Concomitantly, the early rise of the water residue was retarded, indicating an increased average time span between oxygen entry into and consumption within the parenchymal cell region. The peak of the oxygen outflow curve was reduced at higher volumes of distribution for oxygen, whereas the tail was elevated and exhibited a lower slope. The effects on the peak of the oxygen dilution curve were due to an enhanced first-pass extraction of oxygen, because the Mb inside the cells competes with the intravascular Hb for the oxygen. The elevated tail of the oxygen outflow curve was due to a fraction of oxygen which, on leaving the capillary-tissue region, was not consumed in the parenchymal cell region and returned to the capillary region. As the parenchymal volume of distribution for oxygen increased, this fraction returned at later time points. Because we modeled the water exchanges to account for diffusional resistance in the extravascular region, using a low value for wPSpc, the peak of the water outflow curve was more than one order of magnitude below that of the oxygen curve. It should be emphasized that despite the profound transient changes in oxygen transport induced by changing the parenchymal cell volume of distribution, the MRO2 remained unchanged (2.55 μmol·g−1·min−1). Therefore the water residues for the different solutions converged at late time points. A good experimental test of the model is to use the model solutions in this figure to illustrate the design of an experimental series, changing the affinity of Mb by competition with CO or other inhibitors of oxygen binding.
Fig. 5.
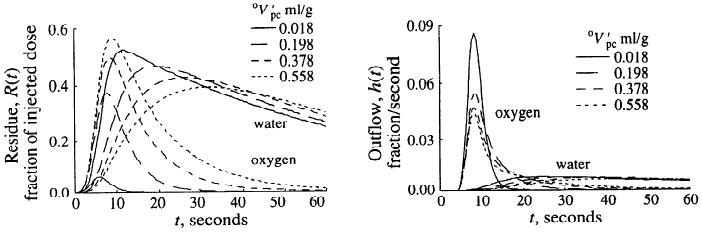
Effect of parenchymal cell volume of distribution for oxygen on residue and outflow dilution curves. Increasing myoglobin binding space in parenchymal cell greatly increases [15O]oxygen component of oxygen residue and retards peaks of water residue and outflow curves.
Effects of PS
In Fig. 6 are summarized model calculations on the effects of different capillary wall and parenchymal cell membrane PS values for oxygen on the residues and the outflow dilution curves after the usual lagged-normal density input. All parameter values were identical to those of Fig. 3 except the PS values, which were adjusted. For simplicity, the large vessel segment was not included in the analysis shown in Fig. 6. Increasing the oPScap for oxygen (Fig. 6, left panels) reduced the peak of the oxygen residue and enhanced the peak of the water residue (middle panel). Although the average parenchymal cell oxygen concentration increased (not shown), the area under the oxygen outflow curve was reduced and the area under the water outflow curve was augmented (bottom panel). The model solutions show that increasing the oPScap had a significant impact on MRO2 due to increased oxygen extraction. At a oPScap of 0.3 ml·g−1·min−1, steady-state oxygen extraction was 23% and the MRO2 was 0.94 μmol·g−1·min−1. At a oPScap of 8.1 ml·g−1·min−1, the steady-state extraction was 77%, and the MRO2 increased to 3.2 μmol·g−1·min−1. Similar results were obtained when model calculations were carried out to assess the influence of oPSpc (Fig. 6, right panels). However, because in the model oPScap was lower than oPSpc, the effects of changing oPSpc were less pronounced than those shown in the left panels for oPScap. The influences of wPScap and wPSpc are not shown; increasing wPSpc from 0.1 to 2.7 ml·g−1·min−1 steepened the tail of the water residue curve and accelerated the outflow of water. Because in the model the conductance of the parenchymal cell membrane for water was set low compared with that of the capillary wall, changing wPScap had only small effects on the water residue and outflow dilution curves.
Fig. 6.
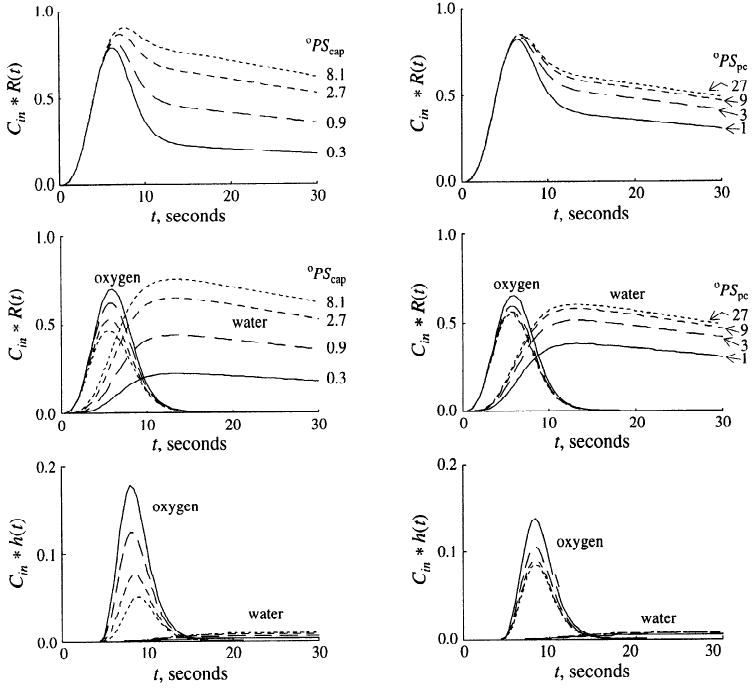
Influences of capillary (oPScap; left) and parenchymal cell oxygen permeability-surface area product (oPSpc; right) on [15O]oxygen and [15O]water residue and outflow dilution curves. For left panels, oPSpc = 20 ml·g−1·min−1; for right panels, oPScap = 2 ml·g−1·min−1. Capillary (wPScap) and parenchymal cell (wPSpc) water permeability-surface area products were 5.0 and 1.0 ml·g−1·min−1 for all solutions. Top: total 15O residue (oxygen and water) in blood-tissue exchange unit. Middle: [15O]oxygen and [15O]water residue curves. Bottom: outflow dilution curves. PS units are ml·g−1·min−1; h(t), response at outflow to unit impulse input.
Effects of Oxygen Supply and Cellular Clearance
In Fig. 7 are shown model calculations on the influence of the parenchymal cell clearance of oxygen on the residue curves for oxygen and water after the same lagged normal density input. Except the clearance for oxygen, Gpc, the parameter values were identical to those described above. No large vessel segment was included in the analysis. As the clearance rate of oxygen increased, the area under the oxygen residue curve was diminished, whereas the area under the water residue was increased. These changes corresponded to an increase in the calculated steady-state MRO2 from 0.75 to 3.21 μmol·g−1·min−1. Because flow was set constant, the increase in the MRO2 was exclusively due to enhanced oxygen extraction from the capillary region. Because the PS values for oxygen remained unchanged, there was only a small (5%) difference between the average capillary and parenchymal cell oxygen concentration at the lowest clearance (0.1 ml·g−1·min−1), whereas oC̄cap/oC̄pc was 5.4 at a clearance of 8.1 ml·g−1·min−1.
Fig. 7.
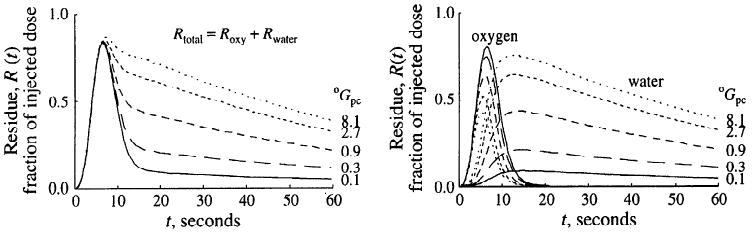
Effect of increasing oxygen metabolic clearance, oGpc, on residue curves after [15O]oxygen bolus input. Increasing oGpc from 0.1 to 8.1 ml·g−1·min−1 scales both residue and outflow (not shown) oxygen curves down and scales water curves up (right). This changes the shape of the externally detected 15O residue curve, Rtotal, by raising the tail of the curve and making the early peak much less evident (left). oPScap and oPSpc were 2 and 20 ml·g−1·min−1, respectively. Roxy, Rwater, [15O]oxygen and [15O]water residue curves, respectively.
In the model, the MRO2 may increase in proportion to capillary flow or oxygen extraction or both. We tested whether the present model calculated the influences of flow and parenchymal cell clearance rate on the total tissue residue of oxygen and water in a physiologically realistic manner. The parameter set chosen was that described for Fig. 3, except that the values for capillary flow rate, Fcap, and parenchymal cell clearance rate, oGpc, were varied. As an input, a steady-state arterial oxygen concentration of 4.2 mM was used. The results are summarized in Table 2. Increasing flow from 1.0 to 2.25 ml·g−1·min−1 decreased oxygen extraction from 62 to 35%. However, the average parenchymal cell oxygen concentration was elevated from 1.27 to 1.61 mM, and thus the MRO2 increased from 2.55 to 3.22 μmol·g−1·min−1. If flow was held constant at 1 ml·g−1·min−1, changing the oGpc from 2 to 8 ml·g−1·min−1 increased capillary oxygen extraction from 62 to 77% and the MRO2 from 2.55 to 3.20 μmol·g−1·min−1. Because oxygen was more effectively consumed, the parenchymal cell oxygen concentration fell from 1.27 to 0.40 mM. If Fcap and oGpc were simultaneously increased from 1 to 2.25 ml·g−1·min−1 and from 2 to 8 ml·g−1·min−1, respectively, the MRO2 increased from 2.55 to 4.5 μmol·g−1·min−1, capillary oxygen extraction fell from 62 to 48% and parenchymal cell oxygen concentration decreased from 1.27 to 0.56 mM.
Effects of oGpc-to-F Ratio on Axial Capillary Oxygen Gradients
In a last test of model behavior, the model was used to calculate oxygen gradients along the capillary length for the capillary and parenchymal cell region. The calculations were done for a range of capillary flows observed in the in situ sheep heart under physiological resting conditions (6). In a first set of simulations only flow was varied, with all other parameters kept constant at the usual values. As input, a steady-state arterial oxygen concentration of 4.2 mM was chosen. The results are exemplified in the left panel of Fig. 8, by the gradients in oxygen concentration as a function of position along the capillary-tissue unit from the entrance at x = 0 to the exit at x = 1. The flows seen in the normal heart in anesthetized sheep (6) ranged between 0.12 and 2.0 ml·g−1·min−1, the values used for Fig. 8. For the higher capillary flow, the model shows a twofold concentration difference between the capillary region and the parenchymal cell region along the capillary length. At the higher flow and a oPScap of 2 ml·g−1·min−1 for oxygen, steady-state arterial oxygen extraction was 25%. For a low-flow path (flow 0.125 ml·g−1·min−1) the axial oxygen gradient was calculated to be much steeper, resulting in near-zero oxygen concentrations halfway along the capillary-tissue unit, at x = 0.5, an unrealistic situation. Based on the assumption that the distribution of the regional MRO2 matches the regional distribution of flow, further analyses were carried out in which the ratio of the parenchymal cell oxygen clearance and capillary flow was kept constant for individual flow-paths (cell clearance ≈ 2 × capillary flow). The result, shown in the right panel of Fig. 8, is that the range of oxygen concentrations calculated for a low-flow path is now entirely covered by that calculated for a high-flow path.
Fig. 8.
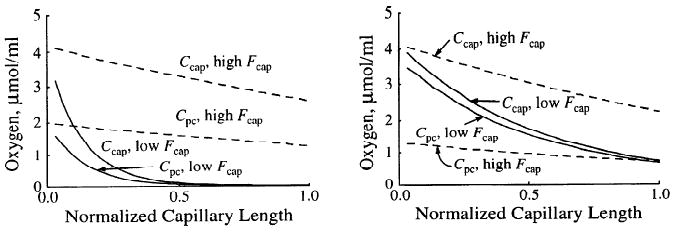
Oxygen concentration profiles in capillary and cell regions at high and low flows. Low and high capillary flow (Fcap) were 0.125 and 2.0 ml·g−1·min−1, respectively. Left: regional oGpc = 2 ml·g−1·min−1 in both high- and low-flow regions. Right: ratio oGpc/Fcap = 2.0 for both high- and low-flow regions.
Figure 9 shows the magnitude of the effect for a given flow heterogeneity on the variability of venous outflow oxygen concentrations. With uniform oGpc, there is a wide range of outflow concentrations (solid line, right panel), which narrowed with oGpc/Fcap constant (dashed line). If parenchymal cell clearance of oxygen was modeled in proportion to flow, 94% of the venous oxygen concentrations were between 1 and 2 mM. If, however, parenchymal cell oxygen clearance was assumed constant, independent of flow rate, 11% of regional venous oxygen concentrations were >2 mM and 22% were <1 mM.
Fig. 9.
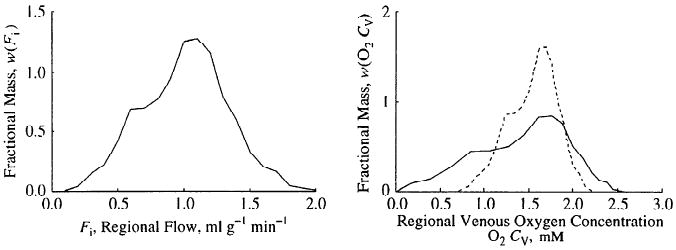
Effects of local matching of consumption and flow on distributions of local venous oxygen concentrations. Left: probability density function of regional tissue blood flows in left ventricular myocardium of a sheep (6). Right: distributions of regional venous outflow oxygen concentrations for two situations, oGpc uniform everywhere (continuous line) and oGpc/Fcap = 2.0 (dashed line) representing matching of consumption and flow.
Application of the Model
An application of the present three-region, axially distributed oxygen model is shown in Fig. 10. The figure summarizes the data obtained simultaneously via two flow-through β+ plastic scintillation detectors, residual myocardial counts via gamma photon coincidence detectors, and two flow-through indocyanine green densitometers after coinjection of 15O-labeled RBCs and indocyanine green into the inflow cannula of an isolated perfused, nonworking rabbit heart. The concentration-time curve of indocyanine green, bound to albumin, is used to define the vascular transport function, described by an operator composed of a delay line and a fourth-order differential operator in series (27). The inflow β+ detection specifies the inflow of labeled RBCs into the preparation, and the outflow β+ detection gives the summarized time activity curves for unmetabolized [15O]oxygen and [15O]water. The residue curve is the integral of tracer that has entered the region of interest but not yet left. It reflects activity within the different tissue regions, the tubing, and unmetabolized as well as metabolized [15O]oxygen. With the use of a single parameter set, the experimental tracer dilution curve as well as the residue curve could be fitted closely by the model. The assumptions were oPScap and oPSpc of 0.4 and 5.0 ml·g−1·min−1, respectively, and wPScap and wPSpc of 7.0 and 0.6 ml·g−1·min−1, respectively. The volumes of distribution for oxygen were set to match the experimental Hct of 19.5% and a cardiomyocyte Mb concentration of 200 μM. Coronary flow measured by outflow collection was 0.8 ml·g−1·min−1. The experimental arterial and venous oxygen concentrations were 78 and 42 mM, respectively. Adjusting the cellular clearance term for oxygen (oGpc), the model fit gave a MRO2 of 1.1 μmol·g−1·min−1. The experimental result (Fick estimate) was 28.8 μl·min−1·g−1 or 1.3 μmol·g−1·min−1. Although these estimates are close enough to encourage examining the model efficacy in detail, the result cannot be used to argue for or against the validity of the model.
Fig. 10.
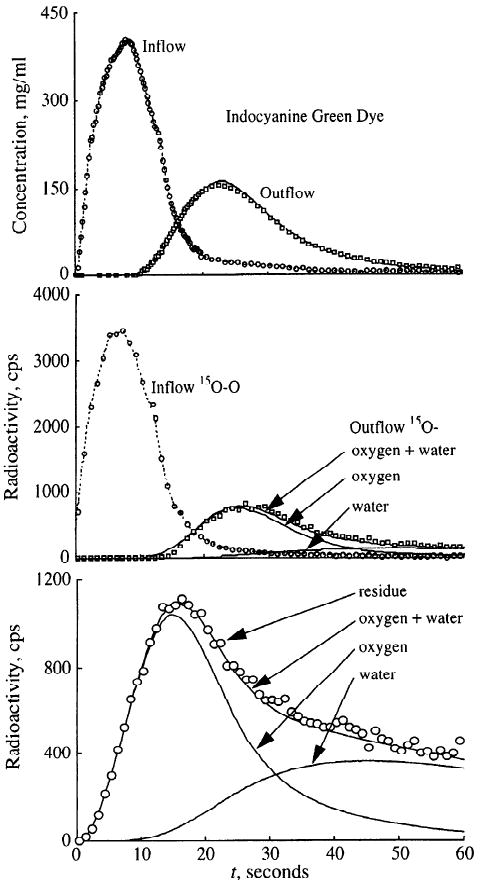
Modeling analysis of 15O curves after [15O]oxygen injection in blood-perfused rabbit heart. Model solutions are fitted to inflow and outflow curves for both indocyanine green dye (top) and 15O-β+-detectors (middle) and the residue function (bottom). Symbols represent measurements, lines denote model solutions.
Discussion
The present model of blood-tissue oxygen exchange and metabolism was preferentially designed to accommodate the analysis of time-concentration curves obtained with modern imaging techniques. The residue function of a tracer may, mathematically, also be expressed as the difference between the tracer input function and the emergence of the tracer; thus, the model allows indicator dilution data to be fitted as well. The simultaneous use of residue and indicator dilution data is expected to increase the precision of the model predictions, because the different data sets are sensitive to different parameters. Indicator dilution data have an extraordinarily high sensitivity for vascular and endothelial processes, whereas parenchymal cell processes dominate the residue function. The combination of residue plus outflow analysis may thus bring mathematical modeling of exchange and metabolic processes to a more advanced level.
The versatile structure of the present model, along with its potential to further the analysis of tissue residue data, permits separate simulations of kinetic processes in the blood-tissue exchange unit (Figs. 5–7), evaluation of blood flow heterogeneity in model predictions (Figs. 8–9), and calculation of axial capillary gradients (along the length of the capillary) (Fig. 8). The model may be used for the analysis of tracer transients (after injection of [15O]oxygen) or for the analysis of steady-state concentrations of labeled oxygen or mother substrate (the naturally occurring [16O]oxygen). In fact, a two-step combination of these applications was used in the present study to derive a value for oxygen consumption in the isolated rabbit heart. After the residue and the indicator dilution data were fitted with an identical parameter set, the MRO2 was calculated by the model from the known steady-state inflow concentration of oxygen with the use of an otherwise identical parameter set. Because of the conservation of mass, the MRO2 for this condition may be derived by the following equivalent expressions
| (19) |
where Fcap is capillary flow, oCin and oCout are the steady-state arterial and venous oxygen concentrations, the oPS is the permeability-surface area product, and oC̄ is the axial average substrate concentration on either side of the membrane. The equation shows that substrate delivery, membrane transport, and consumption are all fluxes in series.
In the model the turnover of oxygen to water is simulated by an intracellular clearance term oGpc, which for a given average cellular concentration determines the actual rate of oxygen metabolism (oGpc × oC̄pc= MRO2). Experimental evidence suggests that below a critical cellular oxygen concentration the turnover rate of oxygen to water is proportional to the cellular oxygen concentration, whereas at higher oxygen concentrations this relationship approaches zero order. To simulate the concentration-proportional MRO2 at low oxygen concentrations, in the present model the G term is held constant. With increasing intracellular oxygen concentrations in the higher range, the zero-order relationship between oxygen concentration and metabolic rate may be simulated by decreasing the G term, thereby keeping the product of the average cellular concentration and cellular clearance, MRO2, constant.
To fit the front end of the outflow dilution data shown in Fig. 10, the capillary PS for oxygen had to be set to a rather small value (0.4 ml·min−1·g−1). Higher PS values tended to flatten the front end of the outflow curve and to increase the delay of the tracer to an extent notably larger than that actually measured. This low PS value is compatible with that estimated by Rose and Goresky (39) on the dog heart in situ. A value of oPSpc on the order of 5 to 20 times oPScap is also in accordance with the calculations done by Wittenberg and Wittenberg (45). Their estimates were based on a capillary surface area of 500 cm2/g and a sarcolemmal surface area of 2,500 cm2/g. Membrane areas are shown in Table 3. Our own calculations show that at the Hct used in the present experiments (20%), the RBC surface area of ∼200 cm2/g may be more limiting than is the capillary membrane. Given the structure of the present three-region model, in which the RBC space is not separately represented, our values for oPScap represent the serial resistances of release from Hb and RBC and capillary membranes. Another possible reason for the low apparent oPScap may be wide plasmatic gaps between RBCs that would be implicated at Hcts of <15% (22), but this probably is of little consequence with Hct = 20%.
Table 3. Membrane areas for transport and metabolism in myocardium.
The best fit of the plateau of the residue curve in Fig. 10 was obtained assuming a parenchymal cell wPSpc for water considerably less than that of the capillary wall. Because of the ratios of the surface areas given above, the low apparent parenchymal cell wPSpc for water cannot be explained by the concept of surface areas. However, intracellular free water will exchange with hydration water of intracellular large molecules. The present model does not account for diffusional processes between dissimilar capillaries or between arterioles and venules. It assumes instantaneous radial intraregional diffusion equilibrium, which is justified because the distances are at most a few microns (4). To account for intracellular diffusion slowing the exchange of water and for the extracellular space, one would have to decrease the wPSpc to values less than the true wPSpc, because it would then be representing two resistances in series. The values for sarcolemmal permeability and for the intracellular diffusion coefficient found by Safford et al. (41) are too high to explain the need for values of wPSpc as low as we found to provide good fits. Therefore these present results remain unreconciled with the results of Safford et al. (41) on superfused septa, but we recognize that the septal preparation might well have abnormally high membrane permeabilities.
The reader will recognize that the model is a linear approximation to reality and does not account for the nonlinearities of binding with Hb and Mb; instead we have used concentration-dependent volumes of distribution in vascular space and in myocytes. Linearization is the standard method of tracer modeling and is normally completely justified. When there is steady state for nontracer, the rate constants for tracer exchange and metabolism are indeed constant: if k is a function of tracer concentration C* and of nontracer concentration C, i.e., k is k(C* + C), then, because C* < 10−12C, k(C* + C) is really equal to k(C) and is uninfluenced by changes in C*. In our experiments, the oxygen levels (oC) are in steady state, so this is the argument for accepting the use of a linear model. To be cautious, we recognize that oC(x) is dependent on position along the capillary even if oC(x) is unchanging during the passage time of tracer. This is a relatively minor source of nonlinearity, which causes only small errors in the estimates of effective PS and G values (<2%). The estimated PS and G values for [15O]oxygen then represent approximately a logarithmic mean of the actual values along the capillary, values which are very close to those that would be estimated from the mean fluxes for permeation to consumption. The desirable feature that this approximation provides is simplicity and computational speed; the disadvantage is that it does not provide for the expectation that the functional or average volume of distribution within a high-flow unit must be higher for oxygen than that within a low-flow unit because of the nonlinear binding on Hb and Mb. If the heterogeneity of regional flows is small, then the error induced by the linearization will be small, because the variation in regional volumes will be small and an average value will represent the distribution of values reasonably well. However, if the range of local flows is broad, then the error will be greater; this means that distributions of regional venous oxygen concentrations will differ a little from that shown in Fig. 9.
To clarify this issue, and to determine the importance of the nonlinearities for the analysis of transient data, we will need to assess the current model against the more definitive model accounting for all the nonlinearities. However, the linear model is an excellent representation of tracer [15O]oxygen kinetics when nontracer 16O2 is in steady state, for the main source of error is that the relative volumes of distribution change along the capillary as capillary Po2 drops. Because this source of error is minor, we should be able to use a linearized model for the routine analysis and to make minor adjustments in the model calculations to account for nonlinearities. If the local oxygen consumption were tightly proportional to the local flow, then the local oxygen concentrations would all have the same average; if this were so the residual error would be attributable to the axial gradients rather than to the flow heterogeneity and variance of local oxygen tensions.
Another source of error is in the assumption that RBCs and plasma have the same velocity when it is clear from experimental data (19) that RBC velocities are higher than plasma velocities. This is actually of little consequence for [15O]oxygen, because almost all of it is in RBCs; although the actual transit time shift is greater for [15O]water because it is more evenly distributed between plasma and RBCs, the shift is of little consequence for water because its intratissue transit time is very large compared with the transit time for vascular indicators.
A third source of error is that the distribution of RBCs along the capillary is inherently assumed to be uniform. Hellums (22), in a beautifully perceptive study, and later Federspiel and coworkers (14, 15) and Groebe and Thews (20) observed that in steady-state modeling there was an influence of RBC spacing along the capillary tissue unit on the efficiency of oxygen transfer from the blood to the tissue. At Hcts >20%, there was no difference between an axially uniformly distributed oxygen source in the Hb-bound pool and a segmented oxygen source with the RBCs evenly spaced along the capillary. However, when the Hct was low, the dissipation of the oxygen gradient in the plasma spaces between RBCs had the effect of reducing the average gradient from plasma to tissue and so appeared as a functional reduction in the rate of permeation of the capillary wall. This problem would be further exacerbated if the RBCs were unevenly spaced, as they are most of the time, but this is partially offset by the axial diffusion of oxygen, accounted for in Eqs. 1–3. Our model assumes complete uniformity of the oxygen source in the RBCs; if working at low Hcts, one would therefore expect to find an apparent oPScap lower than the actual membrane permeability-surface area product.
In analyzing experimental data with such a model one would wish to have as much ancillary data as possible, to minimize the numbers of free parameters. In our experiments with [15O]oxygen we therefore use other indicators to help in defining parameters. Indocyanine green, remaining strictly intravascular because it is bound tightly to plasma albumin, provides a measure of the delay, the dispersion, and the shape of that dispersion through the tubing leading to the isolated organ and the vascular network in the heart itself. Because the tubing volumes have been measured, and the characteristics of the dispersion and delay for blood flowing through tubing is determined separately in experiments without an isolated heart, fitting of the dye curves rather precisely defines the total vascular volume of the heart. Other experiments with both RBC and plasma labels give the relative transit times of the two intravascular components. The use of [15O]water as the injected tracer species gives a control study that defines the total water volume of distribution under the conditions of the experiment, so we use such injections either just before or after the [15O]oxygen injection to capture the information on water transport at a time as close as possible to the oxygen experiment. A third control is to inject 11CO or C15O into the inflow in the identical manner; this gives yet another measure of the vascular space for the oxygen entering the arterial and capillary system, but in addition gives a measure of the Mb space, because the CO binds also to Mb in competition to the Hb binding and the degree of binding is enough to be seen on first-pass extraction as a prolonged tail on the residue curve.
In an experiment in which observations are made on the effluent blood, the ordering of the components of the model (arteries, exchange region, veins) would not matter if the system is linear. In a model in which there is chemical transformation, and one observes residue as well as outflow, it is clearly essential to separate the operators for arteries and veins: the only tracer in the inflow arterial system after [15O]oxygen injection is in the form of oxygen, but the effluent veins contain tracer, mainly in the form of [15O]water, which has a very different time course than does oxygen. So the use of a single operator for both arteries and veins, which works so nicely (e.g., Refs. 7 and 40) for multitracer experiments in which the transformation either does not occur or does not give rise to a great separation between substrate and product species, is not appropriate for either the tracer oxygen or its tracer water formed as a product. The water product is the major contributor to the area of the residue curve (e.g., Fig. 6), and much of the water is in the veins, which contributes several percent to the magnitude of the residue during the tails of the curves.
The modeling effort is encouraged by the single experiment shown: the model parameterization from fitting the data was used as a blinded test to determine the oxygen consumption. The result was that the estimated oxygen consumption, calculated from the model as the product of oGpc times the average oxygen concentration within the parenchymal cells, gave a value that was close to the correct estimate from the standard Fick calculation of the measured arteriovenous difference in oxygen concentrations times the measured flow (see Application of the Model). More data are needed to gather statistics and gain a better perspective with respect to the accuracy. The model and the experiment design illustrated in the study are only the first step. In conclusion, we have presented an oxygen-to-water blood-tissue exchange and transformation model that is useful in understanding oxygen transport and metabolism.
Acknowledgments
The authors greatly appreciate the efforts of James E. Lawson and Gary Raymond in the preparation of the illustrations and Marguerita Jensen in the preparation of the manuscript.
The experimental work has been supported by National Heart, Lung, and Blood Institute Grants HL-38736 and HL-50238 and the model development has been supported by Division of Research Resources Grant RR-1243 supporting the National Simulation Resource Facility for Circulatory Mass Transport and Exchange (Internet: SIMCON@nsr.bioeng.washington.edu). A. Deussen was supported by the Deutsche Forschungsgemeinschaft Grants De360/3–l and De360/4–l.
Appendix
Diffusion in a Cell Suspension
The most complete expression available for describing diffusion through cells suspended in a surrounding medium and allowing for permeation into the cell as well as intracellular and extracellular diffusion is that provided by Safford et al. (41). The calculation is for one-dimensional diffusion via two paths continuously connected: one path is via medium only and the other is through cells and medium alternately. The cell-to-cell spacing L0 is the same laterally as axially, and is determined by the cell size L and the Hct such that .
The overall bulk diffusion coefficient, Db, used with the concentration of unbound [15O]oxygen as the driving force, is calculated from the intracellular, Di, and extracellular, De, diffusion coefficients and the cell membrane permeability, P
| (A1) |
where
When De = DO2pl, 2.18 × 10⁻⁵ cm2/s, and Di = oD̄RBC · oCRBC/oCRBC from Eq. 15, 5.65 × 15−5 cm2/s, L is 5 μm, Hct = 0.2, P = 0.01 cm/s, giving L0 = 5.56 μm and Db = 1.67 × 10⁻⁵ cm2/s. (When there is no gradient in Po2 across the membrane oCRBC = oCp.)
The two extreme cases occur with the cell permeability P at zero and infinity
| (A2) |
and
| (A3) |
with other values being the same, Db(P = 0) is 1.6 × 10⁻⁵ cm2/s, and Db (P = ∞) is 2.68 × 10⁻⁵ cm2/s.
This computation improves on the formula given by Redwood et al. (37) because it accounts for exchange across the whole surface of the RBC instead of only the part of the surface perpendicular to the diffusion front.
References
- 1.Arai T, Mori T, Nakao S, Watanabe K, Kito K, Aoki M, Mori H, Morikawa S, Inubushi T. In vivo oxygen-17 nuclear magnetic resonance for the estimation of cerebral blood flow and oxygen comsumption. Biochem Biophys Res Commun. 1991;179:954–961. doi: 10.1016/0006-291x(91)91911-u. [DOI] [PubMed] [Google Scholar]
- 2.Bassingthwaighte JB. Plasma indicator dispersion in arteries of the human leg. Circ Res. 1966;19:332–346. doi: 10.1161/01.res.19.2.332. [DOI] [PMC free article] [PubMed] [Google Scholar]
- 3.Bassingthwaighte JB, Chan IS, Wang CY. Computationally efficient algorithms for capillary convection-permeation-diffusion models for blood-tissue exchange. Ann Biomed Eng. 1992;20:687–725. doi: 10.1007/BF02368613. [DOI] [PubMed] [Google Scholar]
- 4.Bassingthwaighte JB, Goresky CA. Handbook of Physiology The Cardiovascular System Microcirculation. IV. Bethesda, MD: Am. Physiol. Soc.; 1984. Modeling in the analysis of solute and water exchange in the microvasculature; pp. 549–626. sect. 2. chapt. 13. [Google Scholar]
- 5.Bassingthwaighte JB, King RB, Roger SA. Fractal nature of regional myocardial blood flow heterogeneity. Circ Res. 1989;65:578–590. doi: 10.1161/01.res.65.3.578. [DOI] [PMC free article] [PubMed] [Google Scholar]
- 6.Bassingthwaighte JB, Malone MA, Moffett TC, King RB, Chan IS, Link JM, Krohn KA. Molecular and particulate depositions for regional myocardial flows in sheep. Circ Res. 1990;66:1328–1344. doi: 10.1161/01.res.66.5.1328. [DOI] [PMC free article] [PubMed] [Google Scholar]
- 7.Bassingthwaighte JB, Wang CY, Chan IS. Blood-tissue exchange via transport and transformation by endothelial cells. Circ Res. 1989;65:997–1020. doi: 10.1161/01.res.65.4.997. [DOI] [PMC free article] [PubMed] [Google Scholar]
- 8.Bassingthwaighte JB, Yipintsoi T, Harvey RB. Microvasculature of the dog left ventricular myocardium. Microvasc Res. 1974;7:229–249. doi: 10.1016/0026-2862(74)90008-9. [DOI] [PMC free article] [PubMed] [Google Scholar]
- 9.Chan IS, Goldstein AA, Bassingthwaighte JB. SENSOP: A derivative-free solver for non-linear least squares with sensitivity scaling. Ann Biomed Eng. 1993;21:621–631. doi: 10.1007/BF02368642. [DOI] [PMC free article] [PubMed] [Google Scholar]
- 10.Clark A, Jr, Federspiel WJ, Clark PAA, Cokelet GR. Oxygen delivery from red cells. Biophys J. 1985;47:171–181. doi: 10.1016/s0006-3495(85)83890-x. [DOI] [PMC free article] [PubMed] [Google Scholar]
- 11.Committee on Medical and Biological Effects of Environmental Pollutants. Carbon Monoxide. Washington, DC: Natl. Acad. Sci. USA; 1977. p. 239. [Google Scholar]
- 12.De Koning L, Hoofd JC, Kreuzer F. Oxygen transport and the function of myoglobin. Theoretical model and experiments in chicken gizzard smooth muscle. Pfluegers Arch. 1981;389:211–217. doi: 10.1007/BF00584781. [DOI] [PubMed] [Google Scholar]
- 13.Döring HJ, Kammermeier H. Aenderungen des Herz-durchmessers unter dem Einfluss von Sauerstoffmangel, Stoffwechsel-Inhibitoren und erregungshemmenden Substanzen. In: Fleckenstein A, editor. 4 Freiburger Kolloquium, Kreislaufmessungen. Munich, Germany: E. Banaschewski; 1964. pp. 45–56. [Google Scholar]
- 14.Federspiel WJ, Popel AS. A theoretical analysis of the effect of the particulate nature of blood on oxygen release in capillaries. Microvasc Res. 1986;32:164–189. doi: 10.1016/0026-2862(86)90052-x. [DOI] [PMC free article] [PubMed] [Google Scholar]
- 15.Federspiel WJ, Sarelius IH. An examination of the contribution of red cell spacing to the uniformity of oxygen flux at the capillary wall. Microvasc Res. 1984;27:273–285. doi: 10.1016/0026-2862(84)90059-1. [DOI] [PubMed] [Google Scholar]
- 16.Frackowiak RSJ, Lenzi GL, Jones T, Heather JD. Quantitative measurement of regional cerebral blood flow and oxygen metabolism in man using 15O and positron emission tomography: theory, procedure and normal values. J Comput Assisted Tomogr. 1980;4:727–736. doi: 10.1097/00004728-198012000-00001. [DOI] [PubMed] [Google Scholar]
- 17.Goldstick TK, Ciuryla VT, Zuckerman L. Diffusion of oxygen in plasma and blood. Adv Exp Med Biol. 1976;75:183–190. doi: 10.1007/978-1-4684-3273-2_23. [DOI] [PubMed] [Google Scholar]
- 18.Gonzalez F, Bassingthwaighte JB. Heterogeneities in regional volumes of distribution and flows in the rabbit heart. Am J Physiol. 1990;258(Heart Circ. Physiol. 27):H1012–H1024. doi: 10.1152/ajpheart.1990.258.4.H1012. [DOI] [PMC free article] [PubMed] [Google Scholar]
- 19.Goresky CA. A linear method for determining liver sinusoidal and extravascular volumes. Am J Physiol. 1963;204:626–640. doi: 10.1152/ajplegacy.1963.204.4.626. [DOI] [PubMed] [Google Scholar]
- 20.Groebe K, Thews G. Effects of red cell spacing and red cell movement upon oxygen release under conditions of maximally working skeletal muscle. In: Rakusan K, Biro GP, Goldstick TK, Turek Z, editors. Oxygen Transport to Tissue. 11th. New York: Plenum Press; 1989. pp. 175–185. [DOI] [PubMed] [Google Scholar]
- 21.Guller B, Yipintsoi T, Orvis AL, Bassingthwaighte JB. Myocardial sodium extraction at varied coronary flows in the dog: estimation of capillary permeability by residue and outflow detection. Circ Res. 1975;37:359–378. doi: 10.1161/01.res.37.3.359. [DOI] [PMC free article] [PubMed] [Google Scholar]
- 22.Hellums JD. The resistance to oxygen transport in the capillaries relative to that in the surrounding tissue. Microvasc Res. 1977;13:131–136. doi: 10.1016/0026-2862(77)90122-4. [DOI] [PubMed] [Google Scholar]
- 23.Heusch G, Deussen A. The effects of cardiac sympathetic nerve stimulation on perfusion of stenotic coronary arteries in the dog. Circ Res. 1983;53:8–15. doi: 10.1161/01.res.53.1.8. [DOI] [PubMed] [Google Scholar]
- 24.Homer LD, Shelton JB, Dorsey CH, Williams TJ. Anisotropic diffusion of oxygen in slices of rat muscle. Am J Physiol. 1984;246(Regulatory Integrative Comp. Physiol. 15):R107–R113. doi: 10.1152/ajpregu.1984.246.1.R107. [DOI] [PubMed] [Google Scholar]
- 25.Iida H, Kanno I, Takahashi A, Miura S, Murakami M, Takahashi K, Ono Y, Shishido F, Inugami A, Tomura N, Higano S, Fujita H, Sasaki H, Nakamichi H, Mizusawa S, Kondo Y, Uemura K. Measurement of absolute myocardial blood flow with H215O and dynamic positron-emission tomography: strategy for quantification in relation to the partial-volume effect. Circulation. 1988;78:104–115. doi: 10.1161/01.cir.78.1.104. [DOI] [PubMed] [Google Scholar]
- 26.King RB, Bassingthwaighte JB, Hales JRS, Rowell LB. Stability of heterogeneity of myocardial blood flow in normal awake baboons. Circ Res. 1985;57:285–295. doi: 10.1161/01.res.57.2.285. [DOI] [PMC free article] [PubMed] [Google Scholar]
- 27.King RB, Deussen A, Raymond GR, Bassingthwaighte JB. A vascular transport operator. Am J Physiol. 1993;265(Heart Circ. Physiol. 34):H2196–H2208. doi: 10.1152/ajpheart.1993.265.6.H2196. [DOI] [PMC free article] [PubMed] [Google Scholar]
- 28.Kuikka J, Levin M, Bassingthwaighte JB. Multiple tracer dilution estimates of d- and 2-deoxy-d-glucose uptake by the heart. Am J Physiol. 1986;250(Heart Circ. Physiol. 19):H29–H42. doi: 10.1152/ajpheart.1986.250.1.H29. [DOI] [PMC free article] [PubMed] [Google Scholar]
- 29.Lammertsma AA, Jones T, Frackowiak RSJ, Lenzi GL. A theoretical study of the steady-state model for measuring regional cerebral blood flow and oxygen utilisation using oxygen-15. J Comput Assisted Tomogr. 1981;5:544–550. doi: 10.1097/00004728-198108000-00016. [DOI] [PubMed] [Google Scholar]
- 30.Lerch RA, Ambos HD, Bergmann SR, Sobel BE, Ter-Pogossian MM. Kinetics of positron emitters in vivo characterized with a beta probe. Am J Physiol. 1982;242(Heart Circ. Physiol. 11):H62–H67. doi: 10.1152/ajpheart.1982.242.1.H62. [DOI] [PubMed] [Google Scholar]
- 31.Meyer E, Tyler JL, Thompson CJ, Redies C, Diksic M, Hakim AM. Estimation of cerebral oxygen utilization rate by single-bolus 15O2 inhalation and dynamic positron emission tomography. J Cereb Blood Flow Metab. 1987;7:403–414. doi: 10.1038/jcbfm.1987.83. [DOI] [PubMed] [Google Scholar]
- 32.Napper SA, Schubert RW. Mathematical evidence for flow-induced changes in myocardial oxygen consumption. Ann Biomed Eng. 1988;16:349–365. doi: 10.1007/BF02364623. [DOI] [PubMed] [Google Scholar]
- 33.Page E, McCallister LP. Quantitative electron microscopic description of heart muscle cells. Am J Cardiol. 1973;31:172–181. doi: 10.1016/0002-9149(73)91030-8. [DOI] [PubMed] [Google Scholar]
- 34.Page E, McCallister LP, Power B. Stereological measurements of cardiac ultrastructures implicated in excitation-contraction coupling. Proc Natl Acad Sci USA. 1971;68:1465–1466. doi: 10.1073/pnas.68.7.1465. [DOI] [PMC free article] [PubMed] [Google Scholar]
- 35.Popel AS. Theory of oxygen transport to tissue. Crit Rev Biomed Eng. 1989;17:257–321. [PMC free article] [PubMed] [Google Scholar]
- 36.Randle PJ, Tubbs PK. Handbook of Physiology The Cardiovascular System The Heart. I. Bethesda, MD: Am. Physiol. Soc.; 1979. Carbohydrate and fatty acid metabolism; pp. 805–844. sect. 2. chapt. 23. [Google Scholar]
- 37.Redwood WR, Rall E, Perl W. Red cell membrane permeability deduced from bulk diffusion coefficients. J Gen Physiol. 1974;64:706–729. doi: 10.1085/jgp.64.6.706. [DOI] [PMC free article] [PubMed] [Google Scholar]
- 38.Riveros-Moreno V, Wittenberg JB. The self-diffusion coefficients of myoglobin and hemoglobin in concentrated solutions. J Biol Chem. 1972;247:895–901. [PubMed] [Google Scholar]
- 39.Rose CP, Goresky CA. Limitations of tracer oxygen uptake in the canine coronary circulation. Circ Res. 1985;56:57–71. doi: 10.1161/01.res.56.1.57. [DOI] [PubMed] [Google Scholar]
- 40.Rose CP, Goresky CA, Bach GG. The capillary and sarcolemmal barriers in the heart: an exploration of labeled water permeability. Circ Res. 1977;41:515–533. doi: 10.1161/01.res.41.4.515. [DOI] [PubMed] [Google Scholar]
- 41.Safford RE, Bassingthwaighte EA, Bassingthwaighte JB. Diffusion of water in cat ventricular myocardium. J Gen Physiol. 1978;72:513–538. doi: 10.1085/jgp.72.4.513. [DOI] [PMC free article] [PubMed] [Google Scholar]
- 42.Taegtmeyer H. Carbohydrate interconversions and energy production. Circulation. 1985;72 IV:1–8. [PubMed] [Google Scholar]
- 43.Weinberg IN, Huang SC, Hoffman EJ, Araujo L, Nienaber C, Grover-McKay M, Dahlbom M, Schelbert H. Validation of PET-acquired input functions for cardiac studies. J Nucl Med. 1988;29:241–247. [PubMed] [Google Scholar]
- 44.Wiesner RJ, Deussen A, Borst M, Schrader J, Grieshaber MK. Glutamate degradation in the ischemic dog heart: contribution to anaerobic energy production. J Mol Cell Cardiol. 1989;21:49–59. doi: 10.1016/0022-2828(89)91492-2. [DOI] [PubMed] [Google Scholar]
- 45.Wittenberg BA, Wittenberg JB. Transport of oxygen in muscle. Annu Rev Physiol. 1989;51:857–878. doi: 10.1146/annurev.ph.51.030189.004233. [DOI] [PubMed] [Google Scholar]
- 46.Yipintsoi T, Scanlon PD, Bassingthwaighte JB. Density and water content of dog ventricular myocardium. Proc Soc Exp Biol Med. 1972;141:1032–1035. doi: 10.3181/00379727-141-36927. [DOI] [PMC free article] [PubMed] [Google Scholar]
- 47.Zierler KL. A critique of compartmental analysis. Annu Rev Biophys Bioeng. 1981;10:531–562. doi: 10.1146/annurev.bb.10.060181.002531. [DOI] [PubMed] [Google Scholar]