In certain forms of heart disease when the diagnosis is readily apparent from clinical examination, it would be desirable to assess the degree of hemodynamic abnormality by the simplest method. If electrocardiographic data could provide a sufficiently accurate indication of altered function, the need for cardiac catheterization might be obviated. However, detailed electrocardiographic criteria1, 2 do not appear to correlate with the weight of the ventricle or the thickness of the ventricular wall.3 A more definitive result might be obtained from correlations of the electrocardiographic details with function, as attempted by Cosby and co-workers,4 rather than with anatomic structure. For this functional approach, Cabrera and Monroy5 disseminated the concepts of the systolic and the diastolic overloading of the ventricle. Statistical support for these ideas is not yet available even though modified views have been presented.6
Studies of correlation between the severity of pulmonary stenosis and electrocardiographic evidence of right ventricular hypertrophy7–11 disclose a wide variability. From a functional view, the simplicity of the abnormality makes pulmonary stenosis an ideal disease to study; there is solely a systolic or pressure overload of the right ventricle. In order to overcome obstruction to outflow through the pulmonary valve, the right ventricular systolic contraction takes a longer time and becomes more powerful. Recent investigators12, 13 have compared the peak right ventricular systolic pressure with various aspects of the electrocardiogram. But as Haywood, Selvester, and Griggs14 realized, pressure data alone are insufficient to assess hemodynamic function; flow must also be considered. For example, to double the flow rate through an orifice, the pressure gradient must be quadrupled if there is no change in resistance to flow due to altered turbulence. The purpose of this study is to determine the relationships between the electrocardiographic data and hydraulic data that consider the effect of blood flow.
Methods
Of the 53 patients studied (table 1), 22 were children, between the ages of 5 and 15 years. Cardiac catheterization data15 were complete in all 53 cases, and there was no evidence of intracardiac shunt (by dye-dilution curve or blood oxygen-saturation data), left heart disease, or cardiac failure. Cardiac outputs were calculated from the oxygen uptake and the arteriovenous differences in oxygen content. From these determinations and from the recorded pressure data, the right ventricular work index,16 the pulmonary valve resistance, and the pulmonary valve area17 were calculated. The formula used were:
Table 1.
Age and Sex of Patients with Pulmonary Stenosis and Intact Ventricular Septum
| Sex | Age, years |
Total | |||
|---|---|---|---|---|---|
| 5–15 | 16–25 | 26–35 | 36–58 | ||
| Male | 10 | 6 | 2 | 2 | 20 |
| Female | 12 | 10 | 8 | 3 | 33 |
| Total | 22 | 16 | 10 | 5 | 53 |
Right ventricular work index = RVWI (Kg. M./min./M.2).
C.O. = cardiac output (L./min.)
RVsm = right ventricular mean pressure during systole (mm. Hg)
RAm = right atrial mean pressure (mm. Hg)
Body surface area (M.2) was calculated from the formula of Dubois and Dubois.18
Pulmonary valve resistance = PVR (dynes sec. cm.−5).
PAsm = pulmonary artery mean pressure during systole (mm. Hg)
Pulmonary valve area = PVA (cm.2)
Systolic ejection period (sec./min.)
Each formula contains certain approximations and, thus, has its weakness. The formula for right ventricular work index does not take into account the kinetic energy of the blood, which is ordinarily small. In determination of pulmonary valve resistance, no allowance was made for the fact that flow occurs only during systole; thus resistance was overestimated. Such treatment cannot be justified hydraulically; however, this is the conventional simplification and results in a formula which can be readily applied. The systematic errors introduced will be proportional to the severity of the hydraulic abnormality and do not vitiate the comparability of results on different patients. The formula for pulmonary valve area is applicable to a circular orifice through a thin flat plate, which is probably significantly different from a stenosed right ventricular outflow tract, but may not be too different from a stenosed valve. When the catheter tip was through the pulmonary valve, the effective area of the valve was reduced by the cross-sectional area of the catheter. This small reduction (3 to 4 mm.2) of area has been ignored in our calculations.
The systolic mean pressures in the right ventricle and the pulmonary artery were estimated by dividing the area (obtained by planimetry) beneath the pressure tracing by the duration of systole. In some cases a visual estimate was used.* Whichever method was used, an average of the values was obtained for 6 to 8 beats. Because movement of the catheter produced an artifact in the pulmonary artery pressure tracing, the systolic duration and timing used in estimating the systolic mean pressures were those found for the right ventricle. The electrocardiographic tracing was used as the time reference.
Electrocardiographic data were determined from the three standard and three unipolar extremity leads and the usual six precordial leads, V1 to V6. In 11 cases, only the three standard leads and the precordial leads V1, V3, and V6 were available. All results were recorded by means of photographic recording electrocardiographs at a paper speed of 25 mm. per second. Measurements of positive voltages were made from the top of the baseline to the zenith of the positive waves, negative voltages from the bottom of the baseline to the nadir of the pertinent wave. Amplitudes and durations of intervals were measured with the aid of a magnifying lens. The convention was adopted that the waves of the QRS complex would be denoted by capital letters if the amplitude was greater than 4 mm. and in small letters if less than 4 mm. In all instances, the standardization was 1 mv. as represented by 10 mm.
Values for the mean QRS axis (ÂQRS) and the mean T-wave axis (ÂT) were obtained in the following manner. The net areas (area above baseline minus area below baseline) subtended by the complex in each lead were estimated visually. In the frontal plane, the axes were estimated from the relative areas by reference to the hexaxial lead system (lead I axis = 0°), and in the horizontal plane by reference to an axial system based on the assumption that the angle between each lead V axis equals 22½° (lead V6 axis = 0°, lead V2 axis = +90°).
From the hemodynamic measurements, the patients have been grouped according to severity of the disorder. Each of the four calculations (gradient, work index, resistance, area) was given equal weight in defining whether a patient had mild, moderate, or severe stenosis (table 2). For all patients, except one, at least three of the four variables indicated the same diagnostic category. The one exception had two of the variables well within the range of moderate stenosis and two at the upper limit of the values for mild stenosis. The patient was placed within the group defined as having moderate stenosis. The arbitrary division between the groups according to the data of table 2 is from a point of function more realistic than a division on the basis of right ventricular peak pressures alone. Of the 53 patients, 31 were defined as having mild stenosis, 12 moderate, and 10 severe.
Table 2.
Hemodynamic Data of Patients with Pulmonary Stenosis
| Severity of stenosis | Patients | Peak gradient (mm. Hg) | Right ventricular work index (Kg. M./min./M.2) | Pulmonary valve |
|
|---|---|---|---|---|---|
| Resistance (dynes sec. cm.−5) | Area (cm.2) | ||||
| Mild | 31 | < 50 | <2.2 | <600 | >0.66 |
| Moderate | 12 | 50–100 | 2.2–3.7 | 600–1200 | 0.66–0.50 |
| Severe | 10 | 100–200 | 3.7–8.2 | 1200–4000 | <0.50 |
Results
Hemodynamic Data
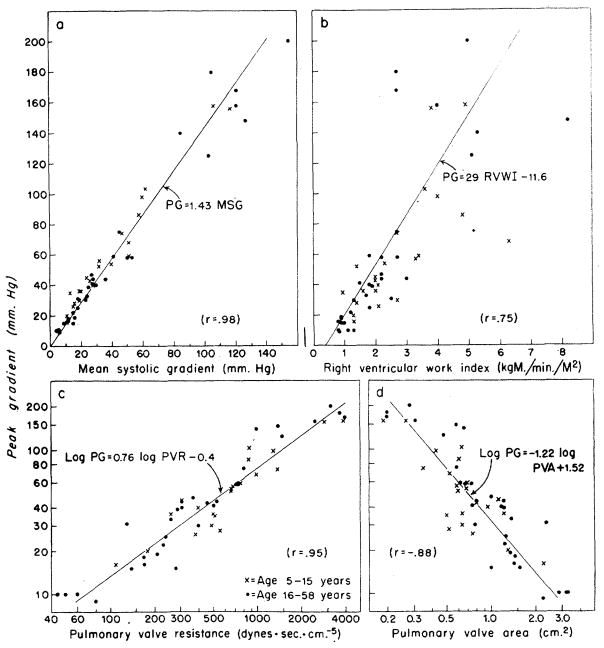
In figure 1, the value of peak systolic gradient across the valve is compared to the other data pertaining to right ventricular hydraulics. The mean systolic gradient was about 70 per cent of the peak gradient across the valve, with little scatter in the relationship (r = .98). The peak pressure gradient correlated less with pulmonary valve resistance (r = .95), and pulmonary valve area (r = −.88), and least with the right ventricular work index (r = .75). From these data the patients have been grouped according to severity of stenosis of the pulmonary valve.
Figure 1.
Correlation of peak gradient (PG) across the pulmonary valve with other hemodynamic data from patients with pulmonary stenosis and an intact ventricular septum. The correlation coefficient (r) and the equation for the linear regression line representing the relationship between any two variables are given in each panel, each variable being represented by the first letters of its name, such as, MSG for mean systolic gradient.
Electrocardiographic and Hemodynamic Comparisons
QRS Voltage
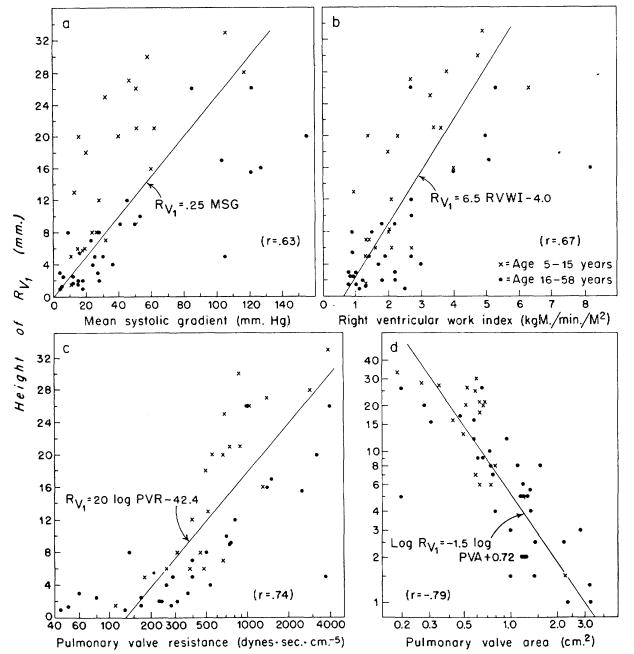
The amplitude of the R wave in lead V1 (Rv1) was plotted against the hemodynamic data (fig. 2). Correlation between the height and the mean pressure gradient is poorest (r = .63). From figure 1a, it is evident that a similar correlation would result if the peak gradient, rather than the mean systolic gradient, were used in the comparisons of figure 2. Somewhat better correlations are evident with right ventricular work index (r = .67), pulmonary valve resistance (r = .74), and pulmonary valve area (r = −.79). The children had higher voltage complexes than adults with the same pressure gradient (fig. 2a), but this disparity was lessened by utilizing flow data (fig. 2b, c, and d). Twenty-seven of 31 patients with mild stenosis had Rv1 of less than 8 mm. and eight of 10 with severe stenosis had Rv1 greater than 16 mm.
Figure 2.
Correlation of the height of the R wave in lead V1(Rv1) with hemodynamic data in 53 patients with pulmonary stenosis. The correlation coefficients (r) and the equation for the linear regression line representing the relationship between any two variables are given in each panel, each variable being represented by the first letters of its name, such as, RVWI for right ventricular work index. a. The correlation between Rv1 and the mean pressure gradient across the valve is rather poor (r = .63), and the children exhibit higher voltage complexes than adults with the same gradient. b, c, and d. Somewhat better correlations are obtained with the other hemodynamic variables, and here there appears to be no significant disparity between adults and children.
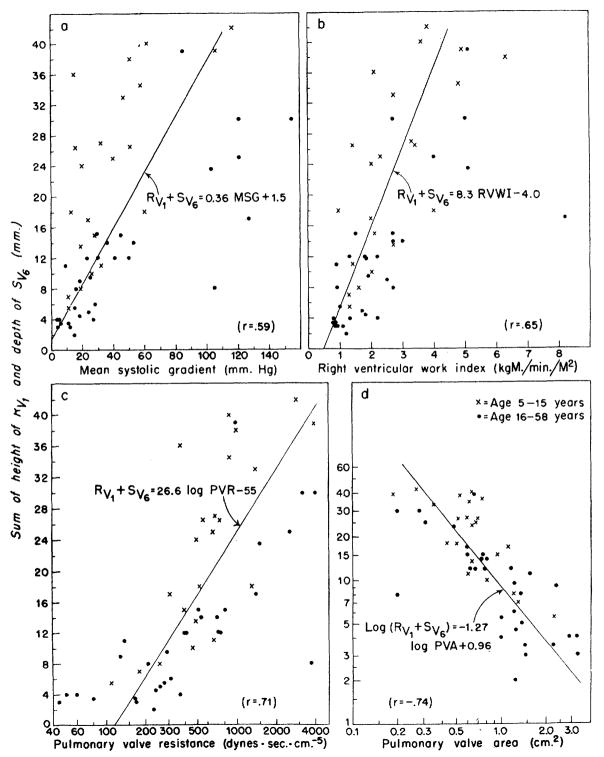
In figure 3, the sum of Rv1 plus Sv6 is plotted against the hemodynamic values. The relationships are similar to those using Rv1 alone (fig. 2), and it is interesting that the added electrocardiographic information given by the depth of the Sv6 (sometimes considered a reflection of Rv1) did not improve the correlation. That is, from the sum of Rv1 + Sv6 the reliability of estimates of the severity of pulmonary stenosis would not be expected to be improved over that estimated from Rv1 alone (note correlation coefficients). In 26 of 31 patients with mild stenosis, the value for Rv1+ Sv6 was less than 15 mm., and, in seven of 10 patients with severe stenosis, it was greater than 23 mm.
Figure 3.
Correlation of the sum of height of the R wave from lead V1(Rv1) and the depth of the S wave from lead V6(Sv6) with hemodynamic data. The relationships are similar to those with Rv1 alone (fig. 2), and the additional information given by Sv6 did not significantly improve the correlations obtained. As in figure 2, RVWI, PVR, and PVA provided better correlation with the electrocardiographic data than did the pressure gradient across the valve.
Mean Manifest QRS and T-Wave Axes
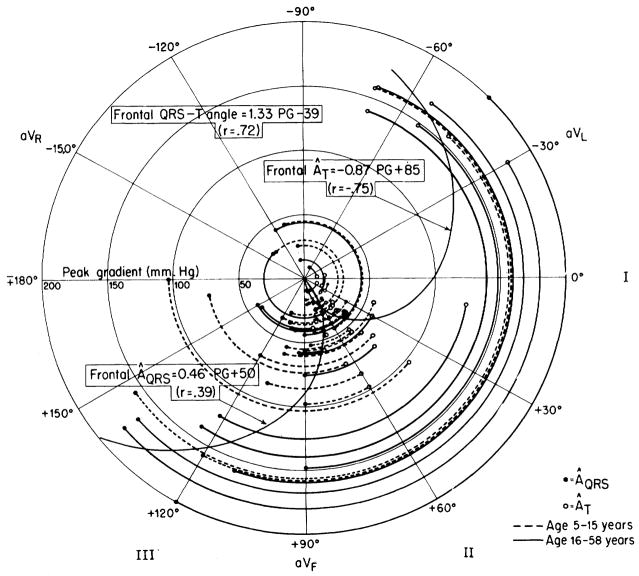
Another electrocardiographic measure that is frequently used in the estimation of right ventricular hypertrophy is the degree of rightward deviation of the mean QRS axis in the frontal plane. In figure 4, the mean manifest QRS axis (ÂQRS) of each patient in the frontal plane was plotted on polar coordinates, and peak pressure gradient (PG) across the pulmonary valve was represented by distance from the center of the circle. As expected, the ÂQRS was deviated clockwise from its normal position when the pressure gradient was higher. The mean T-wave axes (ÂT) in the frontal plane deviated in the opposite direction to an even greater degree when the pressure gradients were high, and the correlation between PG and ÂT, was good (r = −.75).
Figure 4.
Relationship of peak pressure gradient (PG) across the pulmonary valve with the mean QRS axis (ÂQRS) and mean T-wave axis (ÂT) in the frontal plane. For each patient, the arc joining the ÂQRS (closed circles) to the ÂT (open circles) subtends, at the origin, the QRS-T angle. The radius of the arc indicates the peak pressure difference (PG) across the valve. With high PG, the ÂQRS shows right axis deviation (clockwise rotation) and the ÂT shows left axis deviation (counterclockwise rotation). Correlation of PG with ÂT (r = −.75) is about the same as that of PG with the QRS-T angle in the frontal plane (r = .72) and is much better than that of PG with ÂQRS (r = .39).
The angle between the ÂQRS and the ÂT in the frontal plane is the frontal mean QRS-T angle. The correlation between the peak pressure gradient and this angle is also reasonably good (r = .72). For the groups having mild, moderate, and severe stenosis the average of the mean QRS-T angles were 5°, 77°, and 169°, respectively. In 25 of the 31 cases of mild stenosis the angles were less than 50°, and in all cases of severe stenosis the angles were greater than 110°. These axial shifts are similar to those noted by many others. 19, 20
Correlations of the ÂQRS, the ÂT and the QRS-T angle of the frontal plane with the pulmonary valve area were not so good (r = .−.32, .49, and −.52, respectively) as those with peak gradient (r = .39, −.75, and .72, respectively).
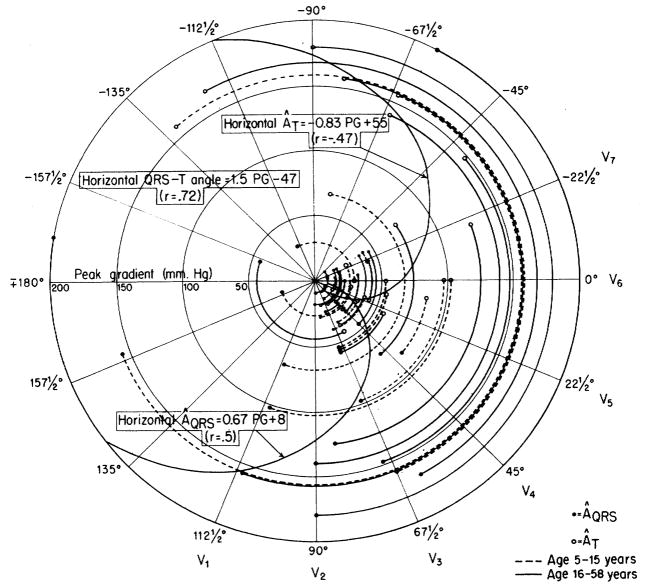
Similarly, the data shown in figure 5 indicate that the ÂQRS and the ÂT of the horizontal plane (precordial leads) deviated to the right and left, respectively, as the peak gradient increased. In this plane the peak gradient value correlated no better with the ÂT than with the ÂQRS. The data are from 40 patients, since the QRS axes of 13 patients were indeterminate in this plane. The averages of the mean QRS-T angles for the three groups were 5°, 67°, and 175°, respectively. In 24 of the 31 cases of mild stenosis the horizontal QRS-T angle was less than 50°, and in all cases of severe stenosis the angles were greater than 100°.
Figure 5.
Relationship of peak pressure gradient (PG) across the pulmonary valve with the mean QRS axis (ÂQRS) and mean T-wave axis (ÂT) in the horizontal plane. The data from 40 patients are presented in the same manner as for the frontal plane in figure 4. With high transvalvular pressure differences, the ÂQRS is rotated clockwise from the normal position (right axis deviation) and the ÂT is rotated counterclockwise. Correlation of PG with QRS-T angle in horixontal plane (r = .72) is in agreement with the correlation of PG and QRS-T angle in the frontal plane (r = .72) (fig. 4) and is much better than that of PG with either ÂQRS or ÂT.
Correlations of the ÂQRS, ÂT, and the QRS-T angle of the horizontal plane with the pulmonary valve area were not significantly higher (r = −.47, .71, and −.64, respectively) than those with the peak gradient (r = .50, −.47, and .72, respectively).
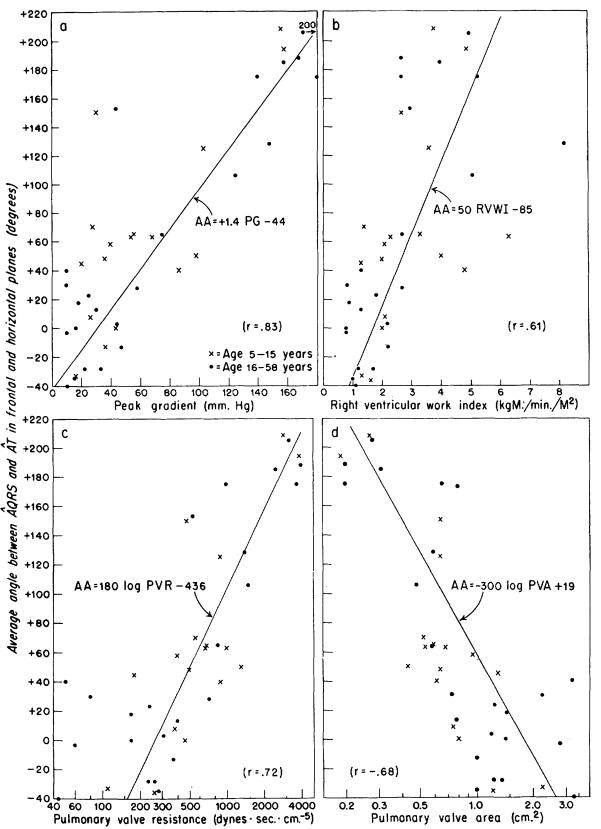
The arithmetic mean of the QRS-T angles in the frontal and horizontal planes for each patient was called the average QRS-T angle. In figure 6, the value of this average angle was plotted against the hemodynamic calculations for those 40 patients in whom the QRS-T angle was obtainable in both planes. Correlation coefficient of this average angle with the peak gradient was .83, and −.68 with the pulmonary valve area and .72 with the pulmonary valve resistance. There was no significant disparity between adults and children in any of the data concerning the ÂQRS and ÂT.
Figure 6.
a to d. Correlation of the average angle (AA) between ÂQRS and ÂT in the frontal and horizontal planes with the hemodynamic data in 40 patients with pulmonary stenosis. The average QRS-T angle was calculated by averaging the QRS-T angles observed in the horizontal and frontal planes for each patient. The angle was called “positive” when the ÂQRS was clockwise from ÂT. The average QRS-T angle correlated better with peak gradient than with work inidex, resistance, or area. a. By the use of the equation, PG = (AA + 44)/1.4, approximate estimations of the gradient across the valve could be made from the electrocardiographic data of patients with pulmonary stenosis.
The duration of the QRS complex, the time of onset of the intrinsicoid deflection (the time from the beginning of the complex wave to the peak of the R wave, or of the R′, if present, in lead V1) and the height of the R wave in aVR were all unrelated to the several aspects of the hemodynamic severity of the stenosis. High-peaked P waves (>3 mm.) occurred in five of the 10 patients with severe stenosis, in three of 12 with moderate, and in two of 31 with mild stenosis.
Electrocardiographic Patterns in Lead V1
Representative tracings of the QRS complexes in lead V1 can be found in figure 7. Group 1 contained those with an Rv1 less than 8 mm. in height, on the basis that 8 mm. could be considered the upper limit of normal. Sokolow and Lyon2 suggested 7 mm. as this limit. Ziegler21 showed that the height of the R wave decreased with age in normal persons; in 27 per cent of normal children aged 5 to 8 years, in 20 per cent of those aged 8 to 12, and in 11 per cent of those aged 12 to 16, the height of the R wave in lead V1 was greater than 7 mm. The data of figure 2 indicate that height of 8 mm. is approximately equivalent to a mean systolic gradient of 32 mm. Hg, a work index of 1.9 Kg. M./min./M.2, a pulmonary valve resistance of 320 dynes. sec. cm.−5 or a pulmonary valve area of 0.72 cm.2 —all these values are within the range that defines mild stenosis of the pulmonary valve. Twenty-seven of the 28 within this group had mild stenosis as defined by the hydraulic criteria.
Figure 7.
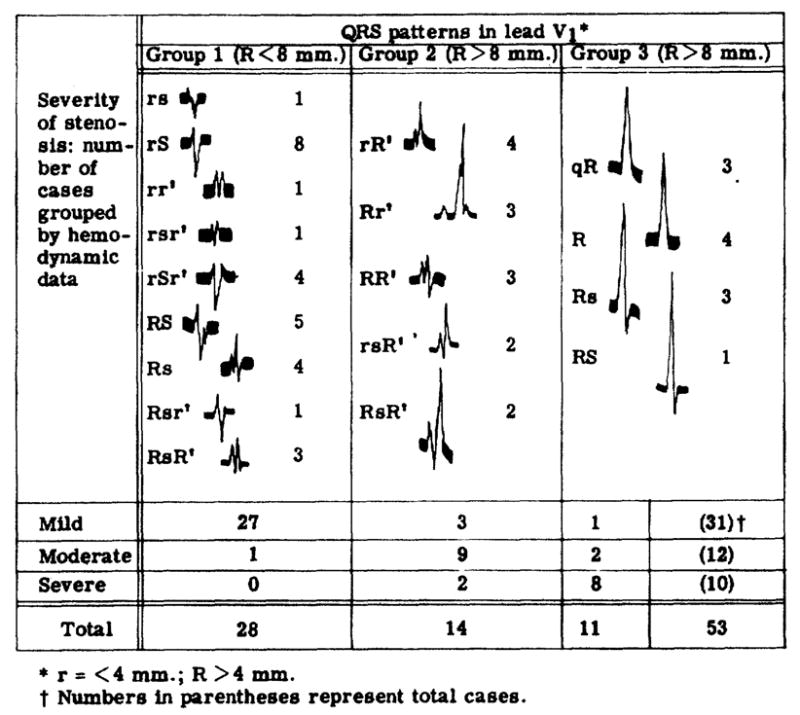
Hemodynamics related to electrocardiographic data.
Among the patients exhibiting a high Rv1, those with a double positive deflection (group 2) were found to have hemodynamically less severe stenosis than those with a single positive deflection (group 3). Seven of the eight patients of group 3 who had severe stenosis also had inverted T waves in lead V1. These findings are in accordance with the concept of Cabrera and Monroy5 that systolic or pressure overload of the right ventricle is indicated by high voltage R waves and inverted T waves over the right precordium.
Many of the QRS patterns in lead V1 of patients with mild and moderate stenosis, however, were the type of patterns that Cabrera and Monroy originally considered evidence of “diastolic overloading of the right venitricle,” although all the patients in this study had “systolic overloading” only. In 22 of the 43 patients whose hydraulic abnormality was mild or moderate, the QRS patterns of lead V1 were double positive deflections, in nine more they showed notched R or S waves and, in an additional four, distinct slurring of the R or S wave. In group 1 (fig. 7), slurring or notching was seen in the S wave of five of the eight rS patterns, four of the five RS patterns, and all four of the Rs patterns.
Discussion
Hemodynamic Data
Vogelpoel and Schrire22 showed that the peak intensity of the murmur of pulmonary stenosis occurred considerably later in patients with severe stenosis than in those with mild stenosis. This observation is evidence that the gradient across the valve reached its peakvalues later in severe than it did in mild stenosis and that the shape of the pressure curves changed. Grosse-Brockhoff and Loogen19 stated that RV peak pressure was reached later when the stenosis was severe and that the inverted U shape of the right ventricular pressure curve became an inverted V shape as the severity of stenosis increased. If this were so, then a plot of RV peak pressures versus RV mean systolic pressures would be concave upward.
For the positive portion of a sine wave, the ratio of mean amplitude to peak amplitude is 0.71, and for a triangular wave the ratio is 0.5. The data of this study (not illustrated) showed the relationship to be linear [RVsm = 0.73 × RV peak pressure, r = .98], with no evidence of concavity upward on a graph of RV peak pressure versus RVsm. Similarly, Campbell,23 using data provided by Johnson, found that in 25 cases the RVsm was 0.6 times the RV peak pressure, and that the relationship was linear. Bidoggia and others24 stated that the contour was unchanged with increasing severity of stenosis and found the linear relationship, MSG = .60 PG—compared to MSG = .70 PG in our study. The well-documented observations of Vogelpoel and Schrire22 could be explained by a skewing of the pressure curve to the right (a lagging with time) without a change in its basic inverted U shape. A similar phenomenon is seen in aortic stenosis, where there is a prolonged rise to the peak aortic pressure.
The area of the normal pulmonary valve is 4 to 5 cm.2 The rectangular hyperbolic relationship between peak gradient and pulmonary valve area (fig. 1d) is expected. The equation could be rewritten PG × (PVA)1.22 = 33. It is apparent that the gradient across the pulmonary valve is small unless the area is less than 1 cm.2
Electrocardiographic Data
Cosby and co-workers4 were among the first to publish correlations of the electrocardiogram with cardiac function. Using data obtained from patients with various congenital heart diseases that caused increased right ventricular load, they found poor correlation between right ventricular work and electrocardiographic findings. Data from patients with mitral stenosis showed reasonable correlation (reliability coefficients of .3 to .65) between voltages in the precordial leads (Rv1, Rv3R, Sv6) and RVWI and RV pressure.
Right ventricular pressure and work are subject to wide variation with changes in cardiac output. However, pulmonary valve resistance and pulmonary valve area should be independent of the flow, and might, therefore, be expected to correlate better with the electrocardiographic findings which under ordinary circumstances are unchanged by differences in cardiac output. This hypothesis is supported by the data of figures 2 and 3. The use of the work index rather than work improved the correlation but it was still only slightly better than correlation with the pressure gradient alone. It is evident that the height of Rv1 correlated better with the functional severity of pulmonary stenosis as defined by our hydraulic criteria than was indicated by other investigators4, 12, 19, 20 who considered only pressure data. Cayler and co-workers12 found a higher correlation value (r = .78) between RV peak pressure and Rv1. Probably this is partly attributable not only to the large group (119 cases) but also to the limited age range of their group (only eight were more than 15 years of age). It was their impression “that any calculation becomes less valid in older children and adults.” They reported no data on the pressure gradient or the flow.
Children exhibited higher voltage complexes in lead V1 (fig. 2a and 3a) than did adults with the same pressure gradient. Similarly, Cayler and co-workers12 observed that the ratio of RV pressure to the height of Rv1 increased with the age of the patients. This difference is lessened when other hemodynamic calculations are considered (fig. 2b, c, and d and 3b, c, and d). Presumably the higher voltages are associated with the thinner chest walls of children.
Rightward and forward deviation of the QRS axis is a well accepted sign of increased right ventricular load. This has often been reported for the frontal plane7, 11, 14, 19, 20, 25 (classical right axis deviation) but occurred in only a moderate proportion of cases. Yahini, Dulfano, and Toor13 pointed out that correlation of the frontal ÂQRS with right ventricular pressure was not good, an observation supported by our data (in fig. 4, the correlation coefficient between PG and ÂQRS was .39). DePasquale and Burch20 obtained a correlation coefficient of .53 between the RV peak pressure and the frontal ÂQRS. The frontal T-wave axis (ÂT, fig. 4), although seldom considered previously, was obviously much more closely related to the pressure gradient (r = −.75) and, therefore, is deserving of attention.
T-wave inversion in the right precordial leads is often used as an indication of RV pressure loading or hypertrophy8, 9, 11, 19, 20 although normal in children—actually, upright T waves in V3R or V1 are associated with increased RV pressure in children less than 12 years of age or so. The data shown in figure 5 indicate that the progression of T-wave inversion from the right to the left precordium (r = .47) was no more closely related to the pressure gradient than was forward and rightward deviation of the horizontal QRS axis (r = .50).
The use of the QRS-T angle in either plane might be expected to increase the correlation with pressure gradient, since the ÂQRS and ÂT deviated in opposite directions with increasing pressure. The correlation between the peak gradient and the QRS-T angle in either plane is good (r = .72 for both). The ease of measurement of this angle in either plane, coupled with the reliability of association with the pressure gradient, indicates that it could be used clinically to good advantage.
The average of the QRS-T angles in the two planes was calculated. This simple measure cannot be considered as analogous to the ventricular gradient,20 since the information regarding magnitude of the vectors and their positions in three dimensional space has been ignored. The results obtained (fig. 6) show an improved correlation with peak gradient (r = .83) but not with the pulmonary work index, pulmonary valve resistance, or pulmonary valve area.
Patterns in Lead V1
In this study, a higher incidence of double positive deflections existed in those cases in which there was the least hemodynamic abnormality (fig. 7). Double positive deflections occur frequently in lead V1 in normal young people.26, 27 Fuhrmann28 found an rsr′ or an RR′ complex in V1 in 50 per cent of 3-month-old infants. The incidence apparently decreases with age of normal patients, being 12 to 25 per cent in athletes and 25 per cent in the 1,000 airforce recruits studied by Plas and associates.29 Analysis of simultaneous intracardiac and precordial electrocardiographic recordings led Kert and Hoobler30 to conclude that notching or slurring of the upstroke of the R wave in lead V1 had the same significance as the initial R of a double positive deflection. On this basis one might argue that 35 of the 43 patients with mild and moderate stenosis had patterns that Cabrera and Monroy5 termed indicative of “diastolic overloading of the right ventricle.”
Concerning systolic overloading of the right ventricle, Cabrera and Monroy5 stated that the QRS complex usually remained neat, of a monophasic (positive) or diphasic type (an RS, Rs or qR complex), for a long time and also that the notched and polyphasic QRS complex appeared only when the systolic overloading was complicated by diastolic overloading. Our data (group 3, fig. 7) allow agreement with the former statement but not with the latter. On the basis of the hemodynamic situation Cabrera and Monroy5 stated that systolic overloading became diastolic when tricuspid insufficiency developed or that systolic overloading became composite when incomplete emptying of the right ventricle occurred in severe pulmonary stenosis. Our data provide no information to confirm or deny this impression, since patients with any indication of tricuspid insufficiency on clinical examination, in right atrial pressure tracings, or in indicator-dilution curves were excluded from this study. However, our data show polyphasic complexes mainly in patients without severe stenosis. This clear disagreement with Cabrera and Monroy’s statement that the percentage of cases in which electrical signs of right bundle-branch block occur is higher as the mean pressure of the pulmonary artery increases is also seen in other published data.7, 8, 25, 31 Cabrera and Gaxiola6 recognized some deficiency in the 1952 paper and said that a better description of such situations is achieved by considering the spatial vectorcardiographic alterations of the heart field. This 1959 paper does not contain numerical data, however, and they admit that the “statements are still lacking a statistical analysis to demonstrate a valid significant relation.”
Summary and Conclusions
From complete cardiac catheterization data on 53 patients with pulmonary stenosis and intact ventricular septum without other hemodynamic abnormality, calculations of the peak gradient across the valve, right ventricular work index, pulmonary valve resistance, and pulmonary valve area were made. The correlations between these values and various electrocardiographic features were estimated. Correlation of the peak voltage in lead V1 with pulmonary valve resistance or pulmonary valve area (whose values are determined from flow and pressure values) was better than with the pressure gradient. This improved correlation is probably due to the fact that pulmonary valve area and resistance can be expected to remain constant in spite of variations in cardiac output which are necessarily accompanied by changes in pressure and work.
Moderately good correlation was found between the hydraulic variables and the mean manifest QRS and T-wave axes in both the frontal and horizontal planes. The QRS-T angle in either plane showed better relationships with the hemodynamic values. An average for each patient of the angles in the two planes provided the best correlation with the pressure gradient across the valve, and good correlation with work index, valve resistance, and area.
The pattern of the QRS complex in lead V1 showed typical right ventricular systolic-pressure overload patterns, as definied by Cabrera and Monroy,5 in seven of 10 patients with hydraulically severe pulmonary stenosis. However, about 50 per cent of our cases of mild or moderate stenosis exhibited patterns supposedly representative of patients with diastolic or volume overload of the right ventricle. In these cases the overload-pattern approach to diagnosis would be distinctly misleading.
Acknowledgments
Supported in part by Research Grant, H-3532 from the National Institutes of Health, U. S. Public Health Service.
Footnotes
A visual estimate of the systolic mean pressures was made by drawing vertical lines on the graph at the beginning of systole (when RV pressure first exceeded RA pressure) and at the end (when RV pressure was less than PA pressure). A horizontal line was then drawn through each pulse contour at such a level that the area enclosed by this line and the upper part of the pressure curve equaled the sum of the area enclosed by the vertical line at the onset of systole, the horizontal line, and the upslope of the pressure curve, plus the area enclosed by the horizontal line, the downslope of the pressure curve, and the vertical line marking the end of systole. The pressure indicated by the horizontal line was usually not more than 1 mm. Hg and never more than 2 mm. Hg different from the estimate of mean systolic pressure obtained by planimetry.
References
- 1.Myers GB, Klein HA, Stofer BE. The electrocardiographic diagnosis of right ventricular hypertrophy. Am Heart J. 1948;35:1. doi: 10.1016/0002-8703(48)90182-3. [DOI] [PubMed] [Google Scholar]
- 2.Sokolow M, Lyon TP. The ventricular complex in right ventricular hypertrophy as obtained by unipolar precordial and limb leads. Am Heart J. 1949;38:273. doi: 10.1016/0002-8703(49)91335-6. [DOI] [PubMed] [Google Scholar]
- 3.Scott RC. The correlation between the electrocardiographic patterns of ventricular hypertrophy and the anatomic findings. Circulation. 1960;21:256. doi: 10.1161/01.cir.21.2.256. [DOI] [PubMed] [Google Scholar]
- 4.Cosby RS, Levinson DC, Dimitroff SP, Oblath RW, Herman LM, Griffith GC. The electrocardiogram in congenital heart disease and mitral stenosis: A correlation of electrocardiographic patterns with right ventricular pressure, flow and work. Am Heart J. 1953;46:670. doi: 10.1016/0002-8703(53)90220-8. [DOI] [PubMed] [Google Scholar]
- 5.Cabrera E, Monroy JR. Systolic and diastolic loading of the heart. I. Physiologic and clinical data. Am Heart J. 1952;43:661. doi: 10.1016/0002-8703(52)90041-0. [DOI] [PubMed] [Google Scholar]
- 6.Cabrera E, Gaxiola A. A critical reevaluation of systolic and diastolic overloading patterns. Progr Cardiovas Dis. 1959;2:219. doi: 10.1016/s0033-0620(59)80003-7. [DOI] [PubMed] [Google Scholar]
- 7.Dow JW, Levine HD, Elkin M, Haynes FW, Hellems HK, Whittenberger JW, Ferris BG, Goodale WT, Harvey WP, Eppinger EC, Dexter L. Studies of congenital heart disease. IV. Uncomplicated pulmonic stenosis. Circulation. 1950;1:267. doi: 10.1161/01.cir.1.2.267. [DOI] [PubMed] [Google Scholar]
- 8.Abrahams DG, Wood P. Pulmonary stenosis with normal aortic root. Brit Heart J. 1951;13:519. doi: 10.1136/hrt.13.4.519. [DOI] [PMC free article] [PubMed] [Google Scholar]
- 9.Campbell M. Simple pulmonary stenosis. Pulmonary valvular stenosis with closed ventricular septum. Brit Heart J. 1954;16:273. doi: 10.1136/hrt.16.3.273. [DOI] [PMC free article] [PubMed] [Google Scholar]
- 10.Joos HA, Yu PN, Lovejoy FW, Nye RE, Simpson JH. Clinical and hemodynamic studies of congenital pulmonic stenosis with intact ventricular septum. Am J Med. 1954;17:6. doi: 10.1016/0002-9343(54)90137-0. [DOI] [PubMed] [Google Scholar]
- 11.Sodi-Pallares D, Marsico F. The importance of electrocardiographic patterns in congenital heart disease. Am Heart J. 1955;49:202. doi: 10.1016/0002-8703(55)90194-0. [DOI] [PubMed] [Google Scholar]
- 12.Cayler GG, Ongley P, Nadas AS. Relation of systolic pressure in the right ventricle to the electrocardiogram: A study of patients with pulmonary stenosis and intact ventricular septum. New England J Med. 1958;258:979. doi: 10.1056/NEJM195805152582003. [DOI] [PubMed] [Google Scholar]
- 13.Yahini JH, Dulfano MJ, Toor M. Pulmonic stenosis: A clinical assessment of severity. Am J Cardiol. 1960;5:744. doi: 10.1016/0002-9149(60)90050-3. [DOI] [PubMed] [Google Scholar]
- 14.Haywood LJ, Selvester RH, Griggs DE. Correlations of right ventricular work with the vectorcardiogram in pulmonary stenosis. Abstract, Clin Res. 1961;9:62. [Google Scholar]
- 15.Marshall HW, Helmholz HF, Jr, Wood EH. Physiologic consequences of congenital heart disease. In: Hamilton WF, Dow P, editors. Handbook of Physiology: A Critical, Comprehensive Presentation of Physiological Knowledge and Concepts. section 2. Vol. 1. Washington, D. C: American Physiological Society; 1962. p. 417. Circulation. [Google Scholar]
- 16.Gorlin R, Haynes FW, Goodale WT, Sawyer CG, Dow JW, DEXTER L. Studies of circulatory dynamics in mitral stenosis. II. Altered dynamics at rest. Am Heart J. 1951;41:30. doi: 10.1016/0002-8703(51)90003-8. [DOI] [PubMed] [Google Scholar]
- 17.Gorlin R, Gorlin SG. Hydraulic formula for calculation of the area of the stenotic mitral valve, other cardiac valves, and central circulatory shunts. I Am Heart J. 1951;41:1. doi: 10.1016/0002-8703(51)90002-6. [DOI] [PubMed] [Google Scholar]
- 18.Dubois D, Dubois EF. Clinical calorimetry: A formula to estimate the approximate surface area if height and weight be known. Arch Int Med. 1916;17:863. [Google Scholar]
- 19.Grosse-Brockhoff F, Loogen F. Klinik und Hämodynamik der Pulmonalstenose ohne Ventrikelseptumdefekt. Deutsche med Wehnschr. 1959;84:133, 149. doi: 10.1055/s-0028-1113559. [DOI] [PubMed] [Google Scholar]
- 20.DePasquale N, Burch GE. The electrocardiogram and ventricular gradient in isolated congenital pulmonary stenosis. Circulation. 1960;21:181. doi: 10.1161/01.cir.21.2.181. [DOI] [PubMed] [Google Scholar]
- 21.Ziegler RF. Electrocardiographic Studies in Normal Infants and Children. Springfield, Illinois: Charles C Thomas, Publisher; 1951. [Google Scholar]
- 22.Vogelpoel L, Schrire V. Auscultatory and phonocardiographic assessment of pulmonary stenosis with intact ventricular septum. Circulation. 1960;22:55. [Google Scholar]
- 23.Campbell M. Relationship of pressure and valve area in pulmonary stenosis. Brit Heart J. 1960;22:101. doi: 10.1136/hrt.22.1.101. [DOI] [PMC free article] [PubMed] [Google Scholar]
- 24.Bidoggia HJ, Funes JC, Labourt FE, Pietrafesa ER. Method for the determination of potency and work of the right ventricle in pulmonary stenosis with intact ventricular septum. Right ventricular strain index. I Am Heart J. 1956;52:811. doi: 10.1016/0002-8703(56)90147-8. [DOI] [PubMed] [Google Scholar]
- 25.Bentivoglio LG, Maranho V, Downing DF. The electrocardiogram in pulmonary stenosis with intact septa. Am Heart J. 1960;59:347. doi: 10.1016/0002-8703(60)90298-2. [DOI] [PubMed] [Google Scholar]
- 26.Lenègre J. Contributio à l’étude des blocs de branehe comportant notamment les confrontations électriques et histologiques. Arch mal coeur. 1957;50(suppl 1):1. [PubMed] [Google Scholar]
- 27.Said SI, Bryant JM. Right and left bundle-branch block in young healthy subjects. Abstract, Circulation. 1956;14:993. [Google Scholar]
- 28.Fuhrmann W. Über den sogenannten “unvollständigen Rechtssehenkelblock” im Elektrokardiogram des gesunden. Säuglings in den ersten einhunidert Lebenstagen. Monatsschr Kinderh. 1958;106:62. [PubMed] [Google Scholar]
- 29.Plas F, Melon JM, Curveillé J, Bousquet C, Granotier E, Angiboust R. Les problèmes des blocs droits incomplets. Méd aéronaut. 1957;12:295. [PubMed] [Google Scholar]
- 30.Kert MJ, Hoobler SW. Observations on the potential variations of the cavities of the right side of the human heart. Am Heart J. 1949;38:97. doi: 10.1016/0002-8703(49)90796-6. [DOI] [PubMed] [Google Scholar]
- 31.Silver AM, Siderides LE, Antonius NA. The right precordial leads in congenital heart disease manifesting right ventricular preponderance. Am J Cardiol. 1959;3:713. doi: 10.1016/0002-9149(59)90412-6. [DOI] [PubMed] [Google Scholar]


